


vk.com/id446425943
6. Annexes
6.1. EV model analysis: methodology and scope
In section 2., the analysis of production volumes and locations in sections 2.3, 2.4, 2.5 and 2.6 is based on the IHS Markit production database purchased by T&E in early 2019. No adjustements or updates have been made to the data, therefore the results presented only capture insights from the modelling of IHS Markit.
On the other hand, in section 2.2 concerning EV models coming to market in the EU, additional analysis is undertaken by T&E. The global HIS Markit vehicle production database was used as a starting point for the expected carmakers product plans and strategies which provided a skeleton for the analysis. Then, for each model, T&E experts translated production plans into expected availability on the European market based on knowledge of production plans, schedules, public announcements and uptaded information available.
For some models there can be a certain level of uncertainty for the availability of a model and/or for the year of availability. T&E experts have assessed global EV production data and public announcements made by the carmakers to carry out this analysis. Only models were the sales in Europe were deemed likely were taken into account (the model is ignored if there are no clear signals that the vehicle would be available in the EU). As a fall-back option when no market signals were available for the expected availability date in Europe (but sales were confirmed or very likely in Europe), the IHS Markit start of production date was used with a delay of two months to account for the lag between start of production and start of deliveries.
In the database some EVs are updated with only slight changes in the battery size or the engine/motor power. These vehicles were only counted once as this is not considered as a new product. On the other hand, when a model is entirely upgraded (i.e. new model generation, which happen after around 7 years), then it is counted as a new model on the market but not as an additional vehicle available on the market as it replaces the previous version of the model. This analysis includes both cars and vans.
The analysis of models expected on the market only cover the major carmakers, excluding small volume or niche manufacturers (e.g. Borgward, Bollore, e.GO), Chinese manfuacturers (BYD, Chery, etc..) or other foreign manufacturers with uncertain sales in Europe (Lucid Motor, Dyson, etc..), and sport/supercars cars (McLaren, Ferrari, Lamborgini). As a consequence, this analysis is conservative compared to the likely market growth in the next years.
6.2. EVs needed in 2025 & 2030 for CO2 compliance: Assumptions and methodology
Calculation of the EV share in 2025 and 2030 based on the minimum requirement from the CO2 standard
The Table 1 below details the main assumptions used in this model, they are briefly detailed in the text below.
36

vk.com/id446425943
Table 1: Scenario assumptions
Input overview |
|
2021 |
|
|
2025 |
|
|
2030 |
|
|
Scenarios |
WLTP vs. |
EV share (%) |
BEV/PHEV |
PHEV average |
ICE |
BEV/PHEV |
PHEV average |
ICE |
BEV/PHEV |
PHEV average |
NEDC gap |
split |
(g/km) |
improvement* |
split |
(g/km) |
improvement* |
split |
(g/km) |
||
|
|
|
|
|
|
|
|
|
|
|
Base |
20% |
6% |
55% |
50 |
7.3% |
60% |
40 |
12.4% |
65% |
30 |
High_ICE_improvement |
20% |
6% |
55% |
50 |
9.5% |
60% |
40 |
16.0% |
65% |
30 |
Low_ICE_improvement |
20% |
6% |
55% |
50 |
4.5% |
60% |
40 |
7.7% |
65% |
30 |
BEV |
20% |
6% |
60% |
55 |
0.0% |
70% |
50 |
12.4% |
80% |
45 |
PHEV |
20% |
6% |
50% |
45 |
0.0% |
50% |
35 |
12.4% |
50% |
25 |
*ICE improvement: vs. 2021 ICE average
2021EV share (%): 6% (T&E estimates the EU market will be between 5% and 7% in 202132, report). Sensitivity analysis is performed on this assumption and increasing (respectively decreasing) the 2021 EV share by 1% leads to an increase (respectively decrease) of the 2025 EV share of +/-0.9%. However, lower share of EVs in 2021 means lower ICE average emission in 2021, which would in reality likely be balanced out by lower improvement on ICE in the following years. Therefore this assumptions was not considered key and is kept identical in all scenarios.
BEV/PHEV split: as the market matures, BEVs take up a larger proportion of the mix (it was 50%/50% in 2018). See Table 1 above for the assumptions in the different scenarios, base case assumptions are the following:
•2021: 55 % BEV, 45% PHEVs
•2025: 60%/40%
•2030: 65%/35%
PHEV CO2 average (g/km, WLTP): as battery technology prices continue to fall and density increases, PHEVs are likely to see their range increase which gives lower type-approved CO2 emission values. The zero and low emissions vehicle (ZLEV) benchmark sets a threshold at 50gCO2/km to qualify as ZLEV (and thus earn ZLEV credits), and some national taxation systems also use this threshold. This creates an incentive for carmakers to makes PHEVs that emit less than 50g/km but doesn’t incentivise them to go much lower. In 2017, the average emissions for PHEVs was around 54g/km (NEDC). See Table 1 above for the assumptions in the different scenario, base case assumption are the following:
•2021: 50 g/km
•2025: 45 g/km
•2030: 40 g/km
WLTP vs. NEDC gap in 2021: 20% (as supported by car industry estimates & Get Real EU testing programme). This value is used to calculate the 2021 baseline in WLTP which will be higher than the 95gCO2/km in NEDC. In sensitivity analysis, smaller gaps are modeled (e.g. 15%, see T&E report) but the effect of this parameter is minimal. Possible gap inflation, makes the 2021 WLTP baseline higher, therefore the CO2 reduction is easier to achieve as it would be easier for carmakers to reduce their CO2 value (higher starting point) and this would lead to lower necessary EV shares to reach the same emission reduction. This is captured in the scenarios with high or low improvement for the ICE vehicles.
ICE improvement (vs. 2021):
Analysis is performed to calculate the most likely values and three scenarios are modeled (basecase, high improvement and low improvement) based on assumptions detailed below. The outcome of this analysis serves as inputs for the main modeling of EV shares.
To model the expected CO2 emission reduction from the average ICE, the following assumptions were used:
32 Netherlands expects 12% BEV market share of new cars in 2021.
37

vk.com/id446425943
•Share of mild and full hybrids from 2019-2025 based on IHS Markit forecast. The share of mild hybrids increase from 4.5% in 2019 up to 54% in 2025, while the share of full hybrids increase from 1.3% in 2019 to 4.3% in 2025.
•Full HEV CO2 emissions reduction vs. ICE average: 27% in Base scenario (between 24% and 30%). 27% is the CO2 emission reduction when comparing Toyota full hybrids vs. the average for all ICE vehicles (diesel and gasoline) in 2017 based on EEA (Mainstream full HEV scenario). This value was 27% in 2016 and 31% in 2015 and 2014. When Lexus full hybrids are added to the comparison the gain drops to 24% as Lexus vehicles are premium vehicles and thus have higher emissions (Mainstream + Premium full hybrid scenario).
•Mild HEV CO2 emission reduction vs. ICE average: 13.4% in the Base scenario (between 10% and 15%). 13.4% is the average calculated based on several public announcements from carmakers and suppliers33 while 10% and 15% is a realistic range.
•Overall ICE annual improvement: 0.65% annual CO2 emission reduction (between 0.2% and 1.1%). This annual improvement rate is applied to all vehicles, including mild and full hybrids and captures efficiency gains without assuming any difference between conventional ICEs and hybrids. During 2015-2017, the average annual efficiency improvement of conventional ICEs (diesel and petrol) was 0.2% while it was 1.1% over the period 2014-2017. We assume that the current trend in increase of SUV sales will continue over the next decade and this cancels most of the efficiency improvements (e.g. on light weighting). It is widely accepted among automotive industry experts that most of the CO2 emission reduction needed to comply with the post-2020 standards will come from electrification (hybridization and full electrification) since the potential for improvement of traditional ICEs reaches limits in terms of cost-effectiveness (when compared with hybridization strategy) and increase in sales of SUVs and decline in diesel sales is also bound to continue in the 2020s34.
The results from this preparatory modelling, is a 7.3% emission reduction between 2021 and 2025 in the Base scenario, which is equivalent to a 1.9% reduction per annum. The high improvement scenario is based on a 9.5% reduction (2025 vs. 2021), or 2.5% p.a. and the low improvement scenario is a 4.5% reduction (2025 vs. 2021), or 1.1% p.a.
Between 2025 and 2030, this improvement rate will drop mainly because the potential to improve ICE vehicles will nearly flatten and market penetration hybrids will reach saturation. Furthermore, the upfront price of electric cars will be low than for ICE cars35, making EVs sales the preferred compliance strategy. It was assumed that the annual improvement for ICEs between 2025 and 2030 is halved compared to the improvement between 2021 and 2025 (Base: 0.9%, High: 1.2% and Low: 0.6%). Combined with 2021-2025 improvement, we reach the following emission reduction between 2030 and 2021 for ICE: 12.4% in Base scenario, 16.0% in high and 7.7% in low.
The EU + EFTA new car market in 2025 and 2030 is estimated to stay at 2018 level: 15.5 million cars.
The share of EV required for compliance is calculated with the following formula:
Share EV_2025 (%) = (CO2_target_2025 – ICE_CO2avg_2025) / (PHEV_CO2avg_2025*(1-SplitBEV/PHEV_2025) - ICE_CO2avg_2025)
33Ricardo: 10-15% (NEDC) and 15-20% (WLTP), CLEPA (based on Continental data): 10-15%, Continental: 7-10% (NEDC), Renault (Continental system on diesel Scenic): 13% (NEDC), X-Engineer: 13-22% (NEDC) or 7-12%, Mahle: 12% (WLTP)
34For example Volkswagen Group aims at 50% SUV share in 2025 while the market average is 20% in 2014 and 33% in 2018. https://internationalfleetworld.com/volkswagen-aims-for-50-suv-sales-share-by-2025/
35BNEF expects the upfront cost parity to be reached in 2024 (and is getting closer every year):
https://www.bloomberg.com/opinion/articles/2019-04-12/electric-vehicle-battery-shrinks-and-so-does-the-total-cost
38

vk.com/id446425943
Endnotes
iEuropean Environment Agency (EEA), EEA greenhouse gas – data viewer, 06/06/2017: https://www.eea.europa.eu/data-and- maps/data/data-viewers/greenhouse-gases-viewer
iiEEA, EU greenhouse gas emissions at lowest level since 1990, 06/12/2016: https://www.eea.europa.eu/highlights/eu-greenhouse- gas-emissions-at
iiiEEA https://www.eea.europa.eu/highlights/increase-in-eu-greenhouse-gas
ivThenational.ae : https://www.thenational.ae/world/europe/eu-fails-to-agree-on-plan-for-carbon-neutral-economy-by-2050- 1.877173
vTransport & Environment, https://www.transportenvironment.org/publications/trumps-us-relegates-eu-third-place-ev-race
viTransport & Environment:
https://www.transportenvironment.org/sites/te/files/publications/2018_04_CO2_emissions_cars_The_facts_report_final_0_0.pd f
viiTransport & Environment: https://www.transportenvironment.org/publications/trumps-us-relegates-eu-third-place-ev-race
viiiTransport & Environment:
https://www.transportenvironment.org/sites/te/files/publications/EV%20briefing_04_03_2019%20FINAL.pdf
ixTransport & Environment: https://www.transportenvironment.org/press/vw%E2%80%99s-electric- %E2%80%98offensive%E2%80%99-must-be-matched-infrastructure-and-green-taxation
xBNEF 2019 EV Outlook, https://www.bloomberg.com/opinion/articles/2019-04-12/electric-vehicle-battery-shrinks-and-so-does- the-total-cost
xihttps://www.electrive.com/2019/03/21/german-carmaking-giants-agree-on-strategy/
xiiElectrek: https://electrek.co/2019/02/12/toyota-anti-electric-vehicle-ad-corolla-hybrid/
xiiiEuropean Commission: https://ec.europa.eu/growth/industry/policy/european-battery-alliance_en
xivEuractiv: https://www.euractiv.com/section/batteries/news/europe-risks-second-mover-status-on-battery-tech-auditors-warn/
xvhttp://www.elexica.com/- /media/files/training/2019/03%20march/mining%20masterclass/benchmark%20mineral%20intelligence%20- %20robert%20colbourn%20presentation.pdf
xviLeMonde: https://www.lemonde.fr/economie/article/2019/06/23/batteries-electriques-l-europe-sonne-la-
charge_5480387_3234.html
xviiElectrive: https://www.electrive.com/2019/02/04/catl-plans-up-100-gwh-battery-factory-in-germany/
xviiiInsideevs: https://insideevs.com/news/341124/lg-chem-to-increase-battery-production-in-poland-to-70-gwh/
xixEnergypost: https://energypost.eu/the-european-battery-alliance-is-moving-up-a-gear/
xxLeMonde: https://www.lemonde.fr/economie/article/2019/06/23/batteries-electriques-l-europe-sonne-la- charge_5480387_3234.html
xxiInsideevs: https://insideevs.com/news/335478/sk-innovation-begins-construction-of-75-gwh-battery-plant-in-hungary/
xxiiElectrive https://www.electrive.com/2019/02/27/hungary-sk-innovation-to-build-second-battery-factory/
xxiiiInsideevs: https://insideevs.com/news/348957/farasis-build-battery-plant-germany/
xxivElectrive: https://www.electrive.com/2019/07/09/svolt-plans-battery-cell-factory-in-europe/
xxvElectrive: https://www.electrive.com/2018/03/15/gsr-capital-invests-in-nevs-building-battery-factory/
xxviReuters: https://www.reuters.com/article/us-autos-batteries-europe-factbox/factbox-plans-for-electric-car-battery- production-in-europe-idUSKCN1J10N8
xxviiBloomberg NEF: https://www.bloomberg.com/news/articles/2018-12-21/global-demand-for-batteries-multiplies
xxviiiElement Energy, Battery on Wheels,
https://www.transportenvironment.org/sites/te/files/publications/2019_06_Element_Energy_Batteries_on_wheels_Public_repor t.pdf
xxix Transport & Environment: https://www.transportenvironment.org/sites/te/files/publications/Electric%20buses%20arrive%20on%20time.pdf
xxxBased on T&E visit to BYD battery cell factory near Shenzhen, China in April 2019.
xxxiJoint Research Center (JRC): http://publications.jrc.ec.europa.eu/repository/bitstream/JRC108043/kjna28837enn.pdf
xxxiiJoint Research Center (JRC): http://publications.jrc.ec.europa.eu/repository/bitstream/JRC108043/kjna28837enn.pdf
xxxiii2014: ICCT, European Vehicle Market Statistics, Pocketbook 2018/19 and 2018: European Environment Agency (EEA), Provisional data for the average CO2 emissions from new passenger cars and vans registered in the EU and in Iceland in 2018 (published on the 24/06/2019).
xxxivEEA: https://www.eea.europa.eu/highlights/average-co2-emissions-from-new
xxxvTransport & Environment, https://www.transportenvironment.org/publications/carmakers-still-failing-hit-their-own-goals- sales-electric-cars
xxxviReuters, 9 January 2019, https://www.reuters.com/article/us-autoshow-detroit-electric-exclusive/exclusive-vw-china- spearhead-300-billion-global-drive-to-electrify-cars-idUSKCN1P40G6
xxxviiIG Metall :
https://www.igmetall.de/download/20190605_Faktenblatt_Transformationskurzarbeitergeld__ad5c79ba937cc7628d88a0ddebe6 2b5fe65bb89f.pdf
39

vk.com/id446425943
GLOBAL INVESTMENT COMMITTEE / COMMENTARY |
AUGUST 2019 |
|
|
On the Markets
MICHAEL WILSON
Chief Investment Officer
Chief US Equity Strategist
Morgan Stanley & Co.
TABLE OF CONTENTS
Global Cycle Matters for the Fed
2Learn why US policymakers need to consider developments abroad.
Recession Playbook
5In our view, recession risk is rising. What should investors do?
The Tide Is Shifting to Other Shores
We expect non-US stocks to start
8 outperforming the US, and the best way to play that is with active management.
The Price of Government Intervention
9 Ironically, antitrust actions have helped targeted companies solidify market share.
Short Takes
We examine why inflation should remain
11in check; note that China’s economy and stock markets are on divergent paths; and assess the impact of ETF closures.
MBS Returns Are Poised to Improve
12Mortgage securities’ returns can pick up as the market prices refinancing risk.
Q&A: Go for the Gold?
13Two experts talk about what’s propelling this year’s gold rally.
The Consolidation Continues
It seems like in order to do well over the past 18 months, investors just had to remember one simple rule: “Don’t fight the Fed.” In 2018, the Federal Reserve’s aggressive tightening contributed to a bear market for most stocks while this year’s equally aggressive dovish pivot has contributed to a new bull market for some. Since we made our call for a multi-year consolidation in global equities 18 months ago, we have seen the average global stock and index flat-to-down 10% while the S&P 500 Index rose about 5% with a lot of intermittent ups and downs. In short, we’ve seen a consolidation that finds us at the top end of our forecasted range thanks to the Fed’s policy pivot.
On July 31, the Fed delivered on its dovish pivot by cutting interest rates by 25 basis points, or one quarter of 1%. That’s a good thing, but with stocks having already rallied so strongly this year, investors must decide if the Fed’s cuts can deliver the growth necessary to justify current or higher prices. With most of our leading indicators continuing to trend lower, we think no. Furthermore, the second quarter earnings season thus far has failed to dispel our concern that there is still more risk in consensus earnings forecasts. If we’re right, the reacceleration in prices that equity markets now expect will fail to materialize.
Therefore, we are not surprised at the initial negative reaction in the stock market to the Fed’s rate cut, the first since December 2008. We expect a 10% correction for equity markets broadly, and 20% in the more crowded growth stocks, which have become increasingly expensive.
What about the lesson of not fighting the Fed? Well, history suggests that Fed pauses after a long rate hiking campaign like we had in January lead to a strong market rally— and that’s exactly what we had this year. However, the beginning of a new rate-cutting cycle is typically not good for stocks, with the last two examples being September 2007 and January 2001. The lesson is that while a change in Fed policy can affect financial conditions—and hence, asset prices—almost immediately, reversing an economic slowdown with easier monetary policy takes time. Stay more defensively oriented in your portfolios until this fall. That’s when we expect the slowdown to be more properly priced.
vk.com/id446425943
ON THE MARKETS / ECONOMICS
Why the Global Cycle
Matters for the Fed
CHETAN AHYA
Chief Economist and Global Head of Economics Morgan Stanley & Co.
For some time, policymakers outside the US have had to contend with the spillover effects of the US business cycle and the impact of US monetary policy on
their domestic economies and monetary policy. We’ve now come full circle, with international developments featuring more prominently in the Federal Reserve’s reaction function. Fed Chair Jerome Powell’s repeated references to the global economy in his recent congressional testimony have drawn attention, but for the past few years policymakers’ comments have increasingly emphasized the impact of international developments on the US.
As Fed Vice Chair Richard Clarida mentioned in a recent speech, the trade/GDP ratio has risen to nearly 30% in 2018 from 18% in 1980; financial linkages (in the form of external assets and liabilities) have climbed to 300% of GDP from less than 50%; and the broad
correlation of US equity markets with the rest of the world has been rising steadily, too (see chart below, and page 3).
We highlight two further reasons why international development matters more now. First, multi-national companies have increasingly sourced a rising share of their profits from overseas markets, with the share of overseas income almost doubling to more than 20% of GDP in 2018 from 10% in 1980. Second, the influence of the rest of the world (ROW) has increased over time. The ROW’s share of global GDP in purchasing power parity terms has risen, while that of the US has declined from 22% in 1980 to 15% in 2018.
How Global Shocks Affect US Growth and Inflation
Greater integration with the ROW will transmit global shocks to the US economy and directly or indirectly influence both parts of the Fed’s dual mandate of maximum employment and stable prices. A 2009 Fed discussion paper posited that a
US Trade/GDP Ratio Has Been Rising Steadily
35%
US Total Trade Percent of GDP, Trailing Four Quarters
30
25
20
15
10
5
0
1965 |
1971 |
1977 |
1983 |
1989 |
1995 |
2001 |
2007 |
2013 |
2019 |
Source: Haver Analytics, MS & Co. Research as of July 17, 2019
1% fall in foreign output would have a
0.3% impact on US GDP, with the effect more than doubling to 0.7% if the US experienced a liquidity trap. Considering that this paper was published a decade ago and that the US economy is more integrated globally today, the impact has probably increased. Slower global demand will affect both demand for US exports as well as the international operations of US multi-national companies and their profits, with spillover effects on their domestic capital expenditures and hiring decisions. On the inflation front, a recent working paper by the Bank for International Settlements suggests that global factors now play an increasingly important role in explaining CPI inflation rates across countries, too.
While the direct impact on the real economy from these linkages takes time to play out, they can often be amplified by changes in financial conditions, which tend to occur far more rapidly. For instance, via the exchange rate channel, it has been estimated before that a 10% appreciation of the dollar’s real effective exchange rate would reduce GDP by between 75 and 100 basis points.
Global Shocks’ US Impact
In the past 20 years, there have been three distinct episodes in which shocks from ROW found their way to US shores: the Mexican peso crisis, the Asian financial crisis and the collapse of LongTerm Capital Management in the late 1990s; the 2011-2013 European recession; and the 2015-2016 China slowdown. The Fed responded on all three occasions by cutting rates or delaying planned hikes.
In the current episode, global growth outside the US began to slow at a 3.0% annual rate in the second quarter from 3.6% in 2018’s second half. However, US growth had diverged from the rest of world, even accelerating on a year-over- year basis until the first quarter of 2019, as the fiscal stimulus tailwinds supported growth.
Please refer to important information, disclosures and qualifications at the end of this material. |
August 2019 |
2 |
vk.com/id446425943
Indeed, that strong trailing growth momentum was instrumental in the removal of monetary accommodation up until late last year. However, with fiscal tailwinds fading, a deeper slowdown in global economic activity is more noticeable in the US. This downdraft and trade tensions are now dampening US growth, especially in the more internationally exposed segments of trade and manufacturing, while weighing on corporate sentiment and business investment as well.
High-frequency growth indicators are
showing a sharp loss of economic momentum. For instance, the manufacturing ISM index has declined by almost five points between January and July, and the composite ISM has fallen by 4.4 points between February and July. The new orders subcomponent of the manufacturing ISM index has declined by almost eight points; more significantly, after a period of outperformance relative to ROW in 2017 and 2018, it has converged very quickly to levels seen elsewhere. To be sure, while the domestic side of the economy appears to be holding
up well, the effects of the slowdown are also much more visible in the trade, manufacturing and business investmentlinked sectors. Capital goods imports contracted 2.2% year over year and shipments of durable goods ex defense slowed to an annualized 2.0% rate in May after posting recent peak growth of 9.2% and 7.8%, respectively, in September 2018. Clearly, the downside to growth is in the external side of the economy. The concern is that the weakness in the global cycle will flow through in time.
How the US Economy Is Increasingly Linked to the Rest of the World
External Assets and Liabilities Are Near 300% of GDP |
US Equities Are More Correlated With Global Equities |
||||||||||||||||||||||||||||
350% |
US External Assets and Liabilities, |
|
|
|
|
|
90% |
US and Rest of World Equities Six-Month Correlation |
|||||||||||||||||||||
|
|
|
|
|
|
80 |
|||||||||||||||||||||||
300 |
Percent of GDP |
|
|
|
|
|
|
|
|
|
|
|
|
|
|
|
|
|
|
|
|
|
|
|
|||||
|
|
|
|
|
|
|
|
|
|
|
|
|
|
|
70 |
|
|
|
|
|
|
|
|
|
|
|
|
|
|
|
|
|
|
|
|
|
|
|
|
|
|
|
|
|
|
|
|
|
|
|
|
|
|
|
|
|
|
|
|
250 |
|
|
|
|
|
|
|
|
|
|
|
|
|
|
|
60 |
|
|
|
|
|
|
|
|
|
|
|
|
|
200 |
|
|
|
|
|
|
|
|
|
|
|
|
|
|
|
50 |
|
|
|
|
|
|
|
|
|
|
|
|
|
|
|
|
|
|
|
|
|
|
|
|
|
|
|
|
40 |
|
|
|
|
|
|
|
|
|
|
|
|
|
|
|
|
|
|
|
|
|
|
|
|
|
|
|
|
|
|
|
|
|
|
|
|
|
|
|
|
|
|
|
|
150 |
|
|
|
|
|
|
|
|
|
|
|
|
|
|
|
30 |
|
|
|
|
|
|
|
|
|
|
|
|
|
|
|
|
|
|
|
|
|
|
|
|
|
|
|
|
|
|
|
|
|
|
|
|
|
|
|
|
|
|
|
100 |
|
|
|
|
|
|
|
|
|
|
|
|
|
|
|
20 |
|
|
|
|
|
|
|
|
|
|
|
|
|
|
|
|
|
|
|
|
|
|
|
|
|
|
|
|
|
|
|
|
|
|
|
|
|
|
|
|
|
|
|
50 |
|
|
|
|
|
|
|
|
|
|
|
|
|
|
|
10 |
|
|
|
|
|
|
|
|
|
|
|
|
|
|
|
|
|
|
|
|
|
|
|
|
|
|
|
|
0 |
|
|
|
|
|
|
|
|
|
|
|
|
|
|
|
|
|
|
|
|
|
|
|
|
|
|
|
|
|
|
|
|
|
|
|
|
|
|
|
|
|
|
|
|
0 |
'76 |
'79 |
'82 |
'85 |
'88 |
'91 |
'94 |
'97 |
'00 |
'03 |
'06 |
'09 |
'12 |
'15 |
'18 |
-10 |
'95 |
'97 |
'99 |
'01 |
'03 |
'05 |
'07 |
'09 |
'11 |
'13 |
'15 |
'17 |
'19 |
|
|
||||||||||||||||||||||||||||
Source: Haver Analytics, MS & Co. Research as of July 17, 2019 |
|
Source: Bloomberg, MS & Co. Research Cross-Asset Strategy Team as |
|||||||||||||||||||||||||||
|
|
|
|
|
|
|
|
|
|
|
|
|
|
|
|
of July 17, 2019 |
|
|
|
|
|
|
|
|
|
|
|
||
More US Profits Are Coming From Abroad |
|
|
|
US Share of Global GDP Has Been Declining |
|
|
|||||||||||||||||||||||
30%
25
Overseas Profits Percent of Total Profits,
Three-Year Moving Average
20
15
10
Share of World GDP*
24% US (left axis)
Rest of World (right axis)
22
20
18
16
14
IMF Projections
87%
85
83
81
79
5 |
|
|
|
|
|
|
|
|
|
|
12 |
|
|
|
|
|
|
|
|
|
|
|
77 |
|
|
|
|
|
|
|
|
|
|
|
|
|
|
|
|
|
|
|
|
|
|
||||
|
|
|
|
|
|
|
|
|
|
|
|
|
|
|
|
|
|
|
|
|
|
|
|
|
0 |
|
|
|
|
|
|
|
|
|
|
10 |
|
|
|
|
|
|
|
|
|
|
|
|
75 |
|
|
|
|
|
|
|
|
|
|
|
|
|
|
|
|
|
|
|
|
|
|
|||
'60 |
'66 |
'72 |
'78 |
'84 |
'90 |
'96 |
'02 |
'08 |
'14 |
'80 |
'84 |
'88 |
'92 |
'96 |
'00 |
'04 |
'08 |
'12 |
'16 |
'20 |
'24 |
|||
Source: Haver Analytics, MS & Co. Research as of July 17, 2019 |
|
*Purchasing Power Parity |
|
|
|
|
|
|
|
|
|
|||||||||||||
|
|
|
|
|
|
|
|
|
|
|
Source: Haver Analytics, MS & Co. Research as of July 17, 2019 |
|
|
|||||||||||
|
|
|
|
|
|
|
|
|
||||||||||||||||
Please refer to important information, disclosures and qualifications at the end of this material. |
|
|
|
August 2019 |
3 |
|||||||||||||||||||

vk.com/id446425943
Implications for the Fed
With this framework in mind, what does the outlook hold and what does it imply for the policy response by the Fed?
International developments are not encouraging. Our projection is that global growth outside the US will remain below trend, and global capital spending will likely remain in low gear. The “uncertain pause” in trade talks between the US and China, lingering trade tensions between the US and Mexico and the EU, as well as the emergence of trade tensions elsewhere, remain overhangs on the macro outlook. This suggests to us that corporate confidence is likely to stay muted and the risks to the global outlook are still skewed to the downside.
Domestic growth provides little comfort. As noted, the US economy has lost momentum in the past three to six months, particularly in the manufacturing, trade and investment-related segments. We expect overall growth to slow to 1.6% in the second half on a sequential quarterly average basis. With growth already expected to slow below potential and the risks to the outlook skewed to the downside, a sharper slowdown will bring corporate credit risks to the fore. That’s because corporate leverage has picked up significantly in recent years, especially among riskier borrowers. Hence, if downside risks materialize, it could result in a tightening of financial conditions.
The case for a strong policy response is supported. The core Personal Consumption Expenditures Index is currently at a 1.6% annual rate, below the Fed’s 2.0% inflation goal. Market-based measures of inflation expectations have also softened, nearing a three-year low. The softness in inflation and inflation expectations is again reminding us of the problems that central banks face in keeping inflation closer to their targets and inflation expectations anchored. This challenge was prominent earlier in the cycle. However, if inflation expectations take a further hit as growth weakens, it could resurface, threatening the credibility of the central bank’s commitment to its goals.
Please refer to important information, disclosures and qualifications at the end of this material. |
August 2019 |
4 |
vk.com/id446425943
ON THE MARKETS / EQUITIES
Recession Risk Is Rising.
What Should You Do?
ADAM VIRGADAMO, CFA
Equity Strategist
Morgan Stanley & Co.
SERENA W. TANG, CFA
Strategist
Morgan Stanley & Co.
Recession risk is rising. Our economists recently lowered growth forecasts
across the board. They see uncertainty from trade tensions as already having done significant damage, with whatever easing that may come likely insufficient to revive growth; if trade tensions escalate, the global economy and the US may fall into a recession.
For now, the path to the bear case of a US recession is still narrow, but not unrealistic. While our US Economics team’s own recession probability indicator points to only a 13% chance of a recession in the next 12 months, they have also
highlighted a significant loss of momentum in business activity over recent months, even as the services sector and consumers appear to be in good health. Hence, their subjective probability stands at 20%. If trade tensions escalate further, our economists see the direct impact of tariffs interacting with the indirect effects of tighter financial conditions and other spillovers, potentially leading consumers to retrench. Companies may start laying off workers and cutting capital spending as profit margins are hit further and uncertainty rises. The large negativedemand shock that ensues could drive the US economy into a recession, with GDP growth falling to -0.1% in 2020 from this year’s expected 2.2%.
Rising risks and our review of market performance around prior recessions
Waiting for NBER Confirmation of a
Recession Means Investors Miss Out
`
2.0% Monthly Returns During US Recessions
1.5S&P 500 10-Yr. US Treasury Bond
1.0
0.5
0.0
-0.5
-1.0
-1.5
Before NBER Announcement |
After NBER Announcement |
Note: Shows averages for the last five US recessions where data exists. Price return for equities, total return for bonds. Before NBER announcement is the period between the date when a recession begins and the announcement date. The after announcement period is between the announcement date and the end of the recession.
Source: Morgan Stanley & Co. Research as of July 22, 2019
support our more cautious view on risk assets. As growth slows, markets tend to be forward-looking. US Treasury yields tend to have already fallen by about 50 basis points by the time the economy peaks, equities and credit tend to start lagging typical returns during the 12 months before a recession starts and equity returns generally shift outright negative shortly before and into the first few months of recessions.
Above all, we’re watching the US consumer and employment data. A review of 100-plus data series helped us establish some of the more reliable signals of where decelerations could mean recession is ahead. The most consistent of these center around employment and US consumer confidence, income and spending.
Employment. Survey data around the availability of jobs can confirm turns in the unemployment rate and slowing job creation (and eventually job loss). Once job growth goes negative and the unemployment rate rises, a recession is hard to avoid.
Consumers. Stagnating consumer earnings growth, declines in consumer confidence by more than 15% year over year and growth in real personal consumption expenditures falling below 2.5% year over year are all warning signs of a potential recession.
Corporates. Falling durable goods orders and ISM manufacturing purchasing manager indexes sustainably below 50 tend to line up with recessions.
Aggregate Indicators. Sustained year- over-year growth below 2% in the Conference Board Coincident Indicators Index and its Leading Indicators Index going below 0% year over year both tend to reliably lead recessions.
Current trends are just outside the danger zone, but could be heading there. Comparing the recession signals above with current trends shows that many data points are still outside of the danger zone—but history tells us that these series can deteriorate rapidly, and current
Please refer to important information, disclosures and qualifications at the end of this material. |
August 2019 |
5 |
vk.com/id446425943
deceleration trends continuing would materially increase the risk of recession. Some investors may believe action from the Federal Reserve will be enough to support growth and the equity market, but the history is mixed. Midcycle Fed cuts are supportive of growth and risk assets. Still, with a lot of existing tightening in the system due to recent hikes and Quantitative Tightening, manifest deceleration and lingering uncertainty over trade policy, we think the midcycle argument is not a sure thing. If cuts are not enough to stave off recession, risk assets will not work. For example, US equities have been down between roughly 15% and 50% from their prerecession peaks at the end of prior cycles, notwithstanding a Fed that is cutting rates.
With recession risks rising, it is important to understand which asset classes are most likely to be caught off guard, or which are pricing in the lowest probability of recession. Using probability models across asset classes, we find that US BBB credit spreads and US equities, particularly large caps, are pricing in fairly low probabilities of a recession. This contrasts with the relatively higher recession risk priced in the three- month/10-year US Treasury yield curve, which has been inverted for two months. On the other hand, the lack of any inversion and recent steepening in the two- year/10-year curve implies a lower risk of recession. In commodities, gold and copper are pricing in a relatively higher risk of recession compared with Brent oil, which paints a more sanguine picture.
Asset Class Returns Around Recessions
Since recessions do not announce themselves when they arrive and markets are forward-looking, history suggests that investors should not wait for confirmation of a recession before getting more defensive in their asset allocation. Patience does not pay when it comes to recessions; an investor who rotates to bonds from equities only after a recession is confirmed by the National Bureau of Economic
US Equities Tend to Reclaim Losses After the
NBER Declares a Recession Has Begun
105 |
|
|
|
|
|
|
|
|
|
|
|
|
100 |
|
|
|
|
|
|
|
|
|
|
|
|
95 |
|
|
|
|
|
|
|
|
|
|
|
|
90 |
S&P 500 Average Return* |
|
|
|
|
|
|
|
|
|||
|
|
|
|
|
|
|
|
|
||||
85 |
Last Five Recessions |
|
|
|
|
|
|
|
|
|||
Last Three Recessions |
|
|
|
|
|
|
|
|
||||
|
|
|
|
|
|
|
|
|
||||
80 |
Average Performance** |
|
|
|
|
|
|
|
|
|||
-12 -10 -8 |
-6 |
-4 |
-2 |
0 |
2 |
4 |
6 |
8 |
10 |
12 |
||
|
||||||||||||
|
|
|
Months Around NBER Announcement |
|
|
|||||||
*100=12 months before recession begins **Through-the-cycle average since 1980 Source: Bloomberg, Morgan Stanley Research as of July 22, 2019
Research (NBER) would have both felt the worst of equity underperformance and missed out on substantial positive bond returns leading up to the announcement date (see chart, page 5). Here are a few observations across asset classes that stood out to us from our review of the past five US recessions.
●There is a large overlap between recessions and equity bear markets.
Four out of the last five US recessions were associated with a bear market, all of which started either before or at the same time as the macro peak; the lone recession that did not see a 20% drawdown still saw a 17% sell-off.
●Equities and credit are most vulnerable, while bonds outperform during a recession.
●Non-US risk assets tend to see bigger drawdowns than US markets during US recessions. This is largely because these periods coincide with global slowdowns. Another explanation could be that foreign markets are less liquid.
●Credit spreads have reliably widened and the yield curve dependably steepened going into and out of the start of the past five recessions. Large variations exist across the past episodes in terms of magnitude and timing, but these two assets have displayed similar behavior in all of them.
●The NBER recession declaration is a good buy signal. Given the considerable identification and confirmation lag inherent in the NBER’s recession calls, by the time a macro peak is officially confirmed, risk markets tend to be looking toward the subsequent recovery; on average, since 1980, by the time a recession is confirmed, the slowdown is roughly 70% passed (see chart above). Paradoxically, the NBER’s recession confirmation tends to be a good signal to get more constructive on equities, credit and commodities.
Equities During Recessions
The worst performance for most industry groups has tended to come in the three-month period after the start of recession, with widening dispersion of returns thereafter. Here are a few of the more reliable trends:
●Persistent outperformance. Health care equipment and services, pharmaceuticals/biotech/life sciences and food/beverage/tobacco tend to outperform on an absolute and relative basis. To a lesser extent, household and personal products, software and utilities show relative outperformance, but with wider variance.
●Persistent underperformance. Autos and tech hardware have a strong tendency
Please refer to important information, disclosures and qualifications at the end of this material. |
August 2019 |
6 |

vk.com/id446425943
to continue weakening through recessions. Though the trend is not as clearly persistent, the same is also true of capital goods, materials, media/entertainment and telecom. Semiconductors also show a trend toward weakening, but their volatility really stands out.
●Watching for a rebound. Consumer durables/apparel, restaurants/leisure and retailing all have a tendency to show solid rebounds in relative performance starting a few months after recessions begin. Commercial services (a mix including waste management firms, data providers, pest control, auction services and professional staffing) and transportation also show similar patterns, though with generally stronger performance through the entire recession.
●Sizes and styles. Low-quality stocks display consistently poor performance after the start of recessions. Defensives tend to outperform cyclicals, though we were a bit surprised that telecom and utilities, two of the more traditional
defensive sectors, did not display as strong a tendency to outperform.
Current trailing returns indicate the market is pricing in some recession risk. Defensive leadership in the past 12 months shows equities have been positioning for slowing growth, but this is more true in some industry groups than in others:
●Weak relative performance perhaps already priced. Autos, capital goods, energy, materials and transportation are all currently near or below the average trailing 12-month returns seen before prior recessions. This is not to say that further downside cannot follow, but it does indicate that a lot of bad news is already in the prices. Given the tendency of autos to continue weakening during a recession, we would avoid this sector if economic data worsens. However, we think that the other groups, particularly transportation, may bottom sooner than the market expects.
●Strong relative performance perhaps already priced. Household/ personal products, software, telecom,
utilities and large caps versus small caps are all currently near or above the trailing 12-month relative outperformance seen before prior recessions. This possibly limits further relative outperformance typically seen in recessions.
●Strong relative performance not priced. Despite general defensive leadership in the market, food/beverage/ tobacco and health care equipment and services are both lagging the average return patterns before prior recessions. We think this can be explained by structural changes and political risk, but in an environment in which the economy contracts, we think these industry groups can still offer relative outperformance.
This article was excerpted from “The Recession Playbook,” published by Morgan Stanley Research on July 22, 2019. For a copy of the complete report, contact your Financial Advisor.
Please refer to important information, disclosures and qualifications at the end of this material. |
August 2019 |
7 |
vk.com/id446425943
ON THE MARKETS / THEMATIC INVESTING
The Tide Is Shifting
To Non-US Stocks
SACHIN MANCHANDA
Senior Equity Strategist
Morgan Stanley Wealth Management
With the US equity market making new highs and outperforming non-
US markets, investors have been frustrated with international diversification—and for good reason. Non-US markets have been underperformers for the past decade. However, the Global Investment Committee (GIC) believes that potential catalysts for better non-US growth are lining up, as evidenced by the European Central Bank transition to new leadership, resolution of geopolitical squabbles and stimulative efforts, especially from China (see The GIC Weekly, July 29).
A topping of the US dollar, which the GIC also expects, may help the pendulum to swing outside the US. That’s where operating leverage, market beta, valuations and risk premiums are more attractive— and so are the dividends. While the S&P 500 yields 1.9%, the MSCI All Country World Index ex US has a 3.3% payout.
Even though non-US stock markets
broadly have lagged the US for the past decade, there have been several opportunities in single stocks of non-US domiciled companies. In fact, in the past 10 years, on average 73% of the 100 bestperforming companies over $2 billion in market cap in the MSCI All World Country Index were non-US (see chart). Active investing still could have generated better returns in non-US equities even in the years when the broad indexes generally lagged. This should become even better if non-US markets start to outperform.
In fact, we see several more cohorts outside the US that offer structural growth opportunities at relatively reasonable valuations. So, with the tide turning and in favor of the non-US equities, where do we find the fastest and the best boats?
Indian consumers. We see a long-term opportunity in Indian companies, especially those catering to domestic consumers. The structural drivers of India’s growth story haven’t changed—it remains a powerful domestic consumption story. In fact, India has entered a phase of
As Foreign Markets Lagged, They Had Stellar Stocks
100 |
Non-US Stocks Among the 100 Best Performers* |
||||||||||||||||||||||||||||||
87 |
|
|
|
|
|
|
|
|
|
|
|
|
|
|
|
|
|
|
|
|
|
|
87 |
|
|
|
|
|
|||
|
|
|
|
|
|
|
|
|
|
|
|
|
|
|
|
|
|
|
85 |
|
|
|
|
|
|
||||||
90 |
|
|
|
|
|
83 |
|
|
|
|
|
|
|
|
|
|
|
|
|
|
|
|
|
||||||||
|
|
|
|
|
|
|
|
|
|
|
|
|
82 |
|
|
|
|
|
|
|
|
||||||||||
|
77 |
|
|
|
|
|
|
|
|
|
|||||||||||||||||||||
|
|
|
|
|
|
|
|
|
|
|
|
|
|
|
|
|
|
|
|
|
|
|
|
||||||||
80 |
|
|
|
|
|
|
|
|
|
|
|
|
|
|
|
|
|
|
|
|
|
|
|
|
|
|
|
|
|
||
|
|
|
|
|
|
|
|
|
|
|
|
|
|
|
|
|
|
|
|
|
|
|
|
|
|
|
|
|
|||
|
|
|
|
|
|
|
|
|
|
|
|
|
|
|
|
|
|
|
|
|
|
|
|
|
|
|
|
|
|||
|
|
|
|
|
|
|
|
|
67 |
|
|
|
|
|
|
|
|
|
|
|
|
|
|
|
|||||||
|
|
|
|
|
|
|
|
|
|
|
|
|
|
|
|
|
|
|
|
64 |
|
|
|||||||||
70 |
|
|
|
|
|
|
|
|
|
|
|
|
|
|
|
|
|
|
|
|
|
|
|||||||||
|
|
|
|
|
|
|
|
|
|
|
|
|
|
|
|
|
|
|
|
|
|
|
|
|
|
|
|
|
|||
|
|
|
|
|
|
|
|
|
|
|
54 |
|
|
|
|
|
|
|
|
|
|
|
|
|
|
|
|||||
60 |
|
|
|
|
|
|
|
|
|
|
|
|
|
|
|
|
|
|
|
|
|
|
|
|
|
|
|
|
|
||
|
|
|
|
46 |
|
|
|
|
|
|
|
|
|
|
|
|
|
|
|
|
|
|
|
|
|
|
|
||||
50 |
|
|
|
|
|
|
|
|
|
|
|
|
|
|
|
|
|
|
|
|
|
|
|
|
|
|
|
|
|
||
|
|
|
|
|
|
|
|
|
|
|
|
|
|
|
|
|
|
|
|
|
|
|
|
|
|
|
|
|
|
|
|
40 |
|
|
|
|
|
|
|
|
|
|
|
|
|
|
|
|
|
|
|
|
|
|
|
|
|
|
|
|
|
|
|
|
|
|
|
|
|
|
|
|
|
|
|
|
|
|
|
|
|
|
|
|
|
|
|
|
|
|
|
|
|
|
|
30 |
|
|
|
|
|
|
|
|
|
|
|
|
|
|
|
|
|
|
|
|
|
|
|
|
|
|
|
|
|
|
|
|
|
|
|
|
|
|
|
|
|
|
|
|
|
|
|
|
|
|
|
|
|
|
|
|
|
|
|
|
|
|
|
20 |
|
|
|
|
|
|
|
|
|
|
|
|
|
|
|
|
|
|
|
|
|
|
|
|
|
|
|
|
|
|
|
|
|
|
|
|
|
|
|
|
|
|
|
|
|
|
|
|
|
|
|
|
|
|
|
|
|
|
|
|
|
|
|
10 |
|
|
|
|
|
|
|
|
|
|
|
|
|
|
|
|
|
|
|
|
|
|
|
|
|
|
|
|
|
|
|
|
|
|
|
|
|
|
|
|
|
|
|
|
|
|
|
|
|
|
|
|
|
|
|
|
|
|
|
|
|
|
|
0 |
|
|
|
|
|
|
|
|
|
|
|
|
|
|
|
|
|
|
|
|
|
|
|
|
|
|
|
|
|
|
|
|
|
|
|
|
|
|
|
|
|
|
|
|
|
|
|
|
|
|
|
|
|
|
|
|
|
|
|
|
|
|
|
2009 2010 2011 2012 2013 2014 2015 2016 2017 2018
*Stocks in the MSCI All World Country Index above $2 billion in market capitalization; returns are in US dollars
Source: Bloomberg as of July 29, 2019
“demographic dividend,” which, according to the United Nations Population Fund, is the economic growth potential that can result from shifts in a population’s age structure. This comes about mainly when the working-age population (15 to 64 years) is larger than the non-working-age population (14 and younger, and 65 and older). In the past, many economies such as Japan, China and South Korea had rapid growth in the demographic dividend phase. To capture this growth, we recommend investing in large privatesector banks. With supportive trends on US and Indian interest rates and oil prices as well as strong underlying earnings growth and improved asset quality, we see an upside opportunity in these banks.
Chinese internet. With the valuation spread between US and Chinese internet stocks at an all-time wide, we believe that Chinese internet stocks offer a strong opportunity. There are macro overhangs in China, but we see an idiosyncratic opportunity in some of the internet companies, given their long runway of growth, monopolistic or duopolistic market structures and depressed valuations. No doubt China’s growth is moderating—but, with policy support and lower valuations, we see a long-term value opportunity in this consumer tech-oriented cohort.
Barbell in Europe. Europe has been a cause of frustration for investors, especially those who have owned European indexes. They have higher weightings in value sectors such as financials, industrials and materials, while the S&P 500 has more technology-driven sectors. Thus, owning the market exposure has not been the right strategy in Europe. We recommend a barbell approach in Europe, pairing idiosyncratic opportunities in quality defensives such as consumer staples along with cheap cyclicals in industrials and energy. With a dividend yield of 5.6%, the European energy sector is one place where equity investors could pick up good income.
Please refer to important information, disclosures and qualifications at the end of this material. |
August 2019 |
8 |

vk.com/id446425943
ON THE MARKETS / THEMATIC INVESTING
`What Is the Cost of
Government Intervention?
SCOTT HELFSTEIN, PhD
Market Strategist
Morgan Stanley Wealth Management
SEAN A. O’LOUGHLIN
Market Strategist
Morgan Stanley Wealth Management
Technology titans involved in online search, social media and mobile communications have been thrust into the regulatory spotlight. Last month, the US Department of Justice (DOJ) opened an
investigation into the possibility of anticompetitive practices. Also, the House Judiciary Committee said it would open an inquiry into business practices for the common good. While such activities raise uncertainty and add short-run market risk, we believe that regulatory-induced weakness represents a buying opportunity for long-term investors.
MARKET RISKS. Of course, there is risk that cannot be underestimated. The tech giants in question together account for almost $4 trillion in market cap, making up a significant percentage of the S&P 500’s capitalization. Growth-oriented
investors with concentrations in these companies, as well as passive index investors, will be affected and should pay attention. That said, history shows that those with a long time horizon may not need to be deeply concerned.
Investors can try to discern the risks by studying the history of government intervention. In 1911, the federal government moved to break up Standard Oil. Though it appeared to be a significant blow to founder John D. Rockefeller, the action had unintended consequences. Rockefeller remained a significant shareholder in the various entities that emerged and, in the years that followed, the value of his holdings in each company doubled or tripled. By 1913, his personal worth was equivalent to nearly 2% of the entire US GDP.
STRIKING PATTERN. Here we explore five cases of regulatory and legal action in six industries. A striking pattern emerges. In the short run, increased regulation increased operating costs, impairing
productivity and was ultimately a drag on stocks. However, in many cases, higher costs also help the existing firms with larger market share solidify their positions. Profit margins took a hit in the first two years of each regulatory and legal action. Yet, two years later, the largest players had generally increased their profit margins considerably and their equities outperformed benchmarks.
Let’s take a closer look at how government intervention affected various companies and industries:
Telecoms. After AT&T’s breakup, seven regional Bell operating companies (RBOCs), GTE and two other independent regional companies made up the national telecom industry. AT&T survived as a long-distance provider. The local RBOCs operated as government-sanctioned monopolies, while long-distance service was more competitive and open to new entrants. The Telecommunications Act of 1996 aimed to foster competition by requiring the local monopolies to provide new entrants’ interconnectivity with their networks.
As a result, the RBOCs sought growth through acquisition. In April 1997, 14 months after the bill was signed, Southwestern Bell Corporation (SBC) acquired Pacific Telesis Group, parent
Exhibit 3: Relative Performance of the Top Five Companies in an Industry
Typically Began to Turn Upward 12 to 24 Months Following Regulatory Event
Average Relative Performance Telecoms
Tobacco
1.6 Software & Services
Managed Care
1.4 Diversified Financials
1.2 Consumer Finance
1.0
0.8
0.6 |
|
|
|
|
|
|
|
|
||
|
Underperformance as |
|
|
Outperformance as market leaders consolidate their position |
|
|||||
0.4 |
|
investors overreact |
|
|
|
|||||
|
|
|
|
|
|
|
|
|||
|
|
|
|
|
|
|
|
|||
|
0 |
6 |
12 |
18 |
24 |
30 |
36 |
42 |
48 |
|
Months Following Regulatory Action
Source: Morgan Stanley Wealth Management Market Research and Strategy, Bloomberg
Please refer to important information, disclosures and qualifications at the end of this material. |
August 2019 |
9 |

vk.com/id446425943
company of Pacific and Nevada Bell. This was the first of many RBOC mergers in the next 10 years, culminating in the eventual merger of SBC with AT&T. The telecommunications industry is now dominated by three major players, all of whom have roots in the former RBOCs: AT&T, Verizon and CenturyLink. A massive industry consolidation would seem contradictory to the stated goal of fostering competition.
Interestingly, while increased competition in markets should generally cut into profit margins, the opposite took place. In the two years following the 1996 regulation, the average profit margin of the five largest firms by revenue expanded to 11% from -6%. While these firms underperformed the broader market during that time, they still had a nearly 70% cumulative total return.
Tobacco. In the November 1998 Master Settlement Agreement (MSA), the five largest cigarette manufacturers and the attorneys general of 46 states agreed to restrict certain industry practices and make payments to cover public health costs in exchange for protection from future lawsuits brought by state governments.
The payments from tobacco companies to the MSA states were among the largest penalties imposed. According to the Public Health Law Center at the University of Minnesota, at the time of the settlement the net income of the top five companies totaled just $7.7 billion, compared with penalty payments of $4.5 billion. The nonmonetary aspects of the agreement, however, ultimately had more impact.
The agreement restricted outdoor advertising, media product placement, brand name sponsorships and free samples. These rules made it more difficult for new entrants to develop brand recognition. As such, leadership in the tobacco industry solidified. In the two years following the MSA, the top five companies’ market share by revenue grew to 83% from 80%, while the market share of the next 15 companies fell to 15% from 16%. Likewise, despite substantive annual payments, the top five’s profits grew by
30% during those two years compared with losses for the lower-tier firms.
Technology. In 1998, the US Department of Justice (DOJ) sued Microsoft for engaging in illegal anticompetitive behavior, claiming the firm used a market-leading position in operating systems to hinder internet browsers competing with Microsoft’s Internet Explorer. In its November 2001 settlement with the DOJ, Microsoft agreed to share its source code for five years, allowing competitors’ browsers seamless functionality with the Windows operating system. Four years after the settlement, Microsoft maintained a powerful position despite this regulatory compromise. It was still the second-largest company by revenue in software and services and Windows’ share of desktop operating systems grew. Revenues increased 185% of those of the third-largest company, up from 130% of the third-largest company in four years. Microsoft’s success was partially a result of the way benefits accrue in a market characterized by network effects. In the settlement, the company made a strategic decision to increase their compatibility with competitors and enhance the overall value of the network. In moving to an open architecture, Microsoft became the nexus around which the internet-connected software industry grew. Microsoft ultimately embraced the benefits of open architecture and solidified leadership. The unintended consequences of regulation allowed Microsoft to gain share in a rapidly growing industry.
Health Care. Among other goals, the Affordable Care Act (ACA) attempted to reduce the number of the uninsured. Initial evidence suggests that the regulation raised underlying costs for health care providers, possibly contributing to consolidation of market power among the largest firms. The ACA was signed into law by President Obama in 2010 and consisted of 10 separate reforms designed to set standards at the federal level and reframe the financial relationship between Americans and the health care system.
In the early years, the five largest companies’ operating expenses grew by
more than 30%. As a result, many of the smaller insurers were not equipped to deal with the ACA’s added costs and administrative requirements. The top players had the scale and sophistication to manage the increased demand from newly insured patients and changes to processing payments. Four years after the passage of the ACA, the five largest companies’ market share had grown to 48% from 39%.
Financial Services. While the primary goal of regulation coming out of the financial crisis was to improve the stability of the US economy, the increased regulatory standards and additional compliance aimed at larger banks and financial institutions proved burdensome to smaller banks. A Federal Deposit Insurance Corp. study of banks with less than $10 billion in assets noted that the increased compliance costs associated with the 2010 Dodd-Frank Wall Street Reform and Consumer Protection Act had a negative impact on their businesses. These costs included hiring new compliance personnel, increased reliance on outside compliance experts, software and hardware updates and time spent on employee training. Owing to economies of scale, the increased costs of complying with regulatory officials forced a greater consolidation of the banking industry, and the number of community banks in the US between Dodd-Frank's passage in 2010 and late 2016 fell by 20%.
As the number of banks declined, banking assets were increasingly concentrated in the largest banks. According to the FDIC, the top five firms within the financial services industry held almost half of the industry’s market share. Total assets for these five largest firms grew by 12% after Dodd-Frank—further evidence that only the largest players were equipped to succeed in the wake of new industry regulations.
This article was an excerpt from the July 8, 2019, issue of Geo-Markets. For the complete report, ask your Financial Advisor.
Please refer to important information, disclosures and qualifications at the end of this material. |
August 2019 |
10 |
vk.com/id446425943
ON THE MARKETS / SHORT TAKES
Softening Unit Labor Costs Suggest Inflation May Remain in Check
Economists compute nonfarm unit labor costs by dividing total labor costs by total output. Put another way, this measure tracks how much businesses pay workers to produce one “widget” and, as such, provides a uniform gauge for monitoring inflationary pressures. With higher productivity, companies may increase employee compensation without triggering higher inflation. Tighter labor markets raise competition for qualified workers and may prompt higher unit labor costs. Even with today’s relatively tight job market, unit labor costs have remained in check (see chart). That’s because of low interest rates and soft commodity prices. This backdrop appears to offer sufficient cover for the Federal Reserve’s intentions to cut its key policy rate.–Christopher Baxter
Core CPI (three-mo. avg, |
left axis) |
|
|
||
4% Nonfarm Unit Labor Costs |
|
|
7% |
||
(advanced 12 months, right axis) |
|
|
|||
3 |
|
|
|
|
5 |
|
|
|
|
3 |
|
|
|
|
|
|
|
2 |
|
|
|
|
1 |
1 |
|
|
|
|
-1 |
|
|
|
|
-3 |
|
|
|
|
|
|
|
0 |
|
|
|
|
-5 |
2005 |
2008 |
2011 |
2014 |
2017 |
2020 |
Source: Bloomberg as of July 24, 2019
China’s Economy and Its Stock Market Take Divergent Paths
China GDP Growth, Year Over Year (left axis) 16 % Shanghai Shenzhen CSI 300 Index (right axis)
15
14
13
12
11
10
9
8
7
6
2002 2004 2006 2008 2010 2012 2014 2016 2018
Source: Bloomberg as of July 25, 2019
Given the inherent connection between the overall economy and corporate profits, stock prices tend to follow relatively stronger or
800 weaker macroeconomic growth. In recent years, however, China’s
700major equity indexes have diverged from decelerating economic growth with a strong upward move this year (see chart). Along with
600other global indexes, Chinese equity prices have moved higher, in part due to efforts to open its capital markets to a wider pool of
500 foreign investors. The recent inclusion of China in the MSCI indexes and efforts to host Nasdaq-like markets support capital inflows. At
400 present, individual investors account for some 70% of equity trading, which may lead to greater volatility than other peer markets. As
300 China’s economy matures, slower GDP growth appears likely, given the natural tendency toward slower growth among larger, more
200 developed economies. Still, greater capital market openness may
100allow broader participation from institutional investors, potentially dampening volatility and promoting more investor-friendly corporate governance.—–Nicholas Lentini and Zev Mayer
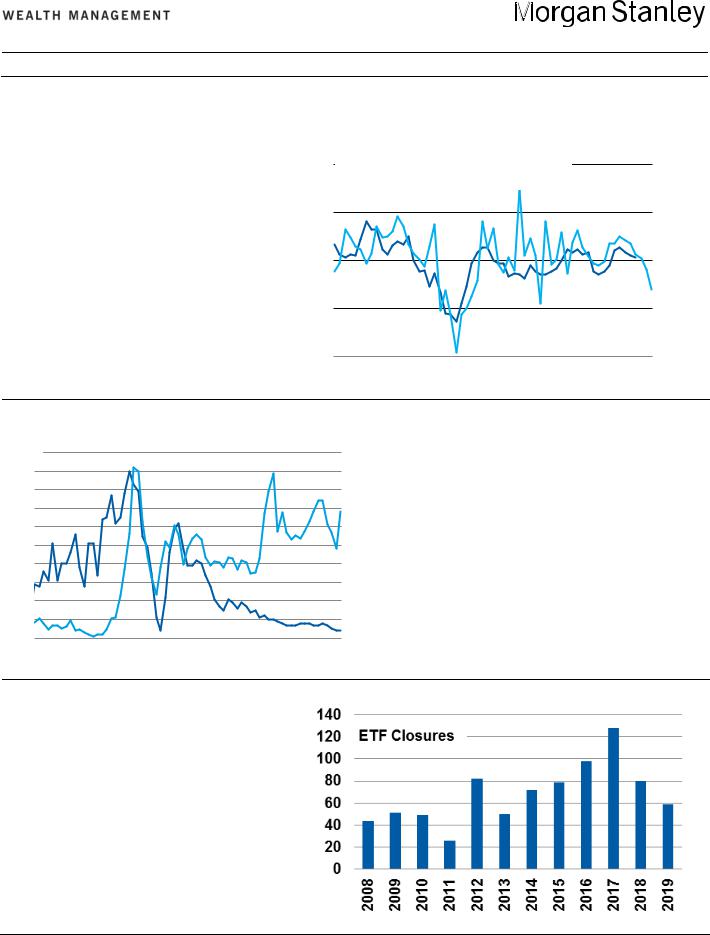
ETF Liquidations Are Up This Year, but That’s Not a Sign of Weakness
Despite strong global equity and bond performance this year, exchange-traded funds (ETFs) have experienced a meaningful amount of liquidations, whereby the fund ceases trading and returns cash to shareholders. By our count, 59 ETF closures have occurred in 2019, with several more announced. Some may see this as weakness in the ETF universe; this year’s pace already outnumbers some full-year totals (see chart). We view these concerns as overblown. ETF closures can be healthy as these tend to occur with ETFs that are unable to garner significant assets. The average assets of those ETFs liquidated this year are under $20 million, which likely makes them unprofitable for the issuer. What’s more, closures are still below trend compared with 2017’s record 128, and total assets recently hit a new milestone with $4 trillion in assets under
management spread across 2,120 ETFs.—Gray Perkins
Source: Bloomberg,. Morgan Stanley Wealth Management as of July 5, 2019
Please refer to important information, disclosures and qualifications at the end of this material. |
August 2019 |
11 |
vk.com/id446425943
ON THE MARKETS / FIXED INCOME
Mortgages Lagged, but
Returns Could Pick Up
DARREN BIELAWSKI , CFA
Fixed Income Strategist
Morgan Stanley Wealth Management
Typically a modest performer in strong risk-on markets, mortgage-backed
securities (MBS) underperformed US Treasuries on an excess-return basis in the first half, prior to moving into positive territory in July. With a 0.32% excess return for the year to date, they lag the 4.62% of investment grade corporates, which benefited from tighter credit spreads along with strength in broader risk assets.
PREPAYMENT OPTIONS. A primary driver of this lackluster performance is the embedded optionality in the structure of the underlying mortgages. Recall that homeowners have the option to prepay their mortgage prior to maturity either by refinancing, selling their home or paying more than principal currently owed. What is a potential benefit to homeowners is a risk for investors in mortgage-backed securities. This “prepayment risk” rises as
market conditions increase the likelihood that individual borrowers prepay mortgages quicker than anticipated. This risk increases as interest rates drop sufficiently below the rate of the underlying mortgages to incentivize borrowers to refinance or rising volatility increases the chance that rates fall to such levels. To wit, we have seen higher-coupon mortgages underperform lower ones.
The first half witnessed both a decline in interest rates as well as a rise in interest rate volatility, catalyzed by the Federal Reserve’s dovish turnaround on US monetary policy. Mixed economic data, rising trade tensions and dovish central banks globally have driven a reversal in interest rate expectations and pricing. The 10-year US Treasury yield declined 125 basis points since the recent highs in October, while the Merrill Lynch Option Volatility Estimate (MOVE) Index, a measure of interest rate volatility, reached
As Mortgages Rates Fell, Potential Refinancings Rose
5.75 %/Years |
|
|
|
0% |
|
5.25 |
|
|
|
|
10 |
4.75 |
|
|
|
|
20 |
4.25 |
|
|
|
|
30 |
3.75 |
30-Yr. Mortgage Rate* (left axis) |
40 |
|||
|
MBS Index Effective Duration** (left axis) |
|
|||
3.25 |
MS & Co. Truly Refinanceable Index |
50 |
|||
2.75 |
(inverted, right axis) |
|
60 |
||
|
|
|
|
||
Jan '18 |
May '18 |
Sep '18 |
Jan '19 |
May '19 |
|
*National average **Bloomberg Barclays US Mortgage-Backed Securities Index Source: Bloomberg as of July 22, 2019
its highest levels since 2016. Additionally, the Morgan Stanley Market Implied Pace of Rate Hikes (MSP0KE) Index, which last fall registered 3.6 interest rate hikes in the next 12 months, now indicates nearly four interest rate cuts in the coming year.
REFINANCINGS JUMP. Mortgage rates have tracked the decline in Treasuries, down 100 basis points since late last year. As a result, refinancings which were previously uneconomical have become attractive; the Morgan Stanley Truly Refinanceable Index, which represents the percentage of borrowers who have at least a 25-basis-point financial incentive to refinance their 30-year mortgages, rose to 57% in June from below 10% at the end of last year (see chart). Actual refinancings have reached the highest level since 2016, according to the Mortgage Bankers Association Refinancing Index, with effectively all outstanding coupons in the MBS index pricing above par compared with 69% at the beginning of 2019.
This refinancing activity has reduced the MBS duration as interest rates decline, just when investors desire additional interest rate risk—what’s called “negative convexity.” The impact is perhaps most evident when viewed relative to investment grade corporates. While the duration of the Bloomberg Barclays US Mortgage-Backed Securities Index has declined to 3.15 years from 5.50 years late last year, the duration of the corporate index has extended to 7.73 years from 7.05 years over the same period as corporate borrowers have taken advantage of lower rates to refinance their debt.
BETTER RETURNS? While year-to- date performance has lagged riskier assets, much of the repricing of mortgage securities may have occurred in recent months. If the Federal Reserve delivers accommodative policy as expected and interest rate volatility continues to subside, improved mortgage market returns from July should continue in the second half while also providing ballast to overall portfolios.
Please refer to important information, disclosures and qualifications at the end of this material. |
August 2019 |
12 |

vk.com/id446425943
ON THE MARKETS / Q&A
Should Investors
Go for the Gold?
The gold market is glittering these days, with the price of the hard asset
up 11.6% so far this year. Currently, the Global Investment Committee is suggesting that investors consider commodities like gold as a hedge to a weaker dollar—but how should interested investors pursue exposure? “There is no single right way to access gold,” says Juan Carlos Artigas, director of investment research at the World Gold Council. “All the different ways are going to provide different benefits and different characteristics.” Artigas and Nick Thompson, a gold trader at Morgan Stanley, recently shared a historical perspective on investing in gold with Morgan Stanley Wealth Management’s Tara Kalwarski. The following is an edited version of their conversation.
TARA KALWARSKI (TK): How has gold evolved as an investment opportunity?
JUAN CARLOS ARTIGAS (JA): The most important thing about gold is that it has been part of human civilization for millennia, and it has been utilized for many purposes. In 1971, the gold standard ended and the US dollar was no longer pegged to gold. From that point on, the price of gold was dictated by market dynamics, giving us the opportunity to study its behavior and its role relative to other asset classes.
What is key is that gold has a dual nature. Most investors tend to focus quite a bit on gold’s role as a safe haven or as a hedge in times of systemic risk. It is also important to understand that there is another side of gold that is linked to consumption, as in jewelry or as a
component of electronics. From that perspective, there’s a positive link between the expansion of the global economy and demand for gold.
Now, the role that gold plays in a portfolio is not just a source of potential returns, based on this long-term link to consumption, but also that of diversification. Over the long run, gold’s correlation to stocks is very low. It’s one of the few assets that when the stock market is falling, the correlation between gold and stocks usually becomes more and more negative. This becomes a useful tool, because it’s actually providing diversification to a portfolio exactly when investors need it.
TK: Can you give us a sense of what contributes to determining the value of gold?
JA: Gold’s price can be understood from the dynamics of demand and supply. When we talk about demand, we’re not only talking about demand for jewelry or technology or bars and coins—or even central bank demand. There’s also demand that happens on the over-the-counter market, and the activity that happens on exchanges that influence price.
We’ve done a lot of work in terms of understanding gold’s performance and gold drivers, and we’ve narrowed down the drivers of the price of gold into four main categories. The first two are what we call strategic drivers. If you are a strategic investor who is looking at gold as a longterm asset that will be part of your asset allocation over the long run, these two things probably matter most: economic expansion and risk/uncertainty.
Economic expansion is linked to consumer demand. It basically says that over longer periods of time, the expansion of the economy and the demand that comes from jewelry, technology and longterm savings influence gold’s behavior.
The second strategic driver, risk/uncertainty, works in the sense that when there is heightened risk, and when there is more uncertainty, many investors tend to use gold as a way to hedge. This, in turn, increases demand, which usually increases price performance.
The other two drivers are opportunity cost and momentum, which are tactical drivers. They usually have much more influence over gold’s price in shorter periods of time. Over a long period of time, their influence decreases.
Opportunity cost simply means when you’re investing in gold, you’re not investing in something else. That is a choice that investors are making based on what they see around them. One factor that exemplifies this opportunity cost between gold and something else is interest rates.
When interest rates are high, it’s more likely investors will be putting money in bonds or in the bank rather than in gold. Another way to explain this is the dollar. Usually, there’s a long-term negative correlation between the dollar and gold, and if the dollar strengthens quite a bit there’s a tendency for investors to choose the dollar over gold.
The final category, momentum, is something that will not only apply to gold, but to all assets. The point there is that, when there are positive trends in gold’s price, it tends to make gold attractive and people start to get into the asset—and momentum works on the downside as well.
TK: What are the different choices investors have for accessing gold?
NICK THOMPSON (NT): There are so many ways to buy gold now that were not available even 10 years ago. The passive
Please refer to important information, disclosures and qualifications at the end of this material. |
August 2019 |
13 |

vk.com/id446425943
exchange-traded funds (ETFs) are an excellent way to gain exposure to the price action of gold. Most of the larger ETFs have performed well, in terms of their correlation to the spot market, and they have proven themselves as proxies for physical gold even in times of duress. ETFs, due to their scale, usually have smaller management charges than say, physical gold, which can vary with the size of the physical holding. I think that these products make a lot of sense for investors who are looking to be more tactical.
Investors also can get exposure through gold mining equities, or an ETF that offers a diversified basket of these companies.
It’s worth noting that there are idiosyncratic risks to every miner such as location, labor issues and, of course, the health of the mine. They have to manage their own businesses and balance sheets— and the gold mining business is not known to be the most stable with respect to use of leverage and locations. Generally, there have been periods when the miners underperform the spot market dramatically. There are also periods when they can outperform, such as right now. Investors can look to an actively managed mutual fund or a closed-end fund with a manager with a proven track record who offers exposure to gold mining companies or other equity-related investments related to gold.
Lastly, the most obvious and established option would be the physical format, which has a couple of unique characteristics in the sense that it is able to be delivered and provides diversification away from paper or electronic assets. It is typically more expensive to buy than an ETF, because you’re paying for the physicality of it related to minting charges from governments or manufacturing charges from refiners. There are also handling costs, too: If you were to buy a 1,000-ounce bar that weighs 70 pounds, someone needs to pick it up and move it— and they need to be compensated for that embedded cost. There are also carry costs associated with physical, which comes in the form of storage charges, whereby the
investor needs to pay for the safekeeping and insuring through a third party. Storing with a bank enables the investor to access immediate liquidity.
Finally, investors have the opportunity to take delivery and store it on their own, which entails risk though potentially cheaper in the long run.
TK: What is the case for gold now? JA: We think that financial market
uncertainty and global monetary policy are very supportive of gold investments right now. Central banks have done a 180degree turn in terms of monetary policy.
Our research actually shows that in periods of negative real rates—not negative nominal rates, like the ones that investors in Europe are experiencing— usually gold’s performance is twice as high as its long-term performance.
In other words, negative interest rates tend to be quite supportive of gold demand, and that phase is just now beginning. Of course, history does not necessarily dictate exactly what the future may look like, but it can give you a little bit of an insight in terms of the influence that opportunity costs and interest rates have had on gold’s performance.
The other thing is that interest rates have been very low for a really long time. That has, in itself, created interesting dynamics in the market. Part of the bull market in equities is because of economic growth, but another good portion of that is linked to the fact that we have a fairly benign monetary policy environment—and we’re likely going to get an even more accommodative policy, which, in turn, is not only increasing the prices of stocks but also increasing valuations. That means investors can expect additional stock market volatility, and many of them are preparing to mitigate and to hedge that volatility. You can see why gold is definitely top of mind for many, many investors and it’s why we are expecting gold investment demand to be well supported in the next six to 12 months.
At the same time, I do want to say that, in our economic outlook, we are also
expecting weaker GDP growth. That could soften consumer demand.
Investment demand may offset that effect of weaker consumer demand. Then, there are a lot of structural economic reforms that are being implemented in both India and in particular China, the two largest gold-consuming countries, to strengthen their economies long term. Even if we see weakness and uncertainty in the near term, there are all these policies out there to strengthen long-term demand.
TK: Nick, what are you seeing in terms of investor demand?
NT: Now, we are seeing the institutional investors coming into the market and expressing a bullish view in both the outright spot and options markets. This has helped contribute to the recent breakout, and gold trading at five-year highs corresponds with the activity and interest we are seeing from institutional buyers.
However, I am not seeing the demand from individual investors. The premiums for physical bars and minted coins are actually at record lows, which is a function of this anemic investor demand. In terms of relative value, physical is worth considering as many of the products available in the secondary market are trading less than the stated government mint premiums. Physical gold should be considered as a sound compliment to the other forms we have discussed, especially given this prevailing market dislocation.
It’s an exciting time to be in the gold market, and my own opinion is that we are in the early innings of a sustained bull market. If one considers strong institutional demand accompanied by weak individual investor demand to be a positive leading indicator, then gold is an asset worth considering. ■
Juan Carlos Artigas is not an employee of Morgan Stanley Wealth Management or its affiliates.
Opinions express by him are solely his own and may not necessarily reflect those of Morgan Stanley Wealth Management or its affiliates.
Please refer to important information, disclosures and qualifications at the end of this material. |
August 2019 |
14 |