

- •HIGHLIGHTS
- •TABLE OF CONTENTS
- •Supply cushion insures against losses
- •DEMAND
- •Summary
- •Fundamentals
- •OECD
- •OECD Americas
- •OECD Europe
- •Europe disaffection for diesel accelerated in 2018
- •OECD Asia Oceania
- •Non-OECD
- •China
- •India
- •Other Non-OECD
- •SUPPLY
- •Summary
- •OPEC crude oil supply
- •Non-OPEC overview
- •REFINING
- •Summary
- •Margins
- •OECD refinery throughput
- •Non-OECD refinery throughput
- •STOCKS
- •Summary
- •Recent OECD industry stock changes
- •OECD Americas
- •OECD Europe
- •OECD Asia Oceania
- •Other stock developments
- •PRICES
- •Market overview
- •Futures markets
- •Spot crude oil prices
- •Spot product prices
- •Freight
- •TABLES
- •Table 1: World Oil Supply And Demand
- •State of the Markets
- •State of the Markets: Second Quarter 2019
- •State of the Markets: Second Quarter 2019
- •Fears of a Macro Slowdown Have Investors on Edge
- •Tech Rises to the Top
- •Nontraditional Industries Prime for Disruption
- •Beyond the Bay: Startups Extend to New Cities
- •Fundraising: Venture Dollars Climb from All Sides
- •VCs Raising More Capital with Each Trip Back to LPs
- •New Funds Move to Institutionalize Early Rounds
- •Diverse Pools of Capital Chase Innovation Returns
- •Next Wave of Capital Will Come After Lockups
- •M&A: Acquisitions Slow as Startups Aim for Growth
- •Opting for Growth Capital vs. an Early Exit
- •Across US, Valuations Climb for M&A
- •Bucking the Trend: Financial Acquisitions Mount
- •US Tech Looks To International Opportunities
- •Regulations: Potential New Hurdles for Exits
- •Tech Giants Spend Big but Now Face Scrutiny
- •Attractive Acquisition Values from Big 5 in Jeopardy
- •CFIUS Could Impact 20% of VC-Backed Acquisitions
- •Unicorns Rely on Capital Boosts From Abroad
- •A Steady Climb: Building Venture in Canada
- •Startup to Scale-Up: Canadians Face “Valley of Death”
- •As Foreign Capital Arrives, Toronto Cements Its Place
- •AI: An Opportunity for Canada to Lead the World
- •Appendix
- •Authors
- •Disclaimers
vk.com/id446425943
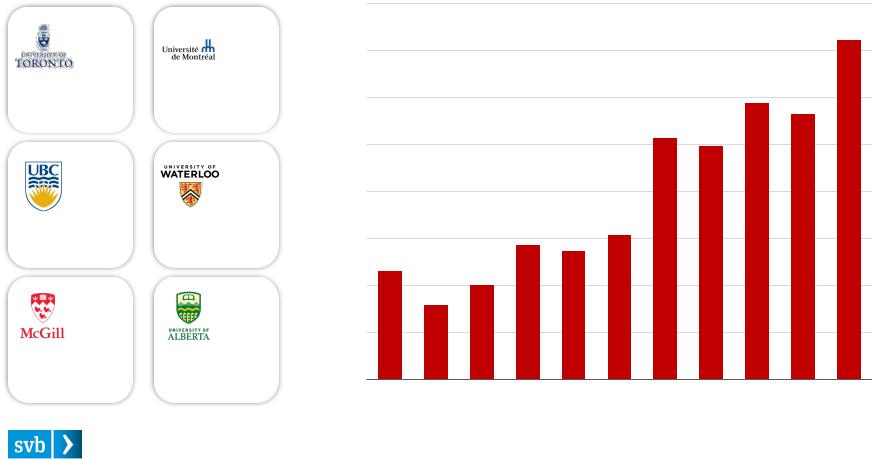
A Steady Climb: Building Venture in Canada
On the backs of strong universities and consistent government support for R&D, venture investment has thrived in Canada — rising nearly fourfold this decade. Programs remain aimed at continued flows of both capital and talent into the burgeoning ecosystem.
Top Canadian Universities by World Rank in Computer Science1
#18 |
#34 |
Established: 1827 |
Established: 1878 |
Location: Toronto, ON |
Location: Montreal, QC |
Enrollment: 72,202 |
Enrollment: 37,311 |
#35 |
#41 |
Established: 1915 |
Established: 1957 |
Location: Vancouver, BC |
Location: Waterloo, ON |
Enrollment: 53,566 |
Enrollment: 32,395 |
#79 |
#98 |
Established: 1821 |
Established: 1908 |
Location: Montreal, QC |
Location: Edmonton, AB |
Enrollment: 31,060 |
Enrollment: 31,844 |
Venture Capital Investment in Canada
$4.0B
$3.0B
$2.0B
$1.0B
$0.0B
2008 |
2010 |
2012 |
2014 |
2016 |
2018 |
Notes: 1) Universities in Top 100 of Times Higher Education World Rankings for Computer Science in 2019. |
State of the Markets: Second Quarter 2019 |
25 |
Source: Times Higher Education, university websites, PitchBook and SVB analysis. All data in CAD. |
vk.com/id446425943
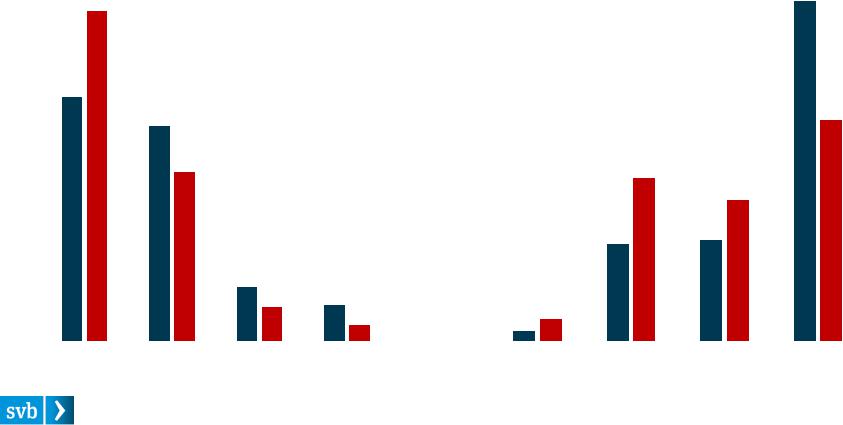
Startup to Scale-Up: Canadians Face “Valley of Death”
Investment continues to climb for startups, but funding gaps remain. Early stage activity remains abundant: Almost two-thirds of deals were for less than $1M. While their US counterparts raised more than 60% of capital through $25M+ growth rounds, Canadian firms raised just 40% since 2016.
Tech Venture Deal Count (% of Total): 2016–2018 |
Tech Venture Capital Inv. (% of Total): 2016—2018 |
|||||||||||||||
70% |
|
|
|
|
|
|
|
|
70% |
|
|
|
|
|
|
|
|
|
US |
|
CAN |
|
|
|
|
|
|||||||
|
|
|
|
|
|
|
|
US |
|
CAN |
|
|
||||
60% |
|
|
|
|
|
|
60% |
|
|
|
|
|
||||
|
|
|
|
|
|
|
|
|
|
|
||||||
|
|
|
|
|
|
|
|
|
|
|
||||||
|
|
|
|
|
|
|
|
|
|
|
|
|
|
|
||
|
|
|
|
|
|
|
|
|
|
|
|
|
|
|
||
50% |
|
|
|
|
|
|
|
|
50% |
|
|
|
|
|
|
|
|
|
|
|
|
|
|
|
|
|
|
|
|
|
|
||
40% |
|
|
|
|
|
|
|
|
40% |
|
|
|
|
|
|
|
|
|
|
|
|
|
|
|
|
|
|
|
|
|
|
||
30% |
|
|
|
|
|
|
|
|
30% |
|
|
|
|
|
|
|
|
|
|
|
|
|
|
|
|
|
|
|
|
|
|
||
20% |
|
|
|
|
|
|
|
|
20% |
|
|
|
|
|
|
|
|
|
|
|
|
|
|
|
|
|
|
|
|
|
|
||
10% |
|
|
|
|
|
|
|
|
10% |
|
|
|
|
|
|
|
|
|
|
|
|
|
|
|
|
|
|
|
|
|
|
||
0% |
|
|
|
|
|
|
|
|
0% |
|
|
|
|
|
|
|
|
$0—$1M |
$1M—$10M $10M—$25M |
$25M+ |
|
$0—$1M |
$1M—$10M $10M—$25M |
$25M+ |
|||||||||
|
|
|
|
|||||||||||||
Source: PitchBook and SVB analysis. All data in CAD. |
State of the Markets: Second Quarter 2019 |
26 |
vk.com/id446425943
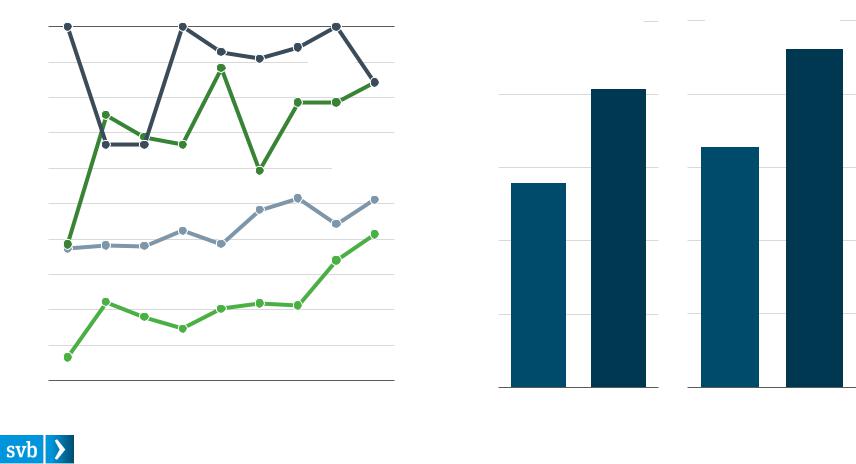
As Foreign Capital Arrives, Toronto Cements Its Place
Overseas capital continues to fill the gaps. Growth rounds, in particular, have relied on foreign participation (80%+ of which is from the US). Toronto firms led the charge, receiving eight of the 13 mega-rounds. In fact, more than 40% of all Canadian VC dollars now flow to the city.
Canada Tech Venture: Participation by Foreign Investors by Round Size: 2010—2018
100%
|
$25M+ |
80% |
|
|
$10–25M |
60% |
$1–10M |
|
|
40% |
|
20%
$0–1M Rounds
0%
2010 |
2012 |
2014 |
2016 |
2018 |
Toronto’s Share of Canada Tech Venture Capital
|
|
|
50% |
|
Invested Capital: |
|
Total Investment |
|
|
||
|
|
40% |
41% |
|
|
30% |
|
28% |
|
20% |
|
10% |
|
0% |
|
2010–2014 |
2015–2018 |
Invested Capital:
First Financings
|
46% |
33% |
|
2010–2014 |
2015–2018 |
Source: PitchBook and SVB analysis. All data in CAD. |
State of the Markets: Second Quarter 2019 |
27 |
vk.com/id446425943
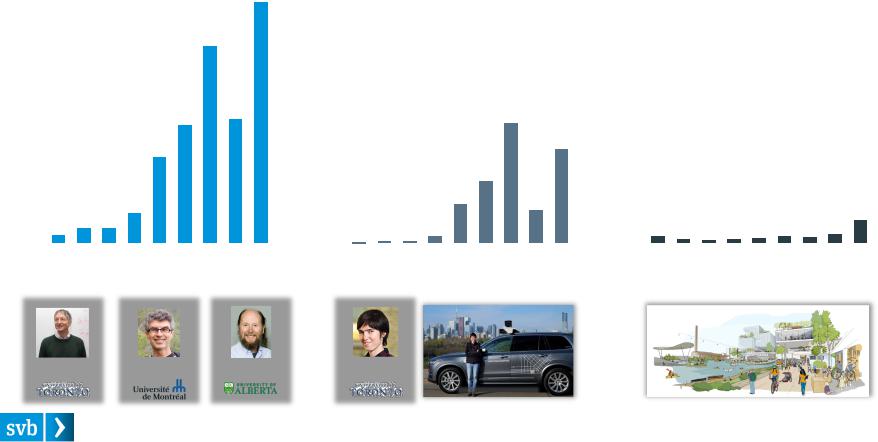
AI: An Opportunity for Canada to Lead the World
The now worldwide phenomenon started in large part in the halls of Canadian universities. As artificial intelligence provides the platform of tomorrow, new industries are opening where Canadian startups could find an edge and achieve the global-scale exits to drive the next chapter of innovation.
North American Venture Investment: 2010–2018 |
|
|
|
|
|
|
|
|
|
|
|
|
|
|
|
|
|
|
|
|
|||||||||||||||||
AI/Machine Learning |
|
|
|
|
|
$20B |
Autonomous Vehicles |
|
|
|
|
|
|
|
|
|
Smart Cities & Micro-Mobility |
|
|
|
|||||||||||||||||
$20B |
|
|
|
|
|
|
|
|
|
|
$20B |
|
|
|
|
|
|
|
|
|
|
|
|
|
|
$20B |
|
|
|
|
|
|
|
||||
Today |
|
|
|
|
|
|
|
|
|
|
|
|
|
Tomorrow |
|
|
|
|
|
|
|
|
|
|
|
|
Future |
|
|
|
|
|
|||||
|
|
|
|
|
|
|
|
|
|
|
|
|
|
|
|
|
|
|
|
|
|
|
|
|
|
|
|
|
|
|
|
|
|
|
|
|
|
$15B |
|
|
|
|
|
|
|
|
|
|
|
|
|
|
$15B |
|
|
|
|
|
|
|
|
|
|
|
|
|
|
$15B |
|
|
|
|
|
|
|
|
|
|
|
|
|
|
|
|
|
|
|
|
|
|
|
|
|
|
|
|
|
|
|
|
|
|
|
|
|
|
|
|
|
|
|||
|
|
|
|
|
|
|
|
|
|
|
|
|
|
|
|
|
|
|
|
|
|
|
|
|
|
|
|
|
|
|
|
|
|
|
|
|
|
$10B |
|
|
|
|
|
|
|
|
|
|
|
|
|
|
$10B |
|
|
|
|
|
|
|
|
|
|
|
|
|
|
$10B |
|
|
|
|
|
|
|
|
|
|
|
|
|
|
|
|
|
|
|
|
|
|
|
|
|
|
|
|
|
|
|
$8B |
|
|
|
|
|
|
|
||||||
|
|
|
|
|
|
|
|
|
|
|
|
|
|
|
|
|
|
|
|
|
|
|
|
|
|
|
|
|
|
|
|
|
|
||||
|
|
|
|
|
|
|
|
|
|
|
|
|
|
|
|
|
|
|
|
|
|
|
|
|
|
|
|
|
|
|
|
|
|
|
|
|
|
$5B |
|
|
|
|
|
|
|
|
|
|
|
|
|
|
$5B |
|
|
|
|
|
|
|
|
|
|
|
|
|
|
$5B |
|
|
|
|
|
|
|
|
|
|
|
|
|
|
|
|
|
|
|
|
|
|
|
|
|
|
|
|
|
|
|
|
|
|
|
|
|
|
|
|
|
|
|||
|
|
|
|
|
|
|
|
|
|
|
|
|
|
|
|
|
|
|
|
|
|
|
|
|
|
|
|
|
|
|
|
|
|
|
|
|
|
$0B |
|
|
|
|
|
|
|
|
|
|
|
|
|
|
$0B |
|
|
|
|
|
|
|
|
|
|
|
|
|
|
$0B |
|
|
|
|
|
$2B |
|
|
|
|
|
|
|
|
|
|
|
|
|
|
|
|
|
|
|
|
|
|
|
|
|
|
|
|
|
|
|
|
|
|
|||||
|
|
|
|
|
|
|
|
|
|
|
|
|
|
|
|
|
|
|
|
|
|
|
|
|
|
|
|
|
|
|
|
|
|
|
|||
|
|
|
|
|
|
|
|
|
|
|
|
|
|
|
|
|
|
|
|
|
|
|
|
|
|
|
|
|
|
|
|
|
|
|
|||
2010 |
2012 |
2014 |
2016 |
|
2018 |
2010 |
2012 |
2014 |
2016 |
2018 |
2010 |
2012 |
2014 |
2016 |
2018 |
||||||||||||||||||||||
|
World-Leading AI Researchers |
|
|
|
|
U of Toronto + Uber: Self-Driving Car Group |
|
Toronto + Alphabet: Sidewalk Labs |
|||||||||||||||||||||||||||||
Geoffrey Hinton |
|
Yoshua Bengio |
|
Richard Sutton |
|
Raquel Urtasun |
|
|
|
|
|
|
|
Source: PitchBook, company and university websites and SVB analysis. All data in CAD. |
State of the Markets: Second Quarter 2019 |
28 |