

ppl_04_e2
.pdfID: 3658
Customer: Oleg Ostapenko E-mail: ostapenko2002@yahoo.com
Customer: Oleg Ostapenko E-mail: ostapenko2002@yahoo.comC H A P T ER 1 : T H E A T
In 1964, the International Civil Aviation Organisation, ICAO, defined the properties of an average, or “standard” atmosphere. This is known as the ICAO Standard Atmosphere (ISA). This model of the ISA is limited to a height of 32 km, or about 105 000 feet above mean sea-level; however, this height is well above the maximum ceiling attainable by any current conventional aircraft.
ISA is one of several types of standard atmosphere devised over the years. However, it is the most widely recognised model and the only one of relevance to light aircraft pilots. The variations of temperature, pressure and density within the ISA are depicted in Figure 1.6.
Figure 1.6. Graph showing the ICAO Standard Atmosphere.
ISA assumes that, at mean sea-level, air temperature is 15°C, air pressure is 1013.25 hectopascals (millibars) and air density is 1.225 kg/m³.
From mean sea-level to 11 km, or 36 090 feet, the temperature decreases by 0.65°C per 100 m, or 1.98°C per 1 000 feet. This is known as the environmental lapse rate. Above 11 km, the average height of the Tropopause, temperature no longer falls with height, until beyond the upper limit of the Stratosphere.
Within the Stratosphere, above 11 km and up to 20 km, the temperature remains constant at -56.5°C. Above 20 km and up to 32 km, however, the temperature increases very slowly at a rate of 0.3°C per 1 000 feet or 0.1°C per 100 m.
De v i a t i o n s o f A c t u a l A t m o s p h e r i c
Since all aircraft instruments are calibrated in accordance with ISA, it is essential to know by how much actual atmospheric conditions, on a given day, differ from the ISA model.
Comparing ISA with the actual atmospheric conditions helps quantify errors in flight instrument readings, and, thereby permits those errors to be corrected.
An ISA deviation example is depicted in Figure 1.7. An airfield is 1 000 feet above sea-level. In the ISA, the mean sea-level temperature of the atmosphere is 15°C, which then falls by 1.98°C for every 1 000 feet increase in altitude, up to 11 km. (In examinations, for simplicity of calculation, an ISA environmental lapse rate of 2°C per 1 000 feet is assumed).
ISA assumes
that, at mean sea-level, air
temperature is
15°C, air pressure is 1013.25 hectopascals (millibars), and air density is 1.225 kg/m³.
From mean
sea-level to 11 km or
36 090 feet,
the temperature decreases by 1.98°C per 1 000 feet or 0.65°C per 100 m. This is
known as the e n v i r o n m l a p s e. Abover a 11t ekm, the
Tropopause, the temperature
C o n d i t i o n s remains constant in the lower
part of the Stratosphere, up to an altitude of 20 km.
7

Order: 6026
Customer: Oleg Ostapenko E-mail: ostapenko2002@yahoo.com
Customer: Oleg Ostapenko E-mail: ostapenko2002@yahoo.com
C H A P T ER 1 : T H E A T M O S P H ER E
Therefore, the temperature at 1 000 feet should be approximately 13°C. However, in the example depicted in Figure 1.7, the actual temperature at 1 000 feet is 20°C, which is much higher than the ISA temperature. A simple calculation reveals that the real atmosphere is 7°C warmer than ISA; so the temperature at 1 000 feet is described as ISA +7°C.
For ease of calculation, an
ISA lapse rate of 2°C per
1 000 feet , rather than 1.98°C per 1 000 feet, is generally assumed.
Figure 1.7 At 1 000 feet AMSL, the ISA temperature is 13°C, but, here, the actual temperature is 20°C. The ISA deviation is written as IS A + .7 ° C
A further ISA deviation example is illustrated in Figure 1.8. In this example, the actual temperature at 10 000 feet is -15°C. What, then, is the ISA deviation?
Figure 1.8 At 10 000 feet AMSL, the ISA temperature is -5ºC. But the actual temperature is -15ºC. ISA deviation is, therefore, IS A -. 1 0 ° C
In the ISA, temperature falls by approximately 2°C per 1 000 feet and, so, temperature should decrease from sea-level to 10 000 feet by 20°C. The ISA temperature of the air at sea-level is 15°C, and so 15°C minus 20°C would give an ISA temperature at 10 000 feet of -5°C. If the actual temperature, however, is -15°C, a simple calculation shows that the real atmosphere is 10°C colder than ISA; therefore, the deviation is given as ISA -10°C.
8

ID: 3658
Customer: Oleg Ostapenko E-mail: ostapenko2002@yahoo.com
Customer: Oleg Ostapenko E-mail: ostapenko2002@yahoo.com
C H A P T ER 1 : A T M O S P H ER
R e p r e s e n t a t i v e P P L - k n o w l e d g e o f T h e A t m
t y p e q u e s t i o n s t o t o s p h e r e .
1.What is the value of the environmental temperature lapse rate assumed by the ICAO Standard Atmosphere?
a.1°C / 1 000 feet
b.1.5°C / 1 000 feet
c.3°C / 1 000 feet
d.1.98°C / 1 000 feet
2.In which atmospheric layer is most of the water vapour contained?
a.Tropopause
b.Stratosphere
c.Troposphere
d.Stratopause
3.On a given day, the air temperature at 2000 feet above mean sea-level is forecast to be 5°C. Compared to the ICAO Standard Atmosphere this is:
a.ISA -6
b.ISA +6
c.ISA +5
d.ISA -5
4.Below the Tropopause, the ICAO Standard Atmosphere assumes:
a.A mean sea-level pressure of 1013.25 hPa and a mean sea-level temperature of 15°C, decreasing at a rate of 3°C per 1 000 feet until it reaches -65.6°C at 36 090 feet
b.A mean sea-level pressure of 1013.25 hPA and a sea-level temperature of 15°C, decreasing at a rate of 1.98°C per 1 000 feet until it reaches absolute zero
c.A mean sea-level pressure of 1013.25 hPA and a sea-level temperature of 15°C, decreasing by 1.98°C per 1 000 feet up to 36 090 feet
d.A mean sea-level pressure of 1225 gm/m³ a mean sea-level temperature of 15°C, decreasing at a rate of 1.5°C per 1 000 feet up to 36 090 feet
5.Which of the following statements gives the most correct and complete description of ISA?
a.The mean sea-level (MSL) pressure is 1013.25 hPa and the temperature is +15°C
b.The MSL pressure is 1013.25 hPa and the temperature is +15°C with a lapse rate of 1.98°C per 1000 feet
c.The MSL pressure is 1013.25 mb and the temperature is +15°C with a lapse rate of 1.98°C per 1000 feet up to 36,090 feet above which there is frequently an inversion
d.The MSL pressure is 1013.25 hPa and the temperature is +15°C with a lapse rate of 1.98°C per 1000 feet up to 36,090 feet
9

Order: 6026
Customer: Oleg Ostapenko E-mail: ostapenko2002@yahoo.com
Customer: Oleg Ostapenko E-mail: ostapenko2002@yahoo.com
C H A P T ER 1 : A T M O S P H ER E Q U ES T IO NS
6.Which of the following options gives the most accurate description of the constituent gases of the Earth’s atmosphere? (Ignore the variable concentration of water vapour in the atmosphere.)
a.Oxygen 21%, Nitrogen 78%, other gases 1%
b.Oxygen 21%, Hydrogen 78%, other gases 1%
c.Nitrogen 78%, Argon 21%, Oxygen 1%
d.Nitrogen 78%, Oxygen 21%, Hydrogen 1%
7.The layer of the atmosphere closest to the Earth’s surface where the majority of the weather is found is called the:
a.Tropopause
b.Troposphere
c.Stratosphere
d.Mesosphere
Question |
1 |
2 |
3 |
4 |
5 |
6 |
7 |
|
|
|
|
|
|
|
|
Answer |
|
|
|
|
|
|
|
T h e a n s w e r s t o t h e s e q u e s t i o n s c a n b e
10

Customer: Oleg Ostapenko E-mail: ostapenko2002@yahoo.com
CHAPTER 2
ATMOSPHERIC PRESSURE
11

Order: 6026
Customer: Oleg Ostapenko E-mail: ostapenko2002@yahoo.com
Customer: Oleg Ostapenko E-mail: ostapenko2002@yahoo.com
C H A P T ER 2 : A T M O S P H ER IC P R ES S U R E
12

ID: 3658
Customer: Oleg Ostapenko E-mail: ostapenko2002@yahoo.com
Customer: Oleg Ostapenko E-mail: ostapenko2002@yahoo.com
C H A P T ER 2 : A T M O S P H ER
INTRODUCTION. |
|
|
|
|
Understanding the variations in atmospheric pressure across the Earth’s surface is |
|
|
|
|
Atmospheric |
||||
fundamental to an understanding of the weather, itself. But what is the fundamental |
||||
pressure is |
|
|
||
|
||||
cause of atmospheric pressure? |
caused by the |
|||
Expressed simply, atmospheric pressure, which acts on any object immersed in |
weight of the |
|||
overlying air, and acts in all |
||||
the atmosphere, is caused by the weight of air above that object. Atmospheric |
directions. |
|||
pressure acts in all directions. |
|
|
|
|
|
|
|
||
The forces generated by horizontal pressure differences across the Earth’s surface |
Variations in |
|||
give rise to both horizontal, and vertical air movement, creating winds and clouds. |
||||
atmospheric |
|
|
||
|
|
|
||
The variation of atmospheric pressure with altitude allows us to measure the vertical |
pressure, both |
|||
vertical and |
||||
separation of an aircraft from the Earth’s surface, using an instrument called an |
||||
horizontal, are fundamental |
||||
altimeter. |
to the formation of weather |
|||
patterns.
T h e F u n d a m e n t a l C a u s e o f A t m o s p h e r i c P r e s s
The air which constitutes our atmosphere is made up of billions of molecules. The atmosphere, therefore, has mass, and, as a result of the Earth’s gravitational field pulling the mass of the atmosphere towards the centre of the Earth, air possesses weight.
The pressure of the atmosphere at any point is caused by the weight of the column of air overlying that point. Atmospheric pressure (sometimes, in other branches of aeronautics, called static pressure) acts in all directions on any object contained within the atmosphere.
Most of the mass of the atmosphere is contained in its lower layers near the Earth’s |
Air has mass. |
||
surface. This is because of the action of the Earth’s gravitational field on the air |
Air exerts |
|
|
|
|||
molecules (the force of gravity being greater near the surface), combined with the fact |
pressure |
||
that air is compressible. The air in the lower layers of the atmosphere is compressed |
because of |
||
by the weight of the air above it. Consequently, air is denser, and atmospheric |
gravity and the compressibility |
||
pressure is greater, at the Earth’s surface than at altitude. |
of air. Most of the total |
||
|
mass of the atmosphere is |
||
Figure 2.1 represents the relative distribution of molecules within the atmosphere, |
concentrated in its lower |
||
with more molecules in the lower part of the atmosphere than at altitude. The red |
layers. |
||
|
|
|
|
arrows within the column of air illustrate that the atmosphere exerts its pressure |
|
|
|
equally, in all directions. |
|
|
|
Atmospheric
pressure (and density)
reduces with increasing altitude.
Figure 2.1 Atmospheric Pressure is the force or weight exerted on any object by the column of air above that object. Atmospheric (or static) pressure acts in all directions and reduces with increasing altitude.
13

Order: 6026
Customer: Oleg Ostapenko E-mail: ostapenko2002@yahoo.com
Customer: Oleg Ostapenko E-mail: ostapenko2002@yahoo.com
C H A P T ER 2 : A T M O S P H ER IC P R ES S U R E
UNITS OF ATMOSPHERIC PRESSURE.
In the United Kingdom, the millibar is the standard unit
of atmospheric pressure. In Europe, it is the hectopascal. In the USA, it is inches of Mercury.
In meteorology, the units commonly used to represent atmospheric pressure are inches of mercury, and millibars or hectopascals. The ICAO Standard Atmosphere (ISA) unit of pressure is the hectopascal, but, currently, the millibar is still used in the United Kingdom. The millibar and the hectopascal are identical in value. For instance, ISA sea-level pressure can be expressed as 1013.25 millibars or 1013.25 hectopascals.
In the United States of America, atmospheric pressure is expressed in inches of Mercury. In inches of Mercury, ISA sea-level pressure is 29.92 inches Hg.
The instrument used to measure atmospheric pressure is the barometer (from Greek “baros” meaning weight and “metron” meaning measure). A barometer can be one of two distinct types: the aneroid barometer or the mercury barometer.
T h e M e r c u r y B a r o m e t e r .
The mercury barometer consists of a glass tube, sealed at one end, containing Mercury, with the open end immersed in an open mercury reservoir, in the form of a dish (Figure 2.2).
Figure 2.2 A simple Mercury Barometer. In ISA sea-level conditions, atmospheric pressure will support a column of Mercury 29.92 inches in height.
The weight of the column of Mercury in the glass tube is balanced by atmospheric pressure exerted on the Mercury in the dish. In ISA sea-level conditions, the height of the Mercury column would be 29.92 inches. Changes in atmospheric pressure will either depress the Mercury in the open reservoir, forcing more of the Mercury up into the tube, or will allow the level of Mercury in the reservoir to rise, permitting the height of the Mercury in the glass tube to fall. The space above the column of Mercury in the tube is almost a vacuum.
14
ID: 3658
Customer: Oleg Ostapenko E-mail: ostapenko2002@yahoo.com
Customer: Oleg Ostapenko E-mail: ostapenko2002@yahoo.com
C H A P T ER 2 : A T M O S P H ER
T h e A n e r o i d B a r o m e
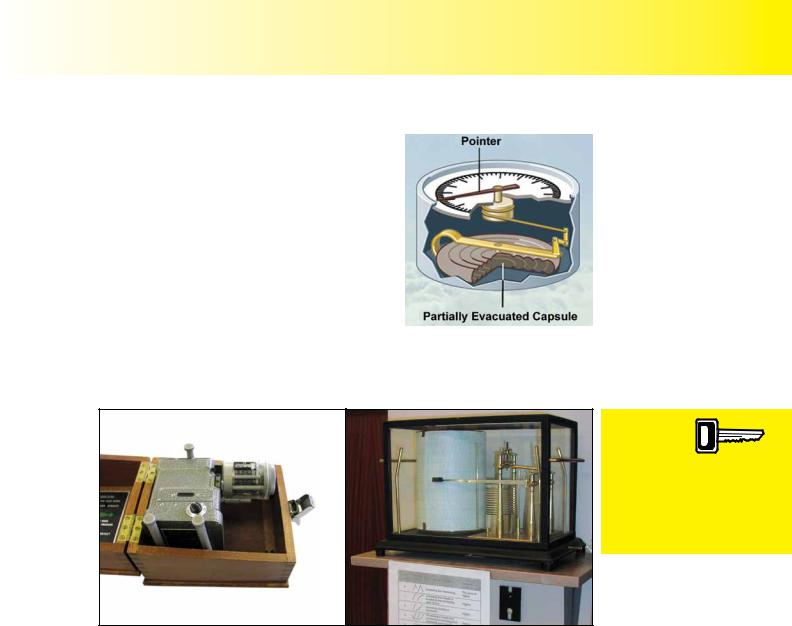
The aneroid barometer does not contain mercury or liquid, but measures the effect of air pressure on a partially evacuated metal capsule. (See Figure 2.3.)
The aneroid barometer (from Greek “an” meaning no or none, and “aeras”, meaning air) is less accurate overall than the mercury barometer, but is more sensitive to small changes in air pressure. Changes in air pressure cause the metal capsule to expand or contract; a mechanism connected to the capsule causes a needle or pointer to move around a calibrated scale. An aneroid barometer
may be calibrated in inches of mercury or in millibars. However, an aneroid barometer can also be calibrated in feet or metres to indicate height above the Earth’s surface; the instrument is then known as an altimeter.
Atmospheric
pressure may be measured
by a mercury barometer or an aneroid
barometer. The barograph is a particular kind of aneroid barometer which records pressure change against time.
Figure 2.4 A typical aneroid barometer used |
Figure 2.5 A barograph, used to record the |
by Air Traffic Service Units to measure |
variation of air pressure with time, on a |
atmospheric pressure at an aerodrome. |
cylindrical pressure chart. |
An example of a portable aneroid barometer used widely by Air Traffic Service Units to measure pressure at the Earth’s surface is shown in Figure 2.4.
A barograph is an aneroid barometer which records pressure against time on a cylindrical chart. The barograph is usually driven by clockwork. (See Figure 2.5.)
PRESSURE VARIATIONS AT THE EARTH’S SURFACE.
Horizontal variations in surface pressure arise because of the differences in weight of different columns of air overlying different locations on the Earth’s surface.
Comparatively speaking, if there is a greater mass of air above a given area on the Earth’s surface, then the atmosphere will be exerting more pressure on that area. If, in another location, there is less air above the Earth’s surface, the atmosphere will be exerting less pressure on the surface. Therefore, high or low surface pressures are a direct consequence of the weight of the mass of the air overlying a given locality, as depicted in Figure 2.6.
15

Order: 6026
Customer: Oleg Ostapenko E-mail: ostapenko2002@yahoo.com
Customer: Oleg Ostapenko E-mail: ostapenko2002@yahoo.com
C H A P T ER 2 : A T M O S P H ER IC P R ES S U R E
Surface pressure is a
function of the weight of the
column of air above any given point on the Earth’s surface.
Figure 2.6 Surface pressure at a given location on the Earth depends on the weight of the air above that location.
The mechanisms which give rise to these differences in surface pressure are described below. Diagrammatic representations of variations in surface pressure allow us to identify areas of high and low pressure on the Earth’s surface. By mapping these pressure variations, it is possible to analyse and, therefore, predict the weather. Diagrams of variations in surface pressure are called surface pressure charts, or, sometimes, synoptic charts (from synopsis meaning a general view).
MEAN SEA-LEVEL SURFACE PRESSURE CHARTS.
Figure 2.7 shows a typical surface pressure chart. Its interpretation and main features will be explained in the following paragraphs.
Figure 2.7 A Mean Sea-Level Surface Pressure Chart.
The Earth’s surface is made up of plains, mountains, lakes and oceans, and, so, over the Earth’s surface, there are wide variations in the elevation of terrain. Consequently, in order to obtain an accurate surface pressure chart, surface pressure readings need to be made with respect to a common vertical datum.
Mean sea-level is the usual datum from which pressures are measured.
The chart at Figure 2.7 shows the actual horizontal variation in pressure on a given day (30 Sep 2005). The chart is made up of the individual observations taken at different reporting stations.
16