

Lectures_micro / Microeconomics_presentation_Chapter_3
.pdfchapter:
3
>> Supply and Demand
Krugman/Wells
Economics
©2009 Worth Publishers

WHAT YOU WILL LEARN IN THIS CHAPTER
What a competitive market is and how it is described by the supply and demand model
What the demand curve and supply curve are
The difference between movements along a curve and shifts of a curve
How the supply and demand curves determine a market’s equilibrium price and equilibrium quantity
In the case of a shortage or surplus, how price moves the market back to equilibrium


 Supply and Demand
A competitive market:
Many buyers and sellers Same good or service
The supply and demand model is a model of how a competitive market works.
Five key elements:
Demand curve
Supply curve
Demand and supply curve shifts
Market equilibrium
Changes in the market equilibrium


 Demand Schedule
A demand schedule
to buy at different prices.
Demand Schedule for Coffee Beans
Price of coffee |
Quantity of coffee |
beans (per |
beans demanded |
pound) |
(billions of pounds) |
$2.00
1.75
1.50
1.25
1.00
0.75
0.50

 Demand
Price of |
Restart |
and then open the file again |
red x still appears, you may have to delete the image and then insert it again. |
The image annot be displayed. Your computer may not have enough |
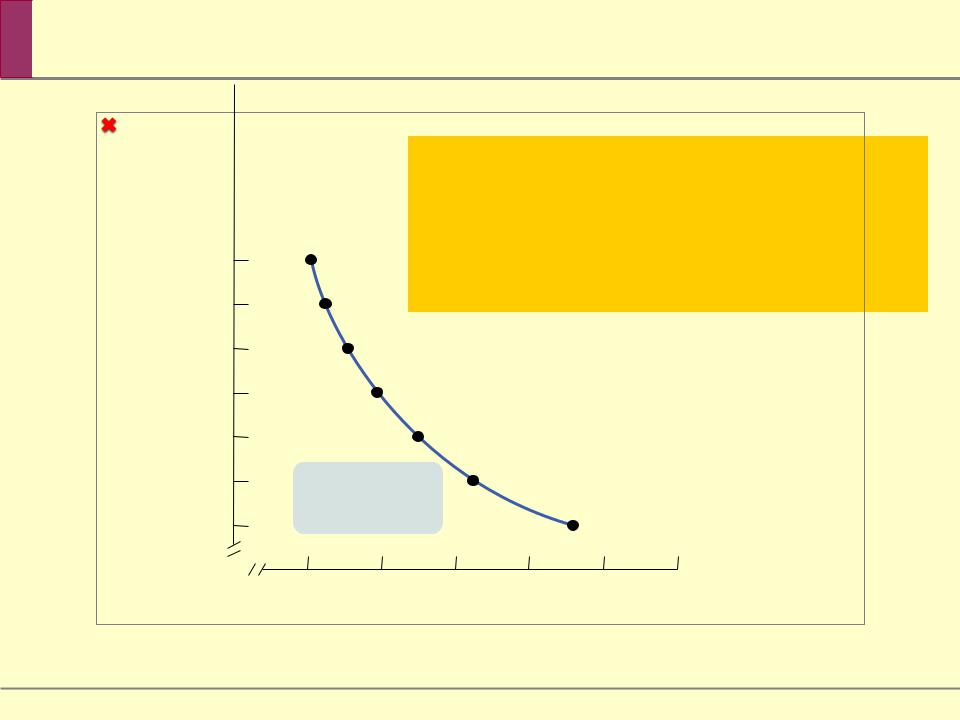
coffee bean (per gallon)
demand curve is the graphical
of the demand schedule; shows how much of a good or service
.
|
|
As price rises, |
Demand |
|
|
|
the quantity |
|
|
|
|
curve, D |
|
|
|
|
demanded falls |
|
|
|
|
|
|
|
0 |
|
15 |
17 |
|
|
13 |
|||
|
||||
|
|
Quantity |
coffee beans |
|
|
|
|
of pounds) |
|


 An Increase in
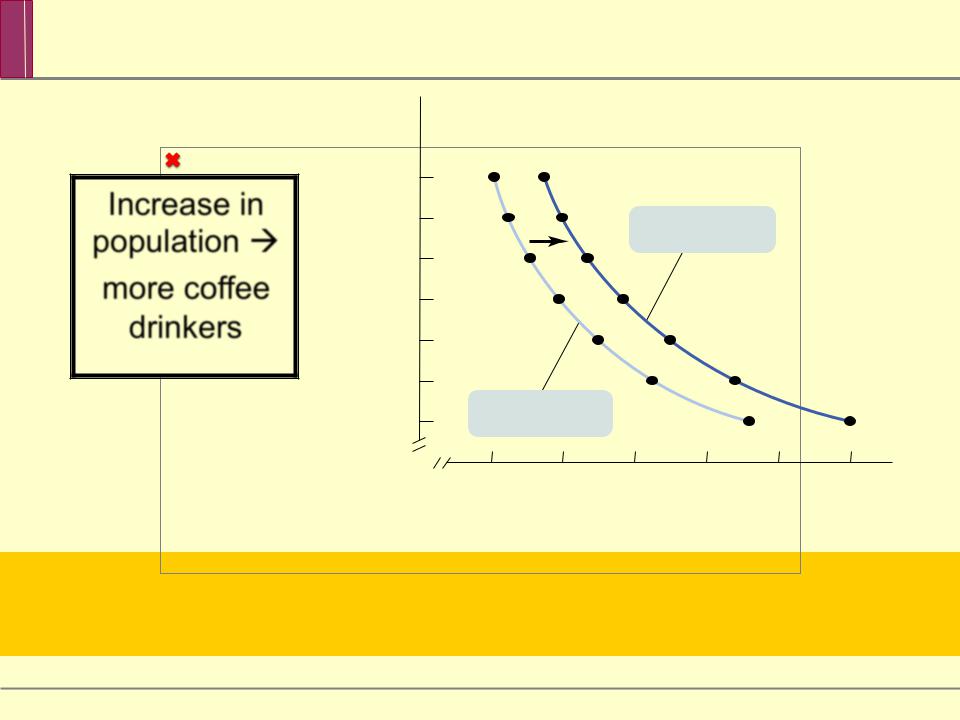
An increase in the population and other
This is represented by the two demand schedules - one showing demand in 2002, before the rise in population, the other showing demand in
2006, after the rise in population.
Demand Schedules for Coffee Beans
|
Quantity of coffee |
|
|
beans demanded |
|
Price of coffee |
(billions of pounds) |
|
|
|
|
beans (per |
in 2002 |
in 2006 |
pound) |
||
$2.00 1.75 1.50 1.25 1.00 0.75 0.50
Price of coffee beans (per gallon)
not have enough memory to open the image, or the image may then
Demand curve in 2006
|
|
|
Demand curve |
D |
D 2 |
|
|
|
in 2002 |
||
|
0 |
|
|
|
17 |
|
|
|
|
||
|
|
|
|
||
|
|
|
|
Quantity of coffee beans |
|
|
|
|
|
(billions of pounds) |
|
A |
is a |
|
at |
||
|
by the |
|
new |
||
|
demand |
|
|
||
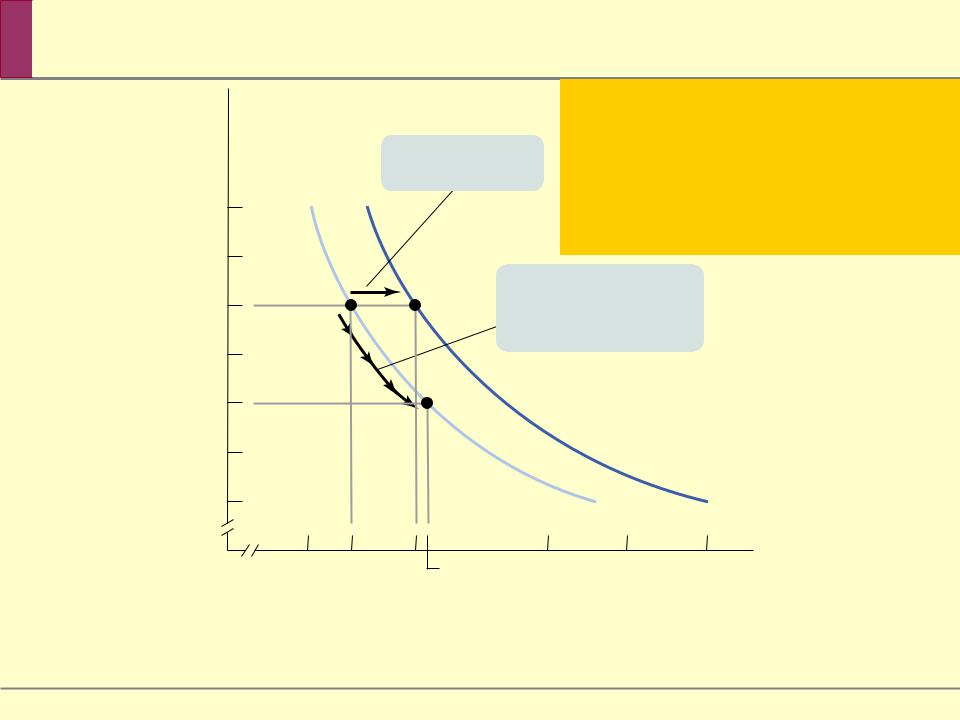

 Movement
A movement along the demand curve is a change in the quantity demanded of a good that is the result of a change in that good’s price.
… is thing along
curve
0.75
0.50
0 7


 Shifts
An “increase in demand” means a rightward shift of the demand curve: at any given price, consumers demand a larger quantity than before. (D1D2)
Decrease in demand


 What Causes a Demand Curve to Shift?
Changes in the Prices of Related Goods
Substitutes: Two goods are substitutes if a fall in the price of one of the goods makes consumers less willing to buy the other good.
Complements: Two goods are complements if a fall in the price of one good makes people more willing to buy
the other good.