

Lectures_micro / Microeconomics_presentation_Chapter_3
.pdf
 What Causes a Demand Curve to Shift?
Changes in Income
Normal Goods: When a rise in income increases the demand for a good - the normal case - we say that the good is a normal good.
Inferior Goods: When a rise in income decreases the demand for a good, it is an inferior good.
Changes in Tastes
Changes in Expectations
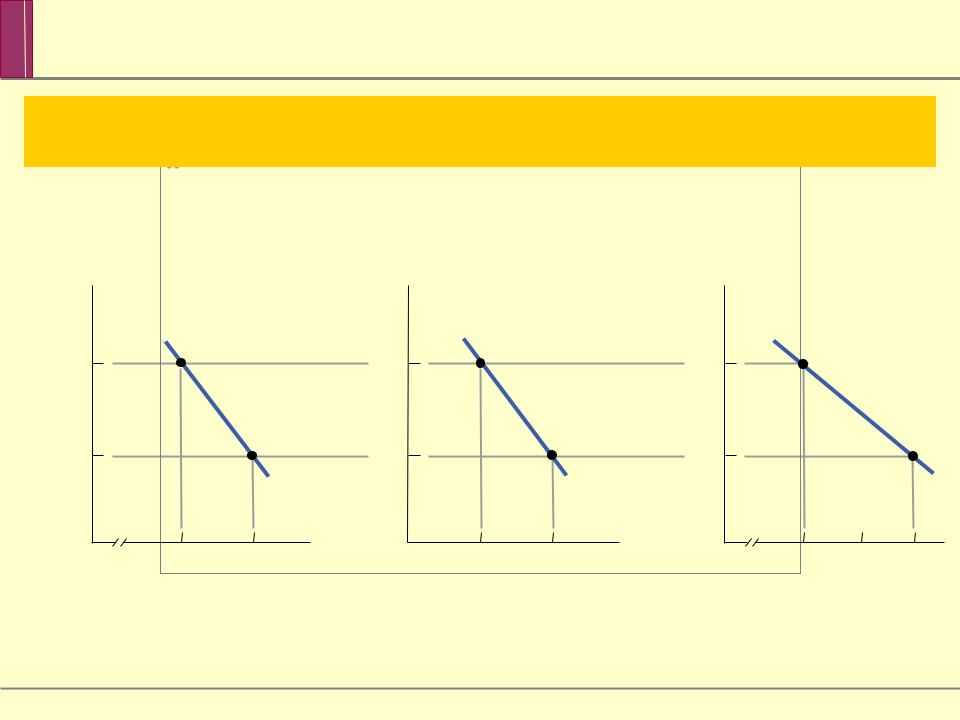
The market demand curve is the horizontal sum of
individual |
demand curves of all |
in that market. |
|
(a) |
(b) |
(c) |
|
Darla’s Individual |
Dino’s Individual |
Market Demand Curve |
|
Demand Curve |
Demand Curve |
|
|
Price of |
Price of |
Price of |
|
coffee |
coffee |
coffee |
|
beans (per |
beans (per |
beans (per |
|
pound) |
pound) |
pound) |
|
|
|
|
|
|
|
|
|
|
DMarket |
|
|
DDarla |
|
|
DDino |
|
|
|
|
0 |
20 |
30 |
0 |
10 |
20 |
0 |
30 |
40 |
50 |
|
|
Quantity of coffee |
|
|
Quantity of coffee |
|
|
Quantity of coffee |
|
|
|
beans (pounds) |
|
|
beans (pounds) |
|
|
beans (pounds) |
|


 Supply Schedule
A supply schedule shows how much of a good or service would be supplied at different prices.
Supply Schedule for Coffee Beans
|
|
Quantity of |
|
|
Price of |
coffee beans |
|
|
coffee beans |
supplied |
|
|
(per pound) |
(billions of |
|
|
|
pounds) |
|
|
$2.00 |
11.6 |
|
|
1.75 |
11.5 |
|
|
1.50 |
11.2 |
|
|
|
|
|
|
1.25 |
10.7 |
|
|
1.00 |
10.0 |
|
|
0.75 |
9.1 |
|
|
0.50 |
8.0 |
|


 Supply
Price of coffee
Supply
S
quantity rises.
0 |
13 |
of
A supply curve shows graphically how much of a good or service people are willing to sell at any


 An Increase in Supply
The entry of Vietnam into the coffee bean business generated an increase in supply—a rise in the quantity supplied at any given price.
This event is represented by the two supply schedules —one showing supply before Vietnam’s entry, the other showing supply after
Vietnam came in.
Supply Schedule for Coffee Beans
|
Price of |
Quantity of beans supplied |
|
|
|
coffee beans |
(billions of pounds) |
|
|
|
(per pound) |
Before entry |
After entry |
|
|
$2.00 |
11.6 |
13.9 |
|
|
1.75 |
11.5 |
13.8 |
|
|
1.50 |
11.2 |
13.4 |
|
|
1.25 |
10.7 |
12.8 |
|
|
1.00 |
10.0 |
12.0 |
|
|
0.75 |
9.1 |
10.9 |
|
|
0.50 |
8.0 |
9.6 |
|

Price of coffee beans (per pound)
2
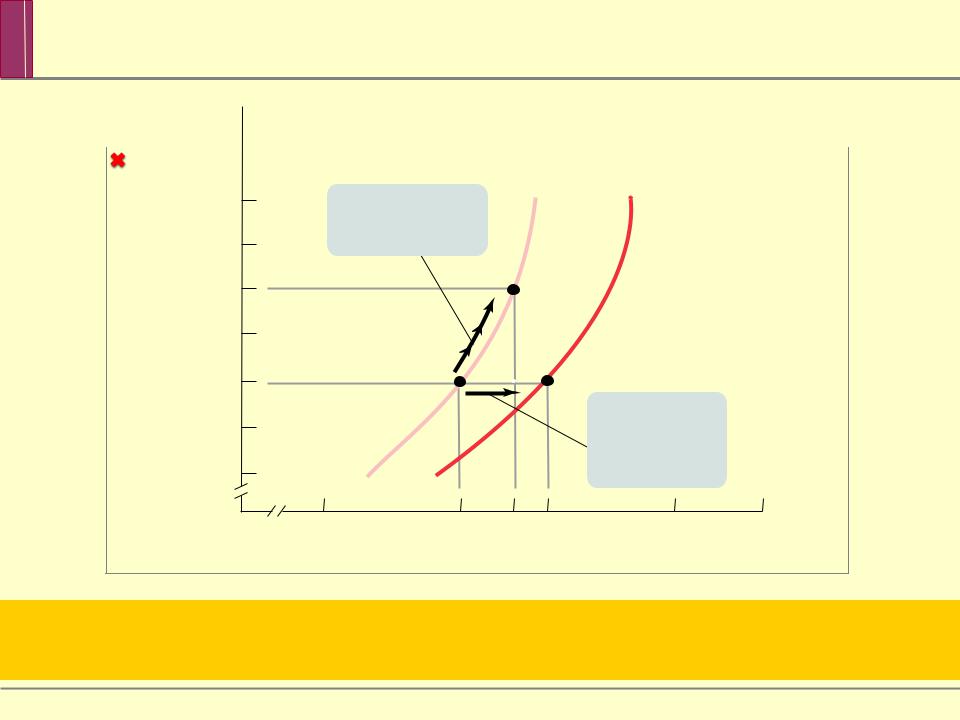
A movement along the supply curve…
… is not the same thing as a shift of the
supply curve
0 |
17 |
Quantity of coffee beans (billions of pounds)
A shift of the supply curve is a |
a good at any |
given price. |
|
Price of coffee |
|
|
beans (per |
|
|
pound) |
again. If |
then insert it again. |
The image cannot be isplayed. Your computer may not have enough memory to |
||
|
S1 |
|
|
A movement |
|
|
along the supply |
|
|
curve… |
|
|
B |
|
C
… is not the same thing as a shift of the
supply curve
0 |
17 |
Quantity of coffee beans (billions of pounds)
A movement along the |
supplied of a |
good that is the result of a |
good’s |

Any “decrease in supply” means a leftward shift of the supply curve: at any given price, there is a decrease in the quantity supplied. (S1 S3)
supply
Quantity


 What Causes a Supply Curve to Shift?
Changes in input prices
An input is a good that is used to produce another good.
Changes in the prices of related goods and services
Changes in technology Changes in expectations
Changes in the number of producers

The market supply curve is the |
sum of the |
|
supply curves of |
firms in |
market. |
|
(a) |
|
(b) |
|
(c) |
|
|
Price of |
Mr. Figueroa’s |
|
Mr. Bien Pho’s Individual |
Market Supply Curve |
|||
Individual Supply Curve |
Price of |
Supply Curve |
Price of |
|
|
|
|
coffee |
|
coffee |
|
|
|
|
|
beans (per |
|
|
coffee |
|
|
|
|
|
beans (per |
|
|
|
|
||
pound) |
|
|
beans (per |
|
|
|
|
|
pound) |
|
|
|
|
||
|
S |
SBien |
pound) |
|
|
SMarket |
|
|
|
|
|
||||
0 |
1 |
0 |
|
0 |
1 |
2 |
4 |
Quantity of coffee |
Quantity of coffee |
Quantity of coffee |
beans (pounds) |
beans (pounds) |
beans (pounds) |