

Lectures_micro / Microeconomics_presentation_Chapter_12
.pdfchapter:
12
>>Behind the Supply Curve: Inputs and Costs
Krugman/Wells
Economics
©2009 Worth Publishers

WHAT YOU WILL LEARN IN THIS CHAPTER
The importance of the firm’s production function, the relationship between quantity of inputs and quantity of output
Why production is often subject to diminishing returns to inputs
The various types of costs a firm faces and how they generate the firm’s marginal and average cost curves
Why a firm’s costs may differ in the short run versus the long run
How the firm’s technology of production can generate increasing returns to scale


 The Production Function
A production function is the relationship between the quantity of inputs a firm uses and the quantity of output it produces.
A fixed input is an input whose quantity is fixed for a period of time and cannot be varied.
A variable input is an input whose quantity the firm can vary at any time.


 Inputs and Output
The long run is the time period in which all inputs can be varied.
The short run is the time period in which at least one input is fixed.
The total product curve shows how the quantity of output depends on the quantity of the variable input, for a given quantity of the fixed input.
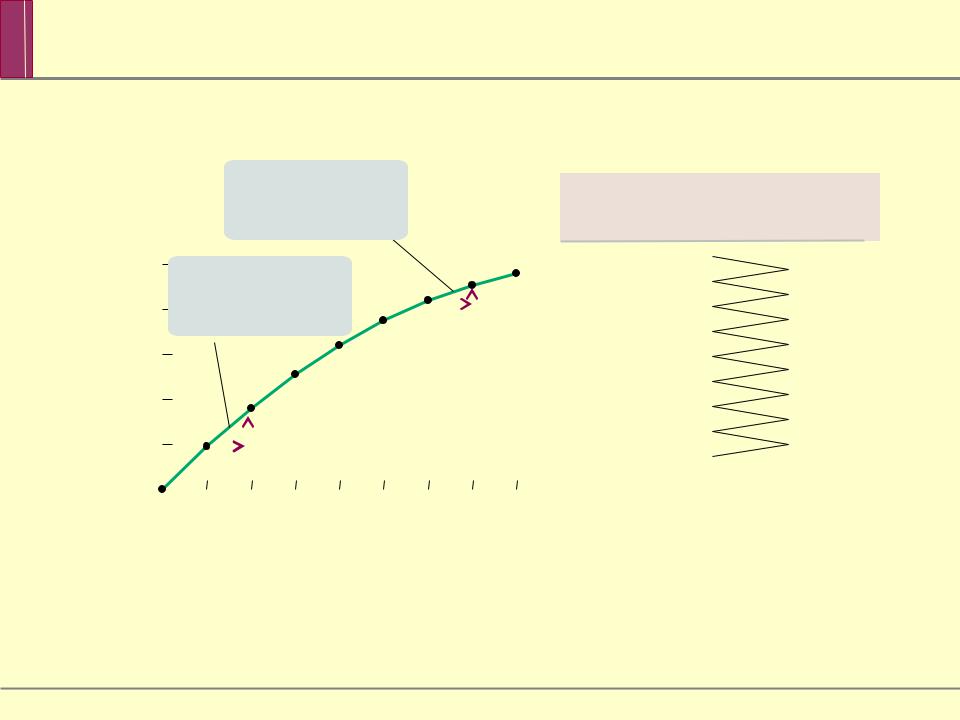
and TP
Quantity (bushels)
|
|
Adding a 7th worker |
|
|
||||||
|
|
|
|
|||||||
|
|
leads to an increase |
|
|
||||||
|
|
in output of only 7 |
|
|
||||||
|
|
bushels |
|
|
||||||
|
|
|
|
Total product, TP |
|
|
||||
|
Adding a 2nd worker |
|
|
|||||||
|
leads to an increase |
|
|
|||||||
|
in output of only 17 |
|
|
|
|
|
|
|||
|
|
|
|
|
|
|
||||
|
bushels |
|
|
|||||||
|
|
|
4 |
64 |
||||||
40 |
|
|
|
|
|
|
|
|
|
9 |
|
|
|
|
|
|
|
|
|
|
|
|
|
|
|
|
|
|
|
|
|
|
|
|
|
|
|
|
|
|
|
|
|
|
|
|
|
|
|
|
|
|
|
|
|
|
|
|
|
|
|
|
|
|
|
0
labor (workers)


 Diminishing Returns to an Input
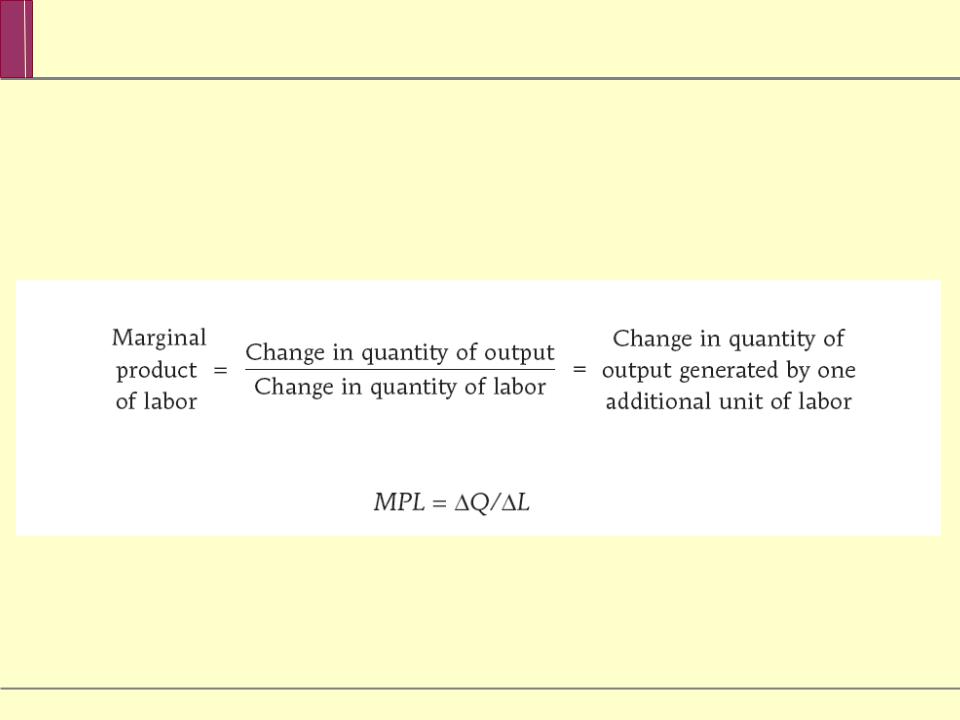
There are diminishing returns to an input when an increase in the quantity of that input, holding the levels of all other inputs fixed, leads to a decline in the marginal product of that input.


 Marginal
Marginal product of labor (bushels per
There are diminishing returns to labor.
MPL
0 |
1 |
2 |
3 |
7 |
8 |
(workers)
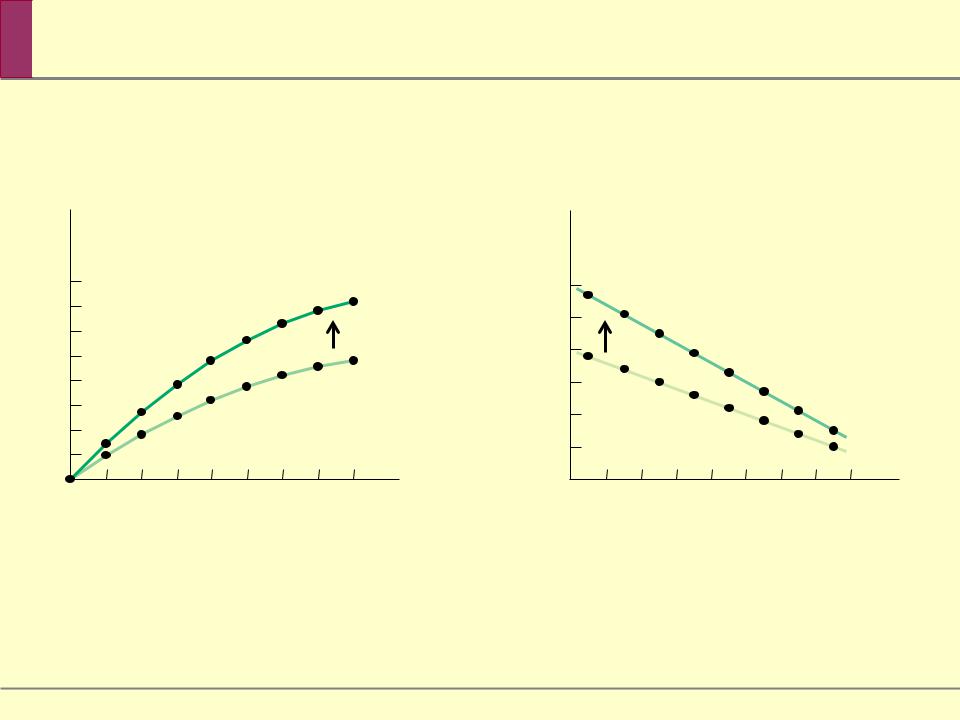

 Total Product, Marginal Product, and the Fixed Input
|
Product |
of |
Marginal product of |
wheat |
labor |
(bushels) |
(bushels per worker) |
|
TP20 |
|
TP10 |
0 |
0 |
|
Quantity of labor (workers) |
|
|
Product |
|
|
||
|
|
|
|
|
|
MPL20 |
|
|
|
|
|
|
MPL10 |
2 |
3 |
4 |
5 |
6 |
7 |
8 |
|
|
|
Quantity of labor (workers) |
|||


 From the Production Function to Cost Curves
A fixed cost is a cost that does not depend on the quantity of output produced. It is the cost of the fixed input.
A variable cost is a cost that depends on the quantity of output produced. It is the cost of the variable input.