

Lectures_micro / Microeconomics_presentation_Chapter_11
.pdfchapter:
11
>>Consumer Preferences and Consumer Choice
Krugman/Wells
Economics
©2009 Worth Publishers

WHAT YOU WILL LEARN IN THIS CHAPTER
Why economists use indifference curves to illustrate a person’s preferences
The importance of the marginal rate of substitution, the rate at which a consumer is just willing to substitute one good for another
An alternative way of finding a consumer’s optimal consumption bundle using indifference curves and the budget line
How the shape of indifference curves helps determine whether goods are substitutes or complements
An in-depth understanding of income and substitution effects


 Mapping the Utility Function
A utility function determines a consumer’s total utility given his or her consumption bundle.
Using indifference curves, which represent a consumer’s utility function, we will deepen our understanding of the trade-off involved when choosing the optimal consumption bundle and of how the optimal consumption bundle itself changes in response to changes in the prices of goods.
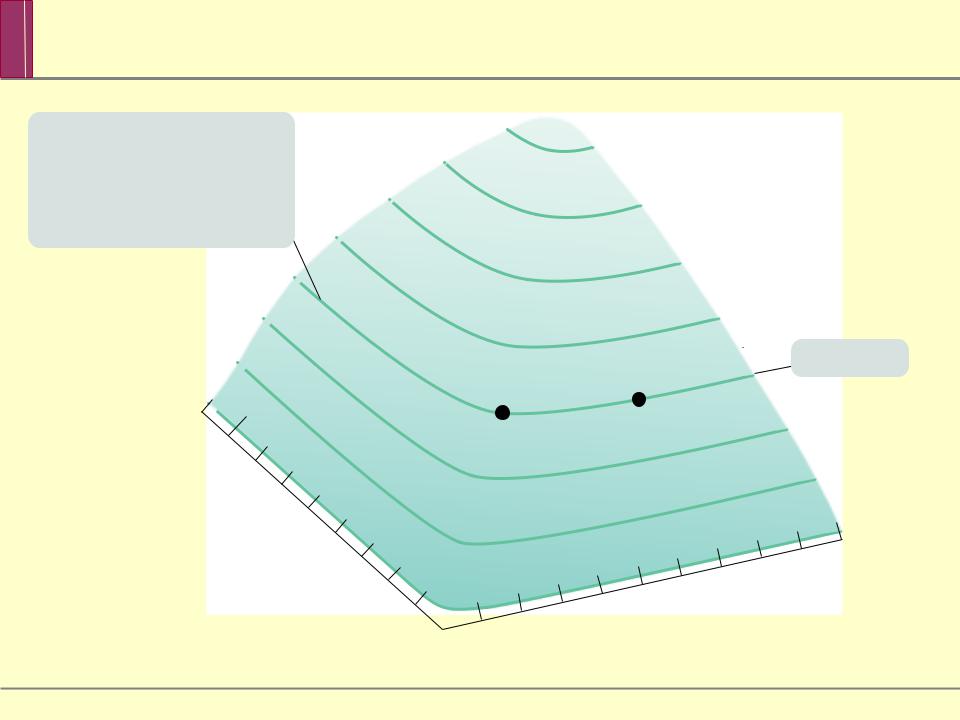
Function
All combinations of rooms and restaurant meals along this contour line yield 450
utils.
600
450 utils
Quantity of restaurants
40
30 |
|
|
|
6 |
7 |
8 |
20 |
|
|
5 |
|
||
|
4 |
|
|
|||
10 |
|
|
|
|
||
|
|
|
|
|
||
2 |
3 |
|
|
|
|
|
|
0 |
|
|
|
|
|


 Ingrid’s Utility Function
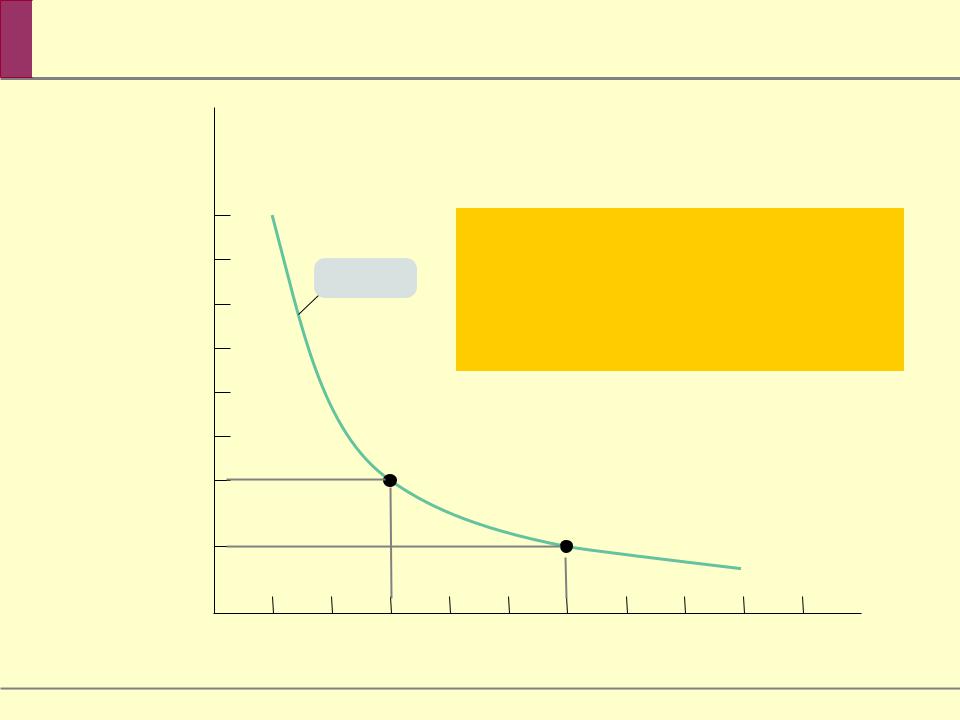
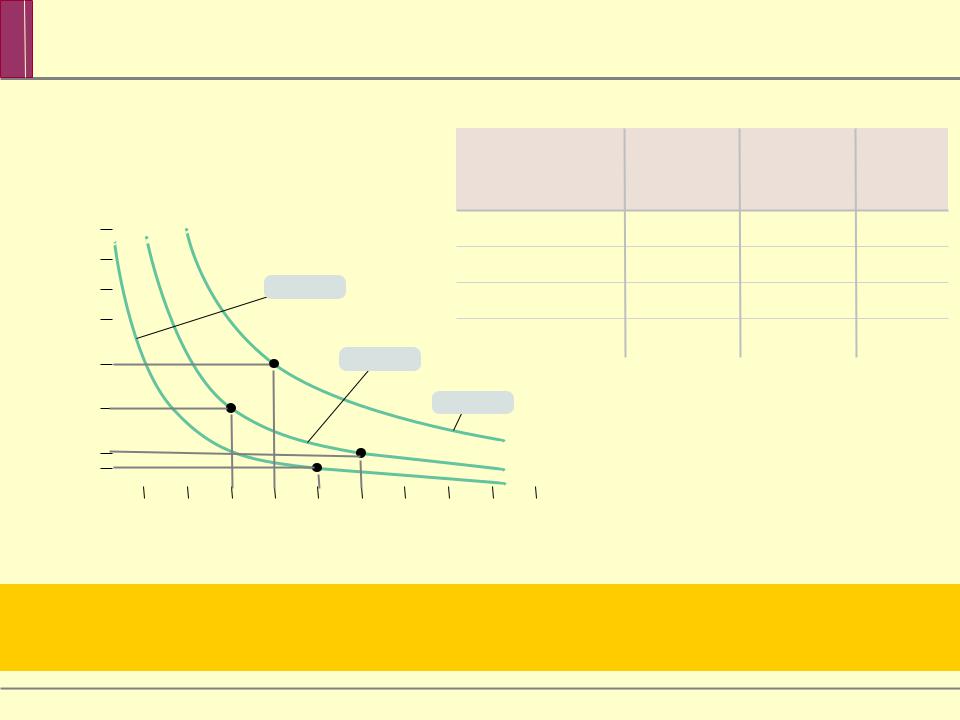
Ingrid is indifferent between A and B: because A and B yield the same total utility level, Ingrid is equally well off with either bundle. Hence, a contour line that maps consumption bundles yielding the same amount of total utility is known as an indifference curve.

 An
An
Quantity of restaurant
90 |
An indifference curve is a |
|
|
|
450 utils |
60 |
yield the same amount of total |
utility for an individual. |
|
|
|
50 |
|
40 |
|
B
0 |
1 |
4 |
5 |
7 |
8 |
9 |
10 |
Quantity of rooms
|
|
|
Consumption |
Quantity of |
Quantity of |
Total utility |
|
|
|
|
|||||
|
|
|
bundle |
rooms |
meals |
(utils) |
|
90 |
|
|
A |
3 |
30 |
450 |
|
80 |
|
|
B |
6 |
15 |
450 |
|
|
391 utils |
|
C |
5 |
10 |
391 |
|
60 |
|
|
|||||
|
|
D |
4 |
45 |
519 |
||
|
|
|
|||||
|
|
450 utils |
|
|
|
|
|
|
|
|
|
|
|
|
|
|
|
|
|
|
|
|
|
0 |
1 |
2 |
The entire utility indifference curve
curve |
to |


 Properties of Indifference Curves
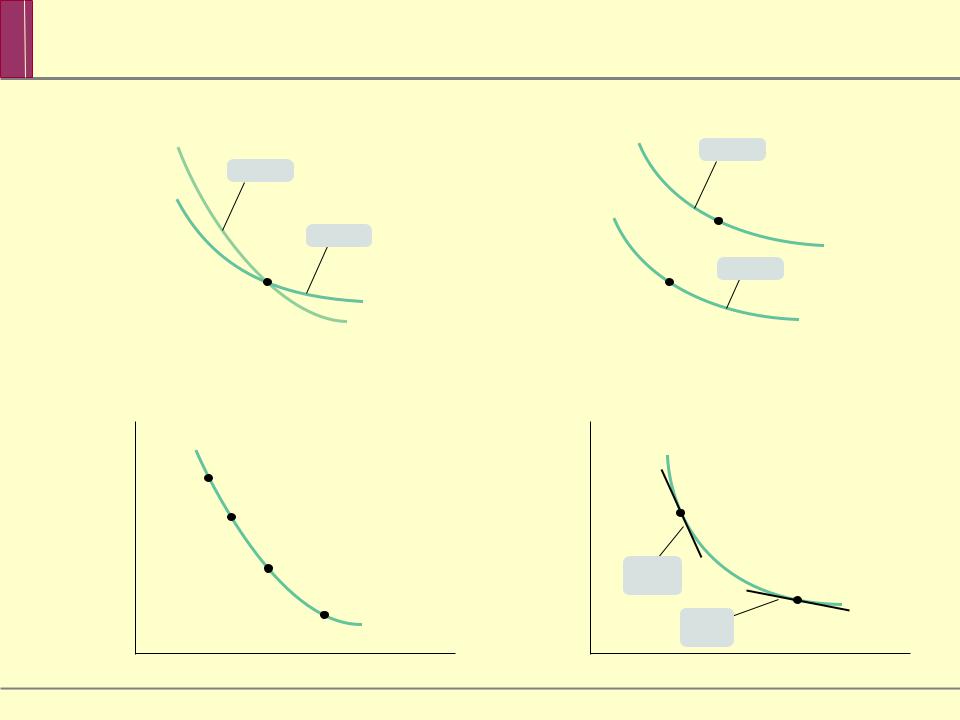
All indifference curve maps share two general properties:
indifference curves never cross
the farther out an indifference curve is from the origin, the higher the level of total utility it indicates
In addition, indifference curves for most goods, called ordinary goods, have two more properties:
they are downward sloping
are convex (bowed-in toward the origin) as a result of diminishing marginal utility
|
Properties of All Indi erence |
||||
Quantity |
|
|
Quantity |
|
|
|
|
|
|||
of |
|
|
of |
|
|
restaurant |
200 utils |
restaurant |
|
||
meals |
|
|
meals |
|
|
|
100 utils |
|
|
|
|
|
|
|
|
utils |
|
|
1 |
|
|
I 1 |
|
|
|
|
|
||
|
|
|
|
|
|
|
Quantity of rooms |
|
Quantity of rooms |
||
|
of Indi erence |
||||
Quantity |
|
|
Quantity |
||
of |
|
|
of |
||
restaurant |
|
|
restaurant |
||
meals |
|
|
meals |
||
St slope
Flatter slope
Quantity of rooms |
Quantity of rooms |


 Indifference Curves and Consumer Choice
We will use indifference curve maps to find the utility-maximizing consumption bundle of a consumer given his/her budget constraint.
The optimal consumption bundle lies on the budget line, and the marginal utility per dollar is the same for every good in the bundle.
The first component of our approach is a new concept, the marginal rate of substitution.