- •1.1 Why Take the GMAT® Exam?
- •1.2 GMAT® Exam Format
- •1.3 What Is the Content of the Test Like?
- •1.4 Integrated Reasoning Section
- •1.5 Quantitative Section
- •1.6 Verbal Section
- •1.7 Analytical Writing Assessment
- •1.8 What Computer Skills Will I Need?
- •1.9 What Are the Test Centers Like?
- •1.10 How Are Scores Calculated?
- •1.11 Test Development Process
- •2.0 How to Prepare
- •2.1 How Should I Prepare to Take the Test?
- •2.2 What About Practice Tests?
- •2.3 How Should I Use the Diagnostic Test?
- •2.4 Where Can I Get Additional Practice?
- •2.5 General Test-Taking Suggestions
- •3.0 Diagnostic Test
- •3.1 Quantitative Questions
- •3.2 Verbal Questions
- •3.3 Quantitative and Verbal Answer Keys
- •3.4 Interpretive Guide
- •3.5 Quantitative Answer Explanations
- •3.6 Verbal Answer Explanations
- •4.0 Math Review
- •4.1 Arithmetic
- •4.2 Algebra
- •4.3 Geometry
- •4.4 Word Problems
- •5.0 Problem Solving
- •5.1 Test-Taking Strategies
- •5.2 The Directions
- •5.3 Practice Questions
- •5.4 Answer Key
- •5.5 Answer Explanations
- •6.0 Data Sufficiency
- •6.1 Test-Taking Strategies
- •6.2 The Directions
- •6.3 Practice Questions
- •6.4 Answer Key
- •6.5 Answer Explanations
- •7.0 Reading Comprehension
- •7.1 What Is Measured
- •7.2 Test-Taking Strategies
- •7.3 The Directions
- •7.4 Practice Questions
- •7.5 Answer Key
- •7.6 Answer Explanations
- •8.0 Critical Reasoning
- •8.1 What Is Measured
- •8.2 Test-Taking Strategies
- •8.3 The Directions
- •8.4 Practice Questions
- •8.5 Answer Key
- •8.6 Answer Explanations
- •9.0 Sentence Correction
- •9.1 Basic English Grammar Rules
- •9.2 Study Suggestions
- •9.3 What Is Measured
- •9.4 Test-Taking Strategies
- •9.5 The Directions
- •9.6 Practice Questions
- •9.7 Answer Key
- •9.8 Answer Explanations
- •10.0 Integrated Reasoning
- •10.1 What Is Measured
- •10.2 The Question Types
- •10.3 Test-Taking Strategies
- •10.4 The Directions
- •11.0 Analytical Writing Assessment
- •11.1 What Is Measured
- •11.2 Test-Taking Strategies
- •11.3 The Directions
- •11.4 GMAT® Scoring Guide: Analysis of an Argument
- •11.5 Sample: Analysis of an Argument
- •11.6 Analysis of an Argument Sample Topics
- •Online Question Bank Information

10.0 Integrated Reasoning
The Integrated Reasoning section measures your ability to understand and evaluate multiple sources and types of information—graphic, numeric, and verbal—as they relate to one another; use quantitative and verbal reasoning to solve complex problems; and solve multiple problems in relation to one another. This section includes text passages, tables, graphs, and other visual information from a variety of content areas; however, the materials and questions do not assume detailed knowledge of the topics discussed. The Integrated Reasoning section differs from the Quantitative and Verbal sections in two important ways: 1) It involves both mathematical and verbal reasoning, either separately or in combination, and 2) questions are answered using four different response formats rather than only traditional multiple-choice.
Four types of questions are used in the Integrated Reasoning section:
Multi-Source Reasoning
Table Analysis
Graphics Interpretation
Two-Part Analysis
Use your unique access code found in the back of this book to access 50 Integrated Reasoning practice questions with full answer explanations.

10.1 What Is Measured
Integrated Reasoning questions assess your ability to apply, evaluate, infer, recognize, and strategize.
Apply concepts presented in the information
Apply questions measure your ability to understand principles, rules, or other concepts in the information provided and apply them to a new context or predict consequences that would follow if new information were incorporated into the context provided. You may be asked to
decide whether new examples would comply with or violate rules established in the information provided
determine how a trend present in the information provided would be affected by new scenarios
use principles established in the information provided to draw conclusions about new data
Evaluate information qualitatively
Evaluate questions measure your ability to make judgments about the quality of information. For example, you may be asked to
decide whether a claim made in one source is supported or undermined by information provided in another source
determine whether the information provided is sufficient to justify a course of action
judge the strength of evidence offered in support of an argument or plan identify errors or gaps in the information provided
Draw inferences from the information
Infer questions ask about information or ideas that are not explicitly stated in the materials provided but can be derived from them. For example, you may be asked to
calculate the probability of an outcome on the basis of given data
indicate whether statements follow logically from the information provided
determine the meaning of a term within the context in which it is used identify the rate of change in data gathered over time
Recognize parts or relationships in the information
Recognize questions measure your ability to identify information that is directly presented in the materials provided, including specific facts or details and relationships

between pieces of information. For example, you may be asked to
identify areas of agreement and disagreement between sources of information
determine the strength of correlation between two variables
indicate which element in a table has a given rank in a combination of categories identify facts provided as evidence in an argument
Make strategic decisions or judgments based on the information
Strategize questions ask about the means of achieving a goal within the context of particular needs or constraints. For example, you may be asked to
choose a plan of action that minimizes risks and maximizes value
identify tradeoffs required to reach a goal
specify the mathematical formula that will yield a desired result
determine which means of completing a task are consistent within given constraints

10.2 The Question Types
The four Integrated Reasoning question types are described in detail below.
Multi-Source Reasoning
Multi-Source Reasoning questions begin with two or three sources of information, each labeled with a tab, which appear on the left side of a split computer screen. One or more of the sources will contain a written passage. The other sources may be tables, graphs, diagrams, or other types of visual information. Only one source of information will be displayed at a time. To view a different source, select its tab from those that appear above the source currently displayed.
The sources of information are accompanied by questions that will ask you to synthesize, compare, interpret, or apply the information presented. As each question associated with the sources appears in turn on the right side of the screen, the initial source will appear again on the left side. You can click on the tabs to view any of the sources as many times as needed. However, you will see only one question at a time and cannot go back to earlier questions.
There are two question formats for Multi-Source Reasoning:
Multiple-choice questions
Multiple–dichotomous choice questions
For multiple-choice questions, select the best of the five answer choices given. Read each question and series of answer choices carefully. Make sure you understand exactly what the question is asking and what the answer choices are.
Multiple–dichotomous choice questions provide three phrases, statements, numerical values, or algebraic expressions that require an indication as to whether each meets a certain condition. For example, you may be asked whether
each statement is true, according to the sources
each statement or numerical value is consistent with the sources
each statement or algebraic expression would solve a problem described in the sources
the value of each algebraic expression can be determined on the basis of the sources
In answering both kinds of Multi-Source Reasoning questions, be aware of the information from each source provided and try to determine the process that works best for you. One strategy is to examine the sources carefully and thoroughly, another is to skim the sources the first time through, or to read the first question before examining the sources. Read each question carefully and make sure you understand exactly what the question is asking. If necessary, go back to the sources to review relevant information.
You will have 30 minutes to complete the Integrated Reasoning section, or an average of 2 minutes and 30 seconds to answer each multiple-choice or multiple–dichotomous

choice question. Keep in mind, however, that you will need time to examine the source materials that accompany the questions—and that time must be factored into the perquestion average.
Table Analysis
Table Analysis questions present a table similar to a spreadsheet. It can be sorted on any of its columns by selecting the column’s title from a drop-down menu. There may be a brief text explaining the table or providing additional information. The question then presents three phrases, statements, numerical values, or algebraic expressions, and you must indicate for each one whether or not it meets a certain condition. For example, you may be asked whether
each statement is true (yes or no), according to the information in the table
each statement or numerical value is consistent or inconsistent with the information in the table
each statement or numerical value can or cannot be determined on the basis of the information in the table
Read the question thoroughly to make sure you understand what is being asked. Then consider each phrase, statement, numerical value, or algebraic expression to learn what information in the table you need to make your decision. In analyzing the table, you may need to, for example,
determine statistics such as mean, median, mode, or range
determine ratios, proportions, or probabilities
identify correlations between two sets of data
compare an entry’s rank in two or more of the table’s categories
You will have 30 minutes to complete the Integrated Reasoning section, or an average of 2 minutes and 30 seconds to answer each question. Keep in mind, however, that each Table Analysis question has three parts that all need to be answered in the time allowed.
Graphics Interpretation
Graphics Interpretation questions present a graph, diagram, or other visual representation of information, followed by one or more statements containing a total of two blanks. The blanks should be filled in with the option from each drop-down menu in order to create the most accurate statement or statements on the basis of the information provided.
Many of the graphs included in Graphics Interpretation questions involve two variables plotted on vertical and horizontal axes. Graphs of this type include bar graphs, line graphs, scatterplots, and bubble graphs. To read these graphs, determine what information is represented on each axis. Do this by carefully examining any information

that may be provided, including labels on the axes, scales on the axes, the title of the graph, and accompanying text. To find the value of a data point on the graph, determine the corresponding values on the horizontal and vertical axes.
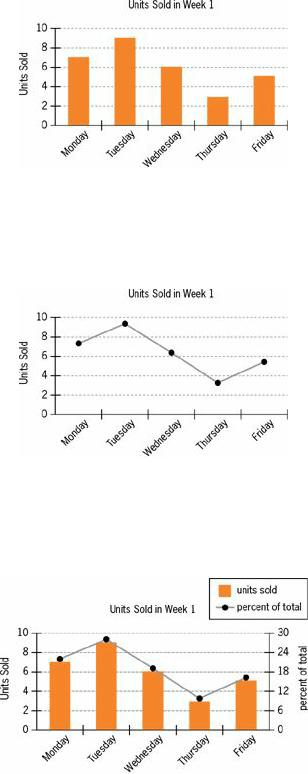
In the simple bar graph below, the first bar indicates that 7 units were sold on Monday of Week 1.
The same information is presented below as a line graph. Each point indicates the total number of units sold on a given day. The slope of the line connecting the points shows how the sales changed over time; a positive slope indicates that sales increased from the previous day, and a negative slope indicates that sales decreased.
A third variable can be indicated with an additional vertical axis. In the following graph, the bars indicate the number of units sold on each day, which corresponds to the scale on the left axis. The line graph shows what percent of the total units were sold on each day. The scale for the percentages is shown on the right axis.
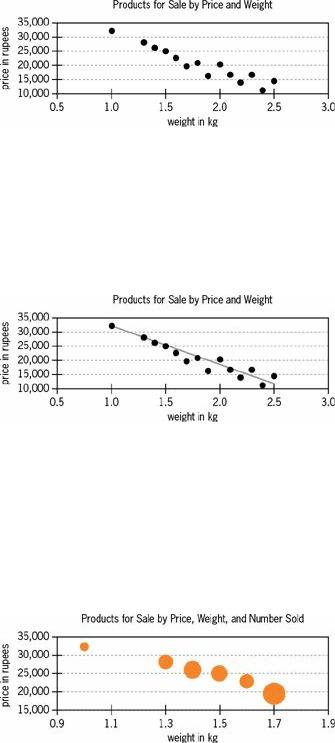
In a scatterplot, each dot is a single data point. In the scatterplot at the top of the next page, each dot represents a type of computer product offered for sale. A dot’s position relative to the vertical axis indicates the product’s price, and its position relative to the horizontal axis indicates its weight. Thus, the product that weighs 1.0 kg costs

approximately 32,000 rupees.
Some scatterplots include a trend line—usually a least squares regression line—that shows the trend of the data. A trend line with positive slope indicates a positive correlation between the two variables, and a trend line with negative slope indicates a negative correlation. Thus, in the scatterplot below, the trend line indicates a negative correlation between price and weight among the products represented on the graph. The closer the data points are to a trend line, the more strongly the data are correlated.
In a bubble graph, each data point is represented by a circle. The center of the circle indicates the values on the horizontal and vertical axes, as in a scatterplot. The relative size of a circle introduces a third variable, number sold. In the bubble graph below, the relative size of the circles indicates how many of the products were sold. Thus, the number of the lightest product sold was smaller than that of any other product shown, and the number of the heaviest product sold was greater than that of any other product shown.
Other common kinds of graphics do not use vertical and horizontal axes. These include pie charts, flow charts, and organization charts.
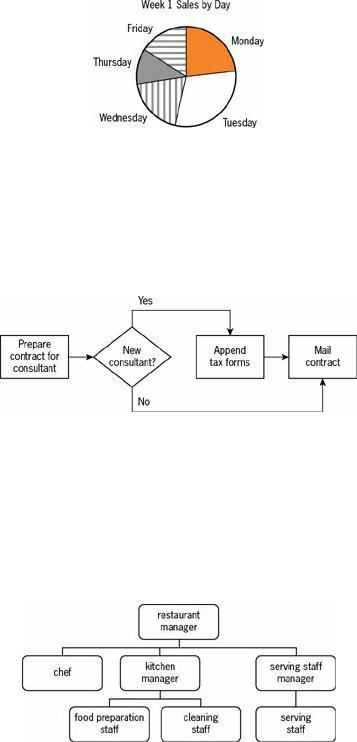
A pie chart uses a circle divided into sectors to show what percent of the whole is represented by each component part. The circle represents the whole, and the relative size of each sector indicates its percent of the whole. Since the whole is 100%, the sum of the percentages of all the sectors is 100 (plus or minus a bit to account for rounding). Below is a pie chart created from the data used in the bar graph and line graph shown earlier. In this example, labels indicating the exact percents are not supplied, but it is still possible to gauge the size of the sectors relative to one another: the smallest percent of sales was on Thursday, and the largest was on Tuesday. In addition, the two radii that mark the

boundaries of the Tuesday sector form an obtuse angle, which indicates that the sector is greater than one-fourth of the circle. Thus, Tuesday’s sales comprised more than 25% of total sales.
A flow chart is a diagram that shows the steps in a process. Often, the steps are represented by symbols, which are connected by arrows showing the flow of the process. Flow charts generally progress from top to bottom or from left to right. In the simple flow chart below, rectangles indicate steps to be completed. The diamond shape indicates a decision point: if the consultant is new, the process continues to the next step, Append tax forms. If the consultant is not new, that step is bypassed and the contract is mailed.
An organization chart represents the structure of an organization. Often, hierarchical relationships are shown with vertical lines and lateral relationships are shown with horizontal lines. In the organization chart at the top of the next page, each rectangle represents an employee or group of employees at a small restaurant. All the employees in the second row of rectangles report to the restaurant manager. In the third row, the food preparation staff and cleaning staff both report to the kitchen manager, and the serving staff report to the serving staff manager.
For all kinds of Graphics Interpretation questions, be sure to read the question carefully to be sure you understand what is being asked. Then read the statement or statements to determine what information you need to learn from the graphic. Finally, choose the answer from each drop-down menu that best completes the statement or statements.
You will have 30 minutes to complete the Integrated Reasoning section, or an average of 2 minutes and 30 seconds to answer each question. Keep in mind, however, that each Graphics Interpretation question has two blanks to be filled. Both blanks must be filled using the drop-down menus in the time allowed.

Two-Part Analysis
Two-Part Analysis questions present a brief written scenario or problem and ask you to make two choices related to that information. These choices are connected to each other in some way; for example, they might be two steps involved in solving a problem or two components required to successfully complete a task. In Two-Part Analysis questions you may be asked to, for example,
calculate the proportions of two different components in a mixture
determine something that would be lost and something that would be gained in a trade-off
find the maximum number of two different products that could be purchased within a certain budget
identify a first action and a second action that together would bring a company into compliance with a new rule
The possible answers and your choices will be given in a table format. The possible answers are listed in the third column, on the right side of the table. Your choices for the first part and second part of the question will be recorded in the first and second columns of the table, respectively. Remember that you need to make a choice for each of the first two vertical columns of the table—not one for each horizontal row.
In answering Two-Part Analysis questions, read the scenario or problem carefully. Be sure you understand what the question is asking. Read all the answer options to be sure that your choices are the best of all those available, and be careful to mark your choices in the proper columns.
You will have 30 minutes to complete the Integrated Reasoning section, or an average of 2 minutes and 30 seconds to answer each question. Keep in mind, however, that you must make the two choices for each Two-Part Analysis question within that average amount of time.
