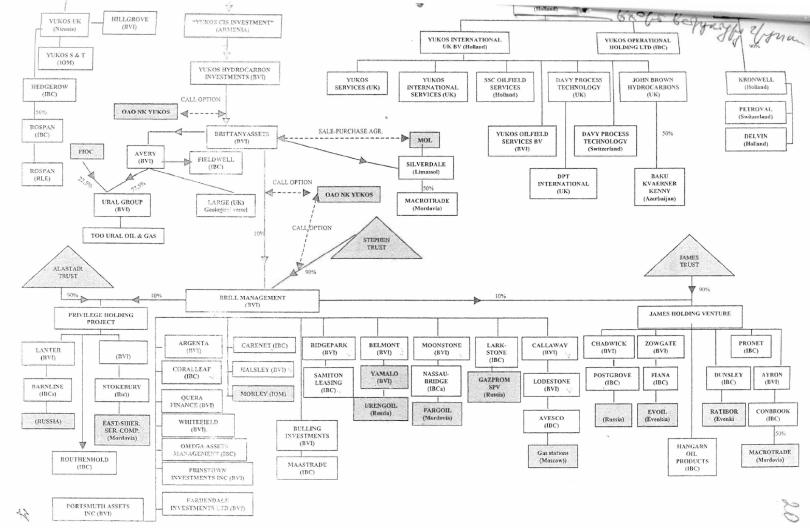
B.ANNEX A2: YUKOS COMPANY STRUCTURE
(extract from Exh. R-3165, referred to in note 2413 of the Award)

C.TABLES T1–T9 SHOWING THE TRIBUNAL’S DAMAGES CALCULATIONS
1.Table T1: Calculation of Total Damages of Claimants as of 19 December 2004 (Date of Expropriation) vs. 30 June 2014 (Date of Award for Valuation Purposes)
19 December 2004
|
Damages component |
|
|
Amount (in USD) |
|
|
Yukos Equity Value |
|
|
21,175,832,823 |
Dividends to end of 2004 |
|
|
2,417,808,219 |
Sum of Equity Value and Dividends |
|
|
23,593,641,042 |
Interest through 30 June 2014 |
|
|
7,596,090,702 |
|
|
|
|
|
|
|
|
Total |
|
|
31,189,731,744 |
|
|
|
|
|
|
|
|
Outstanding |
% of Outstanding |
|
Damages |
|
|
Shares |
Shares |
|
(in USD) |
|
|
|
|
|
|
Yukos Total |
|
1,934,964,578 |
100.00 |
|
31,189,731,744 |
|
|
|
|
|
|
Claimant Hulley |
|
1,090,043,968 |
56.33405 |
|
17,570,439,964 |
|
|
|
|
|
|
Claimant YUL |
|
50,340,995 |
2.60165 |
|
811,447,480 |
|
|
|
|
|
|
Claimant VPL |
|
223,699,175 |
11.56089 |
|
3,605,811,362 |
|
|
|
|
|
|
Claimants Total |
|
1,364,084,138 |
70.49659 |
|
21,987,698,805 |
|
|
|
|
|
|
|
|
30 June 2014 |
|
|
|
|
|
|
|
|
Damages component |
|
|
Amount (in USD) |
|
|
Yukos Equity Value |
|
|
42,625,343,615 |
Dividends and interest (through 30 June 2014) |
|
|
51,981,340,000 |
|
|
|
|
|
|
|
|
Total |
|
|
94,606,683,615 |
|
|
|
|
|
|
|
|
Outstanding |
% of Outstanding |
|
Damages |
|
|
Shares |
Shares |
|
(in USD) |
|
|
|
|
|
|
Yukos Total |
|
1,934,964,578 |
100.00 |
|
94,606,683,615 |
|
|
|
|
|
|
Claimant Hulley |
|
1,090,043,968 |
56.33405 |
|
53,295,779,147 |
|
|
|
|
|
|
Claimant YUL |
|
50,340,995 |
2.60165 |
|
2,461,334,249 |
|
|
|
|
|
|
Claimant VPL |
|
223,699,175 |
11.56089 |
|
10,937,377,001 |
|
|
|
|
|
|
Claimants Total |
|
1,364,084,138 |
70.49659 |
|
66,694,490,398 |
|
|
|
|
|
|
|
|
Damages After 25% Reduction |
|
|
|
|
|
|
|
|
|
Claimant Hulley |
|
39,971,834,360 |
|
|
|
|
|
|
|
|
|
Claimant YUL |
|
1,846,000,687 |
|
|
|
|
|
|
|
|
|
Claimant VPL |
|
8,203,032,751 |
|
|
|
|
|
|
|
|
|
Claimants Total |
|
50,020,867,798 |
Note: Claimants' shareholdings and total number of Outstanding Shares taken from Appendix C.5.b to First Kaczmarek Report
2.Table T2: Equity Value of Yukos Based on Adjustments Made by Professor Dow to Mr. Kaczmarek’s Comparable Companies Calculations and the Evolution of the RTS Oil & Gas Index
Valuation Date |
RTS |
Ratio between RTS Index |
Value of Yukos |
|
Oil & Gas |
at given date and |
(in USD) |
|
Index |
21 November 2007 |
|
|
|
|
|
19 December 2004 |
92.85 |
0.346713966 |
21,175,832,823 |
21 November 2007 |
267.8 |
1 |
61,075,800,000 |
30 June 2014 |
186.90* |
0.697908887 |
42,625,343,615 |
|
|
|
|
* RTS Oil & Gas Index value corresponding to average of values over first 5 months in 2014, see Table T8

3.Table T3: Calculation of Dividends and Interest up to Valuation Date for Valuation as of 30 June 2014
|
Kaczmarek |
Dow-adjusted |
|
Tribunal's |
|
|
|
|
|
Year |
Kaczmarek |
|
|
Interest to |
|
Total |
|
FCFtE |
|
FCFtE |
|
|
|
FCFtE |
|
|
30 June 2014 |
|
|
|
figure |
|
figure |
|
|
|
|
|
figure |
|
|
|
|
|
|
|
|
|
|
|
|
|
|
|
|
|
|
|
|
|
|
|
|
|
|
|
|
|
|
|
|
|
2004 |
3,645,331,570 |
3,218,376,817 |
|
2,500,000,000 |
|
804,887,500 |
|
3,304,887,500 |
|
|
|
|
|
|
|
|
|
|
|
|
|
|
|
|
|
|
|
2005 |
4,796,449,237 |
4,489,360,593 |
|
3,500,000,000 |
|
1,008,227,500 |
|
4,508,227,500 |
|
|
|
|
|
|
|
|
|
|
|
|
|
|
|
|
|
|
|
2006 |
4,676,741,445 |
4,396,018,793 |
|
3,500,000,000 |
|
889,612,500 |
|
4,389,612,500 |
|
|
|
|
|
|
|
|
|
|
|
|
|
|
|
|
|
|
|
2007 |
8,484,005,345 |
7,670,054,341 |
|
6,000,000,000 |
|
1,321,710,000 |
|
7,321,710,000 |
|
|
|
|
|
|
|
|
|
|
|
|
|
|
|
|
|
|
|
2008 |
7,818,745,258 |
6,749,310,837 |
|
6,000,000,000 |
|
1,118,370,000 |
|
7,118,370,000 |
|
|
|
|
|
|
|
|
|
|
|
|
|
|
|
|
|
|
|
2009 |
7,642,393,629 |
5,462,900,795 |
|
5,000,000,000 |
|
762,525,000 |
|
5,762,525,000 |
|
|
|
|
|
|
|
|
|
|
|
|
|
|
|
|
|
|
|
2010 |
4,254,461,116 |
4,841,849,986 |
|
3,500,000,000 |
|
415,152,500 |
|
3,915,152,500 |
|
|
|
|
|
|
|
|
|
|
|
|
|
|
|
|
|
|
|
2011 |
6,285,189,113 |
4,282,802,054 |
|
4,000,000,000 |
|
338,900,000 |
|
4,338,900,000 |
|
|
|
|
|
|
|
|
|
|
|
|
|
|
|
|
|
|
|
2012 |
8,395,083,921 |
3,724,462,548 |
|
5,000,000,000 |
|
254,175,000 |
|
5,254,175,000 |
|
|
|
|
|
|
|
|
|
|
|
|
|
|
|
|
|
|
|
2013 |
7,627,873,208 |
3,147,630,465 |
|
4,000,000,000 |
|
67,780,000 |
|
4,067,780,000 |
|
|
|
|
|
|
|
|
|
|
|
|
|
|
|
|
|
|
|
|
|
2014 |
|
|
|
|
|
|
|
|
|
(to |
3,586,359,907 |
1,309,884,871 |
|
2,000,000,000 |
|
0 |
|
2,000,000,000 |
|
30 |
|
|
|
|
|
|
|
|
|
|
|
|
|
June) |
|
|
|
|
|
|
|
|
|
|
|
|
|
|
|
|
|
Sum |
67,212,633,749 |
49,292,652,101 |
|
45,000,000,000 |
|
6,981,340,000 |
|
51,981,340,000 |
|
|
|
|
|
|
|
|
|
|
|
Notes:
-Kaczmarek figures for 2004 to 2011 taken from Second Kaczmarek Report, Appendix AJ.1.
-Kaczmarek figures for 2012 to 2014 calculated as follows:
Free cash flow to equity (FCFTE) = Free cash flow to the firm - Tax-adjusted interest payments + Change in net debt + 20% of Sibneft dividends, see Appendix AJ.1 to Second Kaczmarek Report.
-Dow-adjusted Kaczmarek figures calculated with excel version of Appendix 1 to Second Dow Report (taking into account all of Dow's corrections).
-Interest has been applied in line with the factors stated in Table T7.
4.Table T4: FCFtE for Years 2012–2014 (Based on Mr. Kaczmarek’s Figures)
|
|
Free cash |
|
Total |
|
|
|
|
|
|
adjustment |
|
Adjusted |
|
|
flow to the |
|
|
|
|
|
as calculated |
|
result |
|
|
firm |
|
|
|
|
|
in Table T5 |
|
|
|
|
|
|
|
|
|
|
|
|
|
|
|
|
|
|
2012 |
|
8,650,212,831 |
|
-255,128,910 |
|
8,395,083,921 |
|
2013 |
7,838,948,724 |
-211,075,516 |
7,627,873,208 |
|
2014 |
|
7,330,053,779 |
|
-157,333,965 |
|
7,172,719,814 |
|
|
|
|
|
|
|
|
|
|
|
|
|
|
|
|
|
Notes:
-Free cash flow to the firm figures taken from Appendix AJ.2 to Second Kaczmarek Report.
-Total adjustment calculated in Table T5.
5.Table T5: Total Adjustment of Free Cash Flow to the Firm
(Required to Obtain FCFtE value for Years 2012–2014 for Mr. Kaczmarek)
|
|
|
|
Tax-adjusted |
|
|
|
|
20% of |
|
Total |
|
|
|
|
interest |
|
Change in |
|
|
|
|
|
|
|
|
Sibneft |
|
|
|
|
|
payments |
|
net debt |
|
|
adjustment |
|
|
|
|
|
|
dividends |
|
|
|
|
|
(subtracted) |
|
|
|
|
|
|
|
|
|
|
|
|
|
|
|
|
|
|
|
|
|
|
|
|
|
|
|
|
|
|
|
|
|
|
|
|
2012 |
|
|
-381,230,527 |
|
|
-19,498,383 |
|
|
145,600,000 |
|
|
-255,128,910 |
|
2013 |
-375,218,163 |
|
18,542,647 |
145,600,000 |
|
-211,075,516 |
|
|
2014 |
|
|
-373,949,497 |
|
|
71,015,532 |
|
|
145,600,000 |
|
|
-157,333,965 |
|
Notes:
-Total adjustment formula taken from Appendix AJ.1 to Second Kaczmarek Report.
-Figures for tax-adjusted interest payments taken from Appendix AJ.2 to Second Kaczmarek Report.
-Change in net debt calculated in Table T6.
-For Sibneft dividends for years 2012 to 2014, it has been assumed that these were equal to the dividends paid in 2010, the last year for which Claimants have provided annual figures (the 2011 figures were based on annualized third quarter figures, see note (6) to Appendix AJ.1 to the Second Kaczmarek Report).
6.Table T6: Change in Net Debt for Years 2012–2014
|
|
Change in net debt |
|
|
2012 |
2013 |
2014 |
|
Long-term debt Y |
7,000,000,000 |
6,965,681,451 |
6,952,780,045 |
|
Short-term debt Y |
597,731,821 |
594,801,351 |
593,699,697 |
|
|
|
|
|
|
|
Long-term debt Y-1 |
7,189,462,610 |
7,000,000,000 |
6,965,681,451 |
|
Short-term debt Y-1 |
613,910,083 |
597,731,821 |
594,801,351 |
|
Difference between Sum of |
|
|
|
|
|
|
|
|
|
|
Long-term and Short-term |
|
|
|
|
|
debt for Y and Y-1 |
|
|
|
|
|
-205,640,872 |
-37,249,019 |
-14,003,060 |
|
|
|
|
|
|
|
|
|
Cash Y |
2,468,733,701 |
2,412,942,035 |
2,327,923,443 |
|
Cash Y-1 |
2,654,876,190 |
2,468,733,701 |
2,412,942,035 |
|
Difference Cash Y and Cash |
|
|
|
|
|
Y-1 |
-186,142,489 |
-55,791,666 |
-85,018,592 |
|
Difference 1 minus Difference |
|
|
|
|
|
|
|
|
|
2 |
-19,498,383 |
18,542,647 |
|
71,015,532 |
Note:
- Formula for change in net debt (as change in long-term debt plus short-term debt, less cash) taken from note (5) to Appendix AJ.1 to Second Kaczmarek Report and Appendix AJ.4 to Second Kaczmarek Report.
7.Table T7: Interest Factors Based on Annual Rate of 3.389 percent (see Table T9)
|
|
|
|
Interest Factors |
|
|
|
|
|
|
|
0.5Y |
|
|
0.01695 |
|
|
1Y |
|
0.03389 |
|
|
1.5Y |
|
|
0.05084 |
|
|
2.5Y |
0.08473 |
|
|
3.5Y |
|
|
0.11862 |
|
|
4.5Y |
0.15251 |
|
|
5.5Y |
|
|
0.18640 |
|
|
6.5Y |
0.22029 |
|
|
7.5Y |
|
|
0.25418 |
|
|
8.5Y |
0.28807 |
|
|
|
|
|
|
9.5Y |
|
|
0.32196 |
|
|
|
|
|
|
|
8.Table T8: RTS Oil and Gas Index Values from 1 January to 24 June 2014
Date |
Value |
24.06.2014 |
212.32 |
23.06.2014 |
204.45 |
20.06.2014 |
202.34 |
19.06.2014 |
204.35 |
18.06.2014 |
204.70 |
17.06.2014 |
201.10 |
16.06.2014 |
202.16 |
11.06.2014 |
201.74 |
10.06.2014 |
200.20 |
09.06.2014 |
198.74 |
06.06.2014 |
198.02 |
05.06.2014 |
193.64 |
04.06.2014 |
191.37 |
03.06.2014 |
191.84 |
02.06.2014 |
192.09 |
30.05.2014 |
187.51 |
29.05.2014 |
191.62 |
28.05.2014 |
190.06 |
27.05.2014 |
190.95 |
26.05.2014 |
197.69 |
23.05.2014 |
196.70 |
22.05.2014 |
195.66 |
21.05.2014 |
196.28 |
20.05.2014 |
193.19 |
19.05.2014 |
191.71 |
16.05.2014 |
188.03 |
15.05.2014 |
186.38 |
14.05.2014 |
187.74 |
13.05.2014 |
186.26 |
12.05.2014 |
184.38 |
08.05.2014 |
184.14 |
07.05.2014 |
184.98 |
06.05.2014 |
177.49 |
05.05.2014 |
173.50 |
02.05.2014 |
174.25 |
30.04.2014 |
175.39 |
29.04.2014 |
175.77 |
28.04.2014 |
173.16 |
25.04.2014 |
170.99 |
24.04.2014 |
173.90 |
23.04.2014 |
176.68 |