

1.8. Mean for grouped data
The statistical measures we have presented for the central location and dispersion of data sets are computed using the individual data values. The computational procedures we have discussed provide the most common methods for computing measures of central location and dispersion. However, in some situations the data available only in grouped or frequency distribution form. In these cases special procedures are used in order to obtain approximations to the common measures of central location and dispersion.
The formulas used to calculate the mean for grouped data are as follows:
Mean for
the population data: 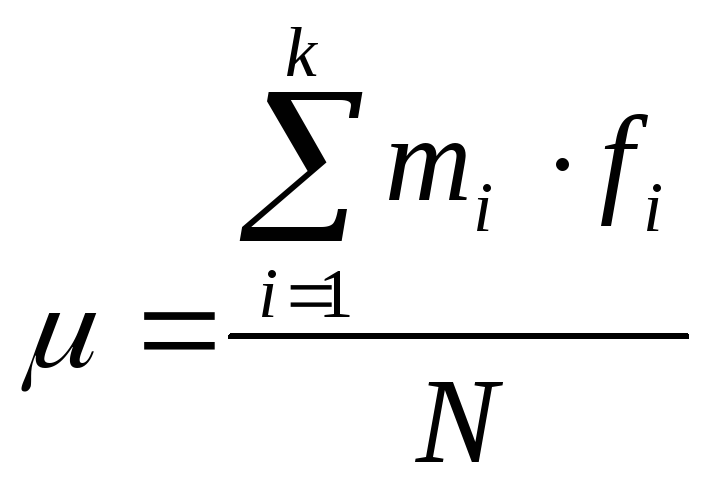
Mean for
the sample data: 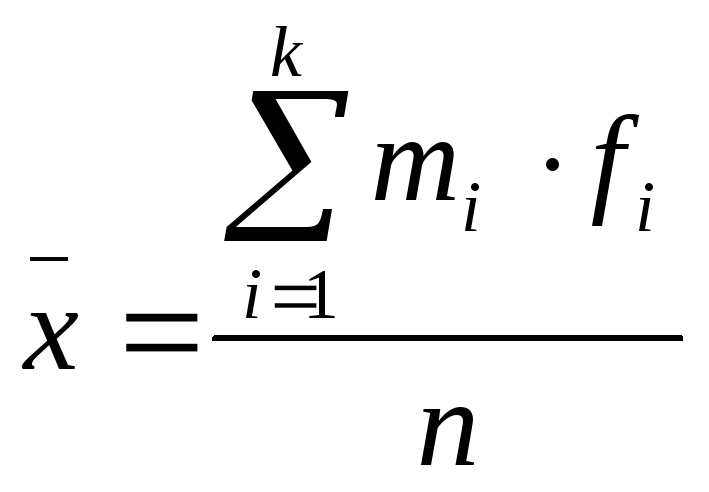
Where ![]() is
the midpoint of
is
the midpoint of ![]() class,
class,
![]() is
the frequency of
is
the frequency of ![]() class,
class,
![]() is
the total number of classes.
is
the total number of classes.
To
calculate the mean for grouped data, first find the midpoint of each
class and then multiply by the frequencies of the corresponding
classes. The sum of these products, denoted by![]() ,
gives an approximation for the sum of all values. To find the value
of the mean, divide this sum by the total number of observations in
the data.
,
gives an approximation for the sum of all values. To find the value
of the mean, divide this sum by the total number of observations in
the data.
Example:
The following table gives the frequency distribution of daily commuting time (in minutes) from home to work for all 25 employees of a company
-
Daily commuting time (minutes)
Number of employees
0 to less than 10
10 to less than 20
20 to less than 30
30 to less than 40
40 to less than 50
4
9
6
4
2
Calculate the mean of daily commuting time.
Solution:
Note that
because the data set includes all 25 employees of the company, it
represents the population. Table 1.12 shows the calculation of ![]() .
.
In table
1.12- ![]() denotes
the midpoint of the classes.
denotes
the midpoint of the classes.
Table 1.12
-
Daily commuting time (minutes)
0 to less than 10
10 to less than 20
20 to less than 30
30 to less than 40
40 to less than 50
4
9
6
4
2
5
15
25
35
45
20
135
150
140
90

To
calculate the mean, we first find the midpoint of each class. The
class midpoints are recorded in the third column of Table 1.12. The
products of the midpoints and the corresponding frequencies are
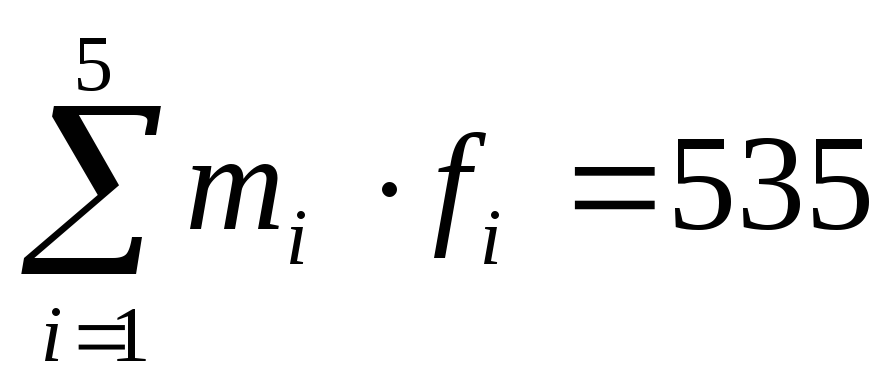
listed in the fourth column of that table. The sum of column, denoted
by ![]() ,
gives the approximate total daily commuting time( in minutes) for all
25 employees. The mean is obtained by dividing this sum by the total
frequency. Therefore
,
gives the approximate total daily commuting time( in minutes) for all
25 employees. The mean is obtained by dividing this sum by the total
frequency. Therefore 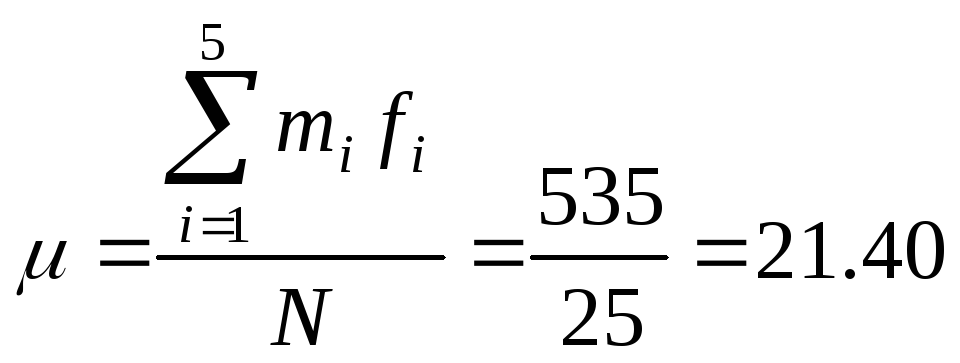 minutes
Thus, the employees of this company spend an average of 21.40 minutes a day commuting from home to work.
1.9. The Median for grouped data
Recall that
the median is different for odd and for even numbers of observations
when the data are not in the grouped form. However, if the n
data are written in grouped form, then median is simply defined as
the ![]() observation.
observation.
Thus, if we
have the frequency distribution of 100 observations, then the ![]() observation in order of size would be the median; if we have 101
observations then the
observation in order of size would be the median; if we have 101
observations then the ![]() observation would be the median.
observation would be the median.
To find median, first, we need to find the class which contains the middle observation. Let M denotes the number of this class, where M is the some integers from 1 to k. If the median occurs in the fifth class then M=5; if it occurs in the seventh class, then M=7; and so on.
Let the
frequency of the ![]() class
be denoted by
class
be denoted by![]() .
Next, note how many observations are in
.
Next, note how many observations are in ![]() classes
preceding the median class; denote this cumulative frequency by
classes
preceding the median class; denote this cumulative frequency by![]() .
.
The general formula for median is
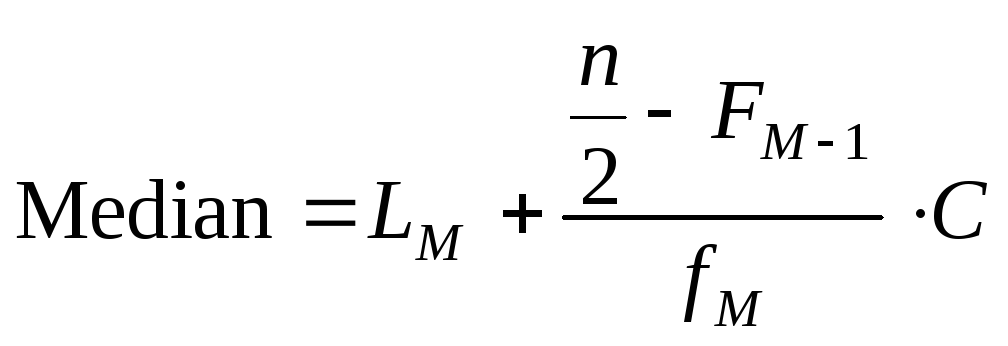
where
![]() lower boundary of the median class
lower boundary of the median class
![]() number of observations
number of observations
![]() the number of observations in the median class
the number of observations in the median class
![]() the
number of observations in the
the
number of observations in the ![]() classes
classes
preceding the median class
![]() width of the median class
width of the median class
Example: Find the median of the frequency distribution
-
Starting monthly salary(in dollars)
Frequency
900-1000
1000-1100
1100-1200
1200-1300
1300-1400
1400-1500
1500-1600
2
4
3
1
1
0
1
n=12
Solution:
First of all, let us divide n (the number of all observations) to find the halfway point.
![]()
To find the
class that contains ![]() observation
it is necessary to form cumulative frequency distribution. This class
is called the median class; it contains the median:
observation
it is necessary to form cumulative frequency distribution. This class
is called the median class; it contains the median:
-
Starting monthly salary(in dollars)
Frequency
Cumulative frequency
900-1000
1000-1100
1100-1200
1200-1300
1300-1400
1400-1500
1500-1600
2
4
3
1
1
0
1
2
6
9
10
11
11
12
![]() observation is in
observation is in ![]() class. So, the median class is 1000-1100.
class. So, the median class is 1000-1100.
Now let us apply

In our case
![]() ;
; ![]()
![]() ;
; ![]() ;
; ![]()
After substituting we get
![]()
The median is 1100. In other words, median as a measure of center indicates that average value of monthly salaries of 12 employees is 1100$.