

1.6. Numerical summary of grouped data
1.6.1. Mean for data with multiple-observation values
Suppose
that a data set contains values ![]() occurring with frequencies,
occurring with frequencies, ![]() respectively.
respectively.
1.
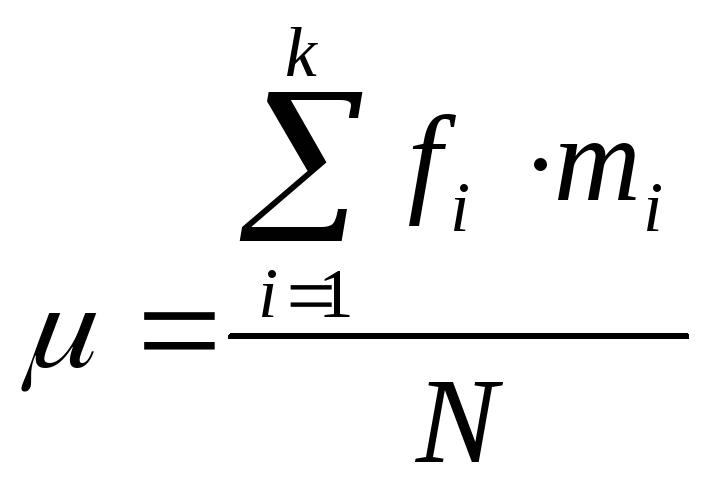
For a population of ![]() observations,
so that
observations,
so that
![]()
The mean is
2.
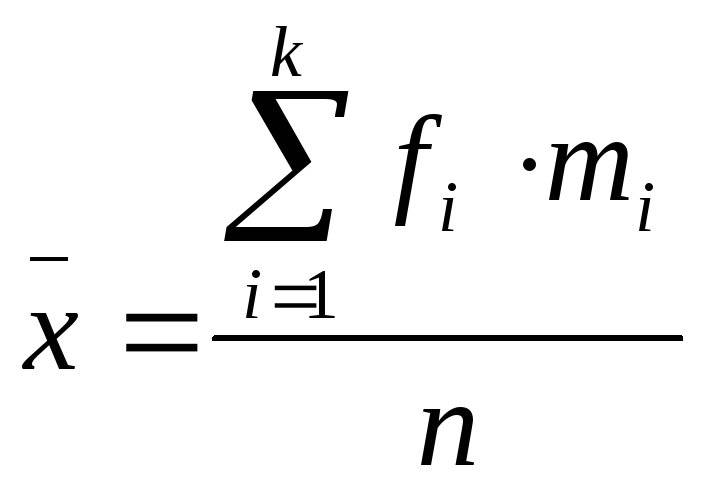
For a sample of ![]() observations,
so that
observations,
so that
![]()
The mean is
The arithmetic is most conveniently set out in tabular form.
Example:
The score for the sample of 25 students on a 5-point quiz are shown below. Find the mean.
Score Frequency 0 1 2 3 4 5 1 2 6 12 3 1
![]()
![]()
![]()
Solution:
We must
find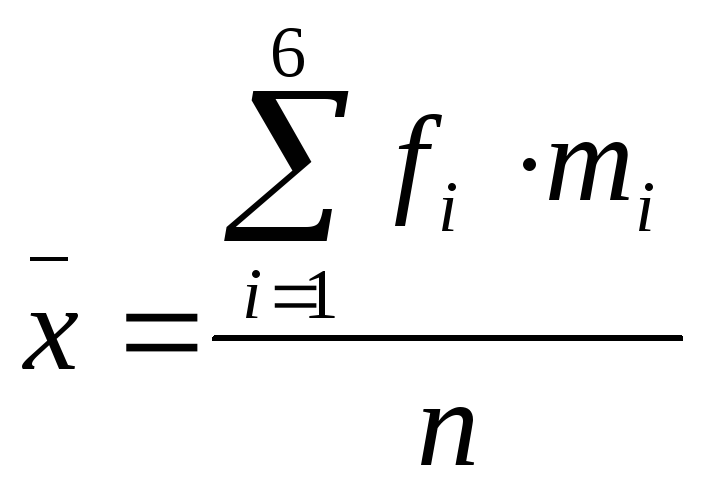 .
We need a column to display the computation of the quantity
.
We need a column to display the computation of the quantity![]() (Table 1.3):
(Table 1.3):
Table 1.3
Score Frequency 0 1 2 3 4 5 1 2 6 12 3 1 0·
1=0 1·
2=2 2·
6=12 3·
12=36 4·
3=12 5·
1=5
![]()
![]()
![]()
![]()
![]()
In the end,
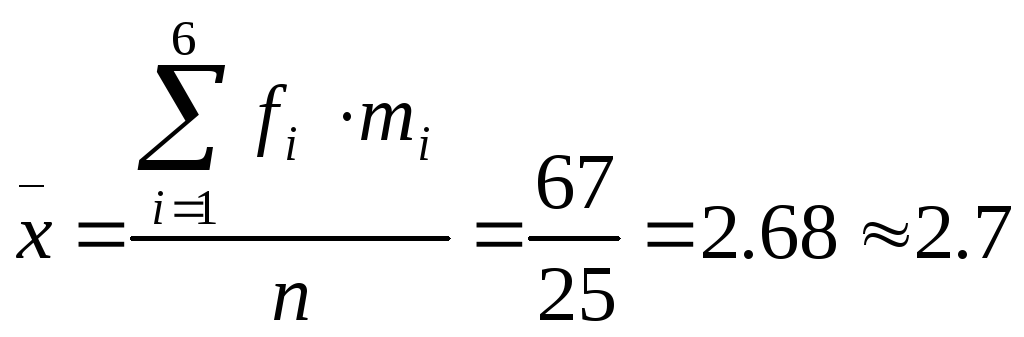 .
.
Hence the mean of the scores
Is approximately 2.7.
1.6.2. Median for data with multiple-observation values
For an ungrouped frequency distribution, find the median by examining the cumulative frequency to locate the middle value, as shown in the next example.
Example:
The number of videocassette recorders sold per month over a two-year period is recorded below. Find the median.
Solution:
As we know
the median is ![]() observation.
observation.
Since ![]() then
then ![]() .
.
To find
![]() and
and![]() observations
we write corresponding cumulative frequency distribution (Table 1.4).
observations
we write corresponding cumulative frequency distribution (Table 1.4).
Table1.4
Class
Number of sets
sold Frequency (month)
Cumulative frequency 1 2 3 4 5 6
7
1
2
3
4
5
6
7 3 8 5 4 2 1 1 3 11 16 20 22 23 24
![]()
The ![]() and
and
![]() values
fall in class 3.
values
fall in class 3.
![]() value=3
;
value=3
; ![]() value=3.
value=3.
Therefore,
![]() .
.
1.6.3. Mode for data with multiple-observation values
As we already know, the mode is the most frequently occurring value. A similar concept can be used when the data are available in multiple-observation form.
Example:
The following data were collected on the number of blood tests a hospital conducted for a random sample of 50 days. Find the mode.
-
Number of tests per day
Frequency
(days)
26
27
28
29
30
31
32
5
9
12
18
5
0
1
Solution:
Since 29 days were given on 18 days (the number of tests that occurs most often), the mode is 29.
1.6.4. Variance for data with multiple-observation values
Suppose
that a data set contains values ![]() occurring with frequencies,
occurring with frequencies, ![]() respectively.
respectively.
1.
For a population of ![]() observations,
so that
observations,
so that
![]()
The variance is
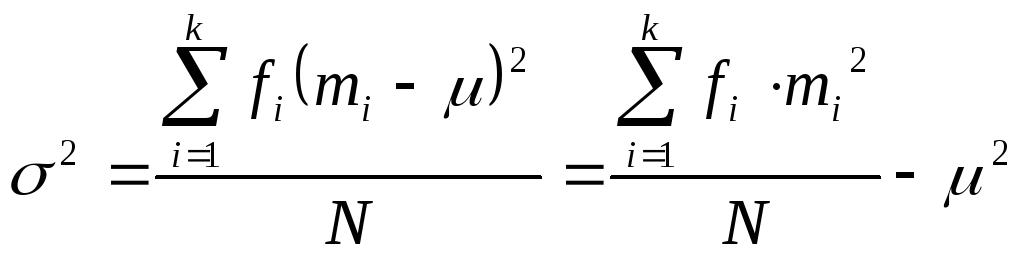
The
standard deviation is![]() .
.
2.
For a sample of ![]() observations,
so that
observations,
so that
![]()
The variance is
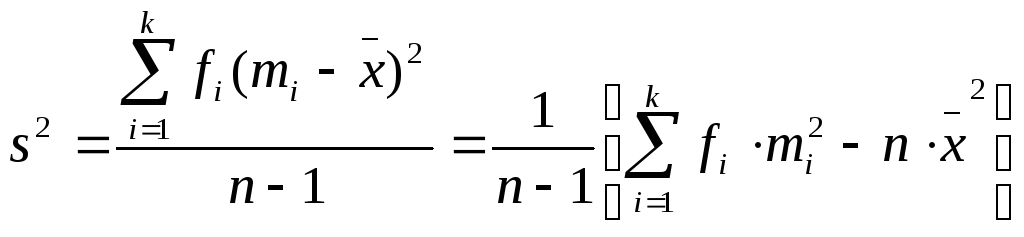
The
standard deviation is ![]() .
.
The arithmetic is most conveniently set out in tabular form.
Example:
The score for the sample of 25 students on a 5-point quiz are shown below.
Find a sample variance and standard deviation.
Score Frequency 0 1 2 3 4 5 1 2 6 12 3 1
![]()
![]()
Solution:
Remark:
The denominator in the formula 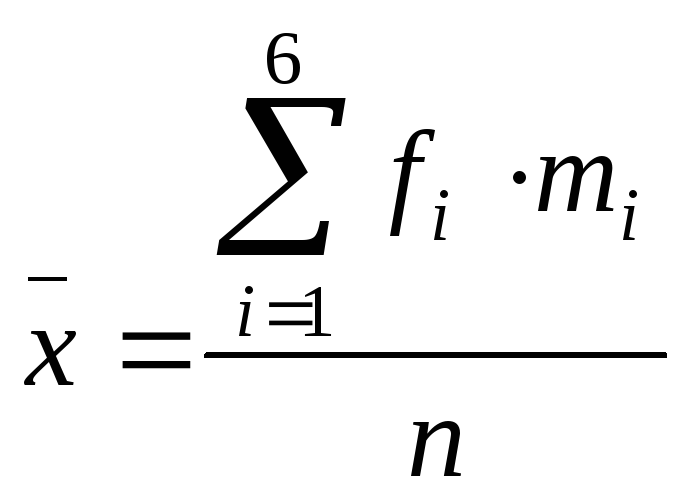 is
obtained by summing the frequencies
is
obtained by summing the frequencies![]() .
It is not number of classes.
.
It is not number of classes.
To
calculate variance we need three columns to display the computation
of the quantities ![]() a
column for the
a
column for the ![]() a
column for the
a
column for the ![]() and
a column for the
and
a column for the![]() .
We also need a column for
.
We also need a column for ![]() and
a final column for the products
and
a final column for the products![]() .
(Table 1.5)
.
(Table 1.5)
The
necessary computations for finding ![]() are
shown below.
are
shown below.
Table 1.5
|
Score
|
Frequency
|
|
|
|
|
0 1 2 3 4 5 |
1 2 6 12 3 1 |
0-2.7=-2.7 1-2.7=-1.7 2-2.7=-0.7 3-2.7=0.3 4-2.7=1.3 5-2.7=2.3 |
7.29 2.89 0.49 0.09 1.69 5.29 |
0· 7.29=0 1· 2.89=2.89 2· 0.49=0.98 3· 0.09=0.27 4· 1.69=6.76 5· 5.29=26.45 |
|
|
|
|
|
|
Thus we
have 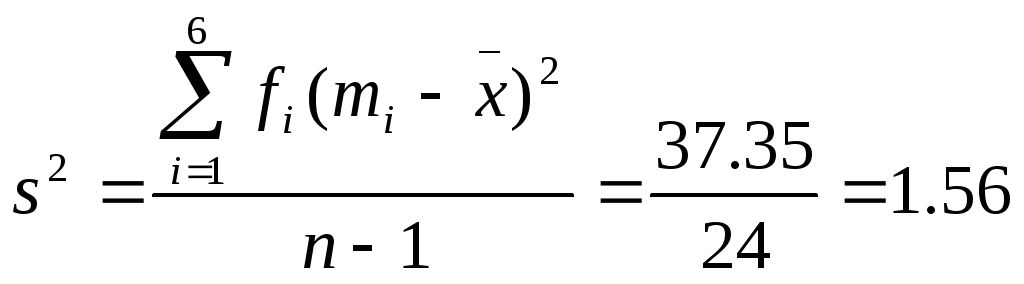
![]() .
.
Example:
The number of television sets sold per month over a two year period is reported below. Find the variance and standard deviation for the data.
-
Number of sets
sold
Frequency (month)
5
6
7
8
9
10
2
3
8
1
6
4
Solution:
Let us
apply 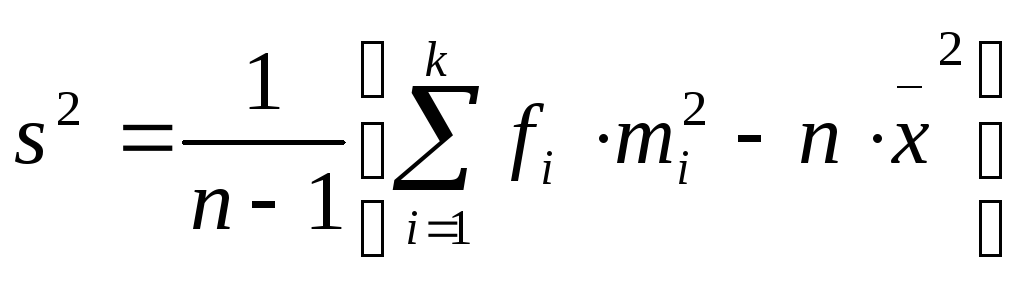 .
.
Make a table as shown below
Sets
Frequency
![]()
![]()
![]()
![]()
![]()
![]()
![]()
![]()
![]()
![]()
![]()
![]()
![]()
![]()
![]()
![]()
![]()
![]()
![]()
![]()
![]()
![]()
![]()
![]()
![]()
![]()
![]()
![]()
![]()
![]()
![]()
![]()
![]()
![]()
![]()
![]()
![]()
![]()

![]()
![]()
To find standard deviation we take the square root of variance
![]() .
.
Exercises
1. The following numbers of books were read by each of the 28 students in a literature class.
a
Number
of books Frequency (students) 0 1 2 3 4 2 6 12 5 3
b) Find the median
c) Find the mode
d) Find the variance and standard deviation.
2. The all forty students in a class found the following figures for number of hours spent studying in the week before final exam
a
Time
(hours)
Number
of students 1 2 3 4 5 1 7 15 10 7
b) Find the median
c) Find the mode
d) Find the variance and standard deviation for this population.
3. A sample of fifty personal property insurance policies found the following numbers of claims over the past 2 years
|
Number of claims |
0 1 2 3 4 5 6 |
|
Number of policies |
21 13 5 4 2 3 2 |
a) Find the mean number of claims per day policy
b) Find the sample median of claims
c) Find the modal number of claims for this sample
d) Find the sample variance and standard deviation.
4. For sample of 50 antique car owners, the following numbers of cars’ ages was obtained
Ages (in
years) Frequency (cars) 17 18 19 20 20 18 8 4
b) Find the median
c) Find the modal number
d) Find the sample variance and standard deviation.
Net
worth (in
million of dollars) Frequency
15 20 25 30 35 40 2 8 15 7 10 3
a) Find the sample mean net worth
b) Find the median
c) Find the mode
d) Find the sample variance and standard deviation
Answers.
1. a) 2.04; b) 2; c) 2; d) 1.09; 1.04; 2. a) 3.375; b) 3; c) 3; d) 1.08; 1.04;
3. a) 1.4; b) 1; c) 0; d) 3.061; 1.75; 4. a) 17.92; b) 18; c) 17; d) 0.89; 0.94; 5. a) 27.7; b) 25; c) 25; d) 41.98; 6.48.