

1.10. Modal class
The mode for grouped data is the modal class. The modal class is the class with the largest frequency.
Example:
Find the mode of the frequency distribution
Class Frequency 5-10 10-15 15-20 20-25 25-30 30-35 1 2 3 7 4 3
n=20
The modal class is 20-25, since it has the largest frequency. Sometimes the midpoint of the class is used rather than the boundaries; hence the mode could be given as 22.5.
Exercises
Dinner
check (dollars) Frequency 4-8 8-12 12-16 16-20 20-24 24-28 4 5 7 2 1 1
Compute the mean, median, and mode for the above data.
2. The following table gives the frequency distribution of entertainment expenditures (in dollars) in curried by 50 families during the past week.
Find the mean, median and mode.
Entertainment
expenditure (dollars) Number
of families 0-10 10-20 20-30 30-40 40-50 50-60 5 10 15 12 5 3
3. The following table gives the frequency distribution of total hours studying during the semester for sample of 40 university students enrolled in an introductory business statistics course .
Find the mean, median, and mode
Hours
of study Number
of students 24-40 40-56 56-72 72-88 88-104 104-120
3
5
10
12
5
5
n=
4. This frequency distribution represents the data obtained from sample of 75 copying machine service technicians. The values represent the days between service calls for various copying machines.
Find the mean, median, and mode.
Class
boundaries Frequency 15.5-18.5 18.5-21.5 21.5-24.5 24.5-27.5 27.5-30.5 30.5-33.5 14 12 18 10 15 6
Class
limits Frequency 13-19 20-26 27-33 34-40 41-47 48-54 55-61 62-68 2 7 12 5 6 1 0 2
n=35
Answers
1. 12.8; 12.57; 14; 2. 27.20; 26.7; 25; 3. 74.40; 74.67; 80; 4. 23.72; 23.417; 23; 5. 33.8; 31.5; modal class =27-33.
1.11. Variance and standard deviation for grouped data
Suppose that we have data grouped into K classes, with frequencies
![]() .
If the midpoints of these classes are
.
If the midpoints of these classes are ![]() ,
the mean and variance of the grouped data are estimated by using
following formulas
,
the mean and variance of the grouped data are estimated by using
following formulas
1.
For a population of ![]() observations,
so that
observations,
so that
![]()
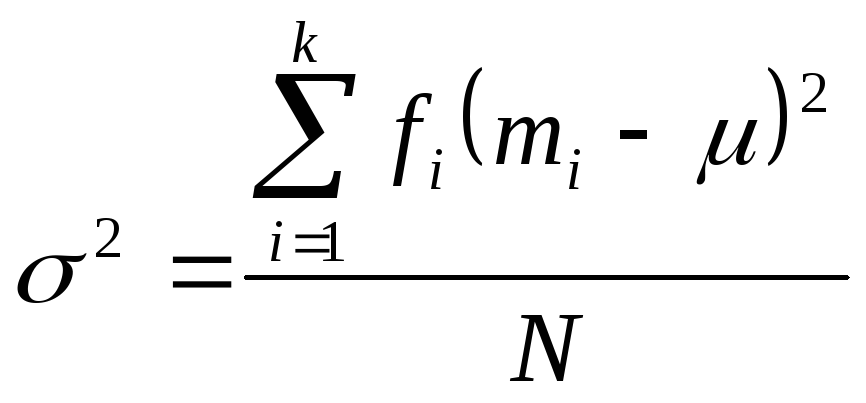
The variance is
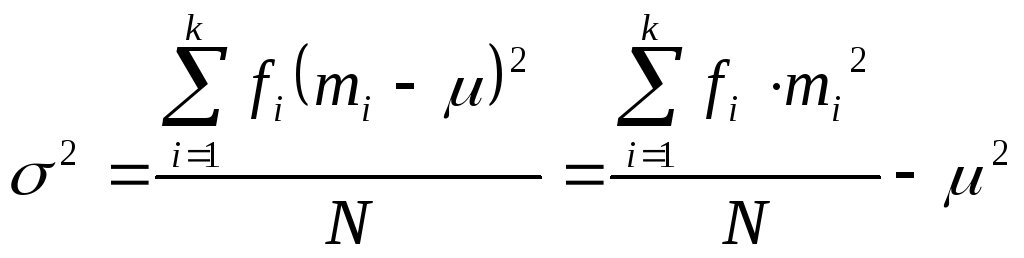
The
standard deviation is![]() .
.
2.
For a sample of ![]() observations,
so that
observations,
so that ![]()
The variance is

The
standard deviation is![]() .
.
Example:
The following table gives the distribution of the number of days for which all 40 employees of a company were absent during the last year
-
Number of days absent
Number of employees
0-2
3-5
6-8
9-11
12-14
13
14
6
4
3
Calculate the variance and standard deviation.
Solution:
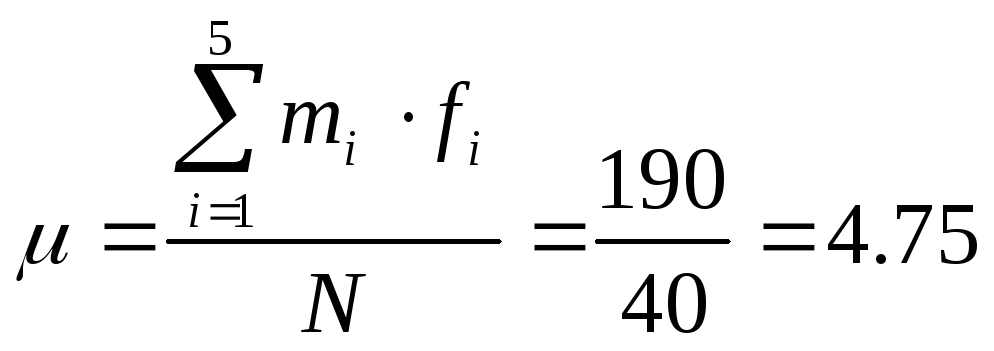
Let us apply
First we
need to find ![]() and
and
![]()
|
Class
|
Number of days absent |
Number
of employees |
Class mark
|
|
|
1 2 3 4 5 |
0-2 3-5 6-8 9-11 12-14 |
13 14 6 4 3 |
1 4 7 10 13 |
13 56 42 40 39 |
|
|
|
40 |
|
|
Now we need
to find ![]() .
.
In order to
find products ![]() we
must first find the square quantities
we
must first find the square quantities ![]() .
We need three columns to display the computation of the quantities
.
We need three columns to display the computation of the quantities ![]() a
column for
a
column for ![]() ,
a column for
,
a column for ![]() ,
and a column for the
,
and a column for the ![]() .
We also need a column for
.
We also need a column for ![]() and a final column for the products
and a final column for the products![]() .
The necessary computations are shown below in the table 1.13.
.
The necessary computations are shown below in the table 1.13.
Table 1.13.
|
Class
|
Class mark
|
|
|
|
|
|
1 2 3 4 5 |
1 4 7 10 13 |
13 14 6 4 3 |
1-4.75=-3.75 4-4.75=-0.75 7-4.75=2.25 10-4.75=5.25 13-4.75=8.25 |
14.06 0.56 5.06 27.56 68.06 |
182.81 7.88 30.38 110.25 204.19 |
|
|
|
|
|
|
535.51 |
In the end,
![]() and
and ![]()
Example:
T
Number
of orders 10-12 13-15 16-18 19-21 4 12 20 14
![]()
Solution:
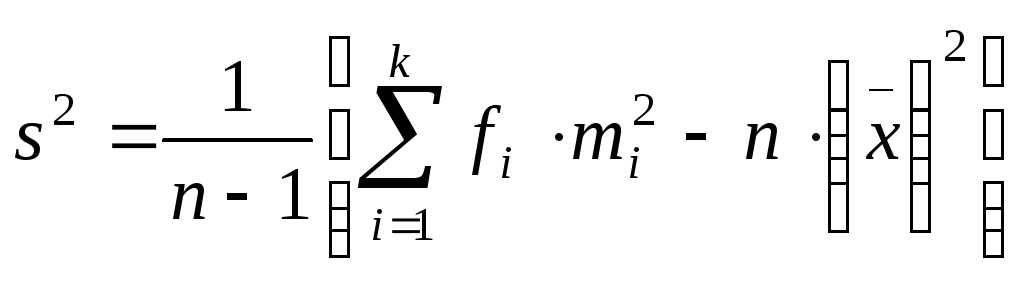
Because the data includes only 50 days,
it represents a sample. Hence, we will use sample formulas to calculate the variance and standard deviation.
Let us apply
All the information required for the calculation of the variance and standard deviation appears in the following table
|
Number of orders |
|
|
|
|
|
|
10-12 13-15 16-18 19-21 |
4 12 20 14 |
11 14 17 20 |
44 168 340 280 |
121 196 289 400 |
484 2352 5780 5600 |
|
|
N=50 |
|
832 |
|
14216 |
![]()
By substituting the values in the formula for the sample variance, we obtain

![]()
![]()
Hence,
the standard deviation is ![]() .
.
Thus, the standard deviation of the number of orders received at office of this mail-order company during the past 50 days is 2.75.