

XRF
.pdfPrinciples of X-ray Fluorescence
I W
Rh
Cr
 λ (nm)
Figure 29: An x-ray tube’s continuum depends on the applied kV, the mA and the anode material
These tubes are called side-window tubes because the Be window is at the side of the tube housing. It is also possible to rearrange the filament and the anode, and have a window at the end of the tube (an end-window tube). An alternative design is shown in Figure 27. The electrons hit the anode on one side, the x-rays pass through the anode leaving it at the opposite side, and the radiation leaves the tube through the Be-window. These tubes are called Target Transmission tubes.
20..100kV |
anode |
Be window |
Current |
|
|
electrons |
|
|
filament |
|
X-ray photons |
Figure 27 Design of a target transmission tube
4.5.Secondary targets
A secondary target is irradiated by a source and emits its characteristic radiation in a similar way to the target (anode) in the tube. It will also scatter a part of the incoming radiation. The target acts as a source, and the radiation coming from the target is used to irradiate the sample. There are three types of secondary targets: Fluorescent targets, Barkla targets and Bragg targets.
4.5.1. Fluorescent targets
Fluorescent targets use the fluorescence of elements in the target to excite the sample. These targets also scatter the tube radiation, but the fluorescence dominates. Scatter is low because the targets (mainly) contain heavy elements.
The tube irradiates the target, and the element(s) in the target emit their characteristic fluorescent radiation. This radiation falls on the sample, causing fluorescent radiation. For highest fluorescence in the sample, the energy of the x-rays coming from the target must be just above the binding energy of the electrons of the elements in the sample. Spectrometers can be equipped with a set of different targets, and optimum fluorescence is achieved by selecting the correct target.
4.5.2. Barkla targets
Barkla targets use scattered tube radiation to excite the sample. These targets also fluoresce but the energy or intensity of these lines is too low to excite elements in the sample. Barkla targets are made of light elements like Al2O3 and B4C, because these give the highest scattered radiation.
page: 21 |
DYF-000000 / version 0.1 |

Principles of X-ray Fluorescence
Barkla targets scatter a wide energy spectrum and can be used to measure a large range of elements. Generally Barkla targets measure the heavier elements.
4.5.3. Bragg targets
Bragg targets are crystals that reflect only one specific energy in a certain direction. By mounting the crystal between the tube and the sample it is possible to select a single tube line to irradiate the sample, with no other radiation diffracted towards the sample. This will reduce the background and improve the detection limit. If the spacing of the planes in the crystal is such that the tube line is diffracted at an angle of 90o, it can be used in 3D optics as a perfect polarizer.
4.6.Detectors and Multi Channel Analyzers
Different types of detectors are used in XRF. ED-XRF mainly uses solid-state detectors where WD-XRF uses gas-filled detectors and scintillation detectors. The ED-XRF detector is a widerange detector and measures all elements from Na up to U. Gas-filled detectors measure elements from Be up to Cu and the scintillation detector from Be up to U. All these detectors produce an electrical pulse when an x-ray photon enters the detector, and the height of this pulse is proportional to the energy of the incoming photon. The pulses are amplified and then counted by a Multi Channel Analyzer.
There are three important properties of detection systems: resolution, sensitivity and dispersion. Resolution is the ability of the detector to distinguish between different energy levels. A high resolution means that the detector can distinguish between many different energies. Sensitivity indicates how efficiently incoming photons are counted. If for instance a detector is very thin, incoming photons may pass it without producing a pulse. Sensitivity is high if the ratio of the number of pulses against the number of incoming photons is high.
Dispersion indicates the ability of the detector to separate x-rays with different energies. A high dispersion means that different energies are separated well.
4.7.Multi Channel Analyzer (MCA)
The MCA counts how many pulses are generated in each height interval. The number of pulses of a certain height gives the intensity of the corresponding energy. The ability of the detector and MCA to distinguish between different energies is called the resolution.
Figure 28 MCA makes a histogram of the energy of the detected photons
Strictly speaking a WD-XRF only has to count pulses and does not have to distinguish between their heights, because the crystal has already selected x-rays with one specific energy. In
page: 22 |
DYF-000000 / version 0.1 |
Principles of X-ray Fluorescence
practical situations the MCA for a WD-XRF detector is able to distinguish 100..255 different energy levels.
In ED-XRF spectrometers, the detector and MCA are able distinguish between 1000 and 16000 different energy levels. This is sufficient to analyze spectra and to separate the radiation of the elements in a sample.
4.7.1. ED Solid state detector
Figure 29 shows the basic design of a solid-state detector. It is constructed of a body of Silicon, Germanium or other semiconducting material. A beryllium side-window allows X-ray photons to enter the detector. On the front there is a dead layer and on the back there is a collecting plate.
Be Window Dead layer |
+ |
|
|
MCA |
||||||||||||
|
|
|
||||||||||||||
|
|
|
|
|
|
|
|
|
|
|
|
|
body |
|
|
|
|
|
|
|
|
|
|
|
|
|
|
|
|
|
|
|
|
Photon
electrons
-
Figure 29 Basic design of a solid-state detector
Photons pass through the window and penetrate the body of the detector to produce electronhole pairs in the body. The number of electrons depends on the energy of the incoming photons. The higher the energy the more electrons will be produced.
A high voltage (1500V) across the dead layer and the back means that the electrons are attracted to the back. When the electrons reach the back, the potential drops and gives a negative pulse. The depth of the pulse is proportional to the number of electrons and hence proportional to the energy of the incoming radiation. After amplification, a Multi Channel Analyzer (MCA) counts the pulses
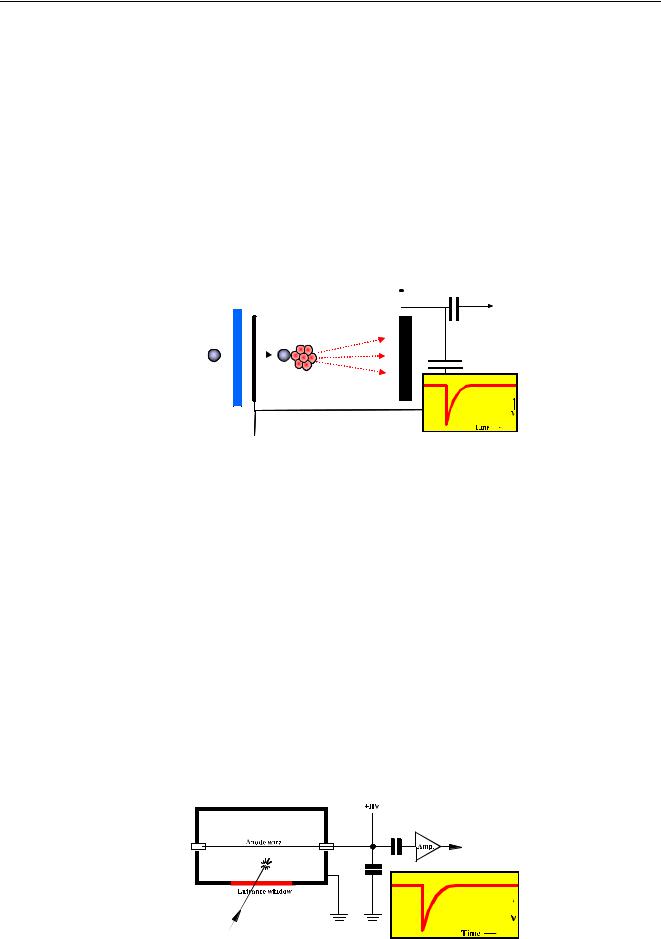
4.7.2. Gas filled detector
Figure 30 shows the basic design of a gas-filled detector. It is constructed from a metal (often aluminium) cylinder at earth potential with a co-axial 50-m tungsten anode wire running down its length. The anode wire is raised to a high voltage (1300 - 2000 V). A Beryllium entrance window allows X-ray photons to enter the detector, which is filled with an inert counting gas (Ne, Ar, Kr or Xe, and occasionally He).
Figure 30 Basic design of a gas filled detector
page: 23 |
DYF-000000 / version 0.1 |

Principles of X-ray Fluorescence
When an X-ray photon enters the detector it creates a small cloud of electrons, which are attracted by the wire. When the electrons reach the wire they cause a drop in voltage. This is registered as a negative pulse in the amplifier. The number of electrons is proportional to the energy of the incoming radiation, and hence the height of the pulse. A Multi Channel Analyzer (MCA) counts the pulses produced by the detector
The Be-window must be thin to allow photons to enter the detector. If it becomes too thin, however, gas may penetrate through the window. The detector is therefore sometimes connected to an Ar gas bottle to replace the lost Ar. Such detectors are called flow detectors, and those with thicker windows to prevent gas from escaping are called sealed detectors.
4.7.3. Scintillation detector
Figure 31 shows the basic design of a scintillation detector. It consists of four main parts: a beryllium window, NaI scintillator crystal and a photo multiplier tube with Sb/Cs photo cathode.
Be Window |
|
|
|
Scintillator |
Photocathode |
Dynodes |
Anode |
crystal |
|
|
|
|
|
|
Figure 31 Basic design of a scintillation detector
X-ray photons pass through the beryllium window and hit the scintillator crystal, which produces a blue light flash. The light photons travel into the photo-multiplier tube and impact on the photo cathode producing a burst of electrons, which are accelerated through a series of dynodes to the anode. When the resulting electrons reach the anode they cause a drop in voltage. This is registered as a negative voltage pulse in the amplifier. The number of electrons is proportional to the energy of the incoming radiation, and hence the height of the pulse. A Multi Channel Analyzer (MCA) counts the pulses produced by the detector
4.8.Escape peaks and pile-up peaks.
Detectors suffer from two artefacts: escape peaks and pile-up peaks. The atoms in the detector (Ar, Si, Ge) will also emit their own characteristic radiation when hit by the incoming x-rays. Due to this, the incoming x-rays will lose a part of their energy, which is equivalent to the energy of the line of the detector element. For Si this is about 1.7 keV, for Ge 10keV and for Ar about 3 keV. Besides counting photons with the initial energy, the detector will also therefore count a fraction with a lower energy. In the spectrum this will result in two peaks: a main peak and an escape peak.
Pile-up or sum peaks are the result of 2 photons that enter the detector simultaneously. Both photons will produce a cloud of electrons, but they are detected as one large cloud. The energy detected is equivalent to the sum of the two initial energies. Figure 32 shows the production of escape and sum peaks in a Ge detector.
page: 24 |
DYF-000000 / version 0.1 |

Principles of X-ray Fluorescence
|
|
Ge K photon escapes |
|
|
|
+ |
MCA |
|
|
+ |
MCA |
Be Window |
Dead layer |
||
Be Window |
Dead layer |
|
|||||
|
Ge atom |
|
|
|
|
|
|
|
|
|
|
|
Photons |
|
|
|
Photon |
|
|
|
|
electrons |
|
|
|
|
|
|
|
|
- |
- |
Figure 32 Production of escape and sum peaks
Pile up peaks and escape peaks appearing in the spectrum can interfere with other peaks, or lead to wrong conclusions about the elements present in the sample.
4.9.Comparison of different detectors
The resolution of gas-filled and scintillation detectors is very poor, and they are not suited for energy dispersive spectrometers. They can however be used in wavelength dispersive spectrometers, because in these instruments the resolution is achieved by the diffraction crystal. The sensitivity depends on the type of detector and on the energy of the incoming x-rays. Gasfilled detectors have a high sensitivity for low energies and a low sensitivity for high energies and are so best suited to detect lower energies. The opposite applies for scintillation detectors, which are better suited for high energies than low energies. Solid-state detectors in general have a very low sensitivity for low energies and high resolution for the higher energies. EDXRF spectrometers commonly use solid-state detectors, while WD-XRF spectrometers use a combination of gas-filled and scintillation detectors.
4.10. Filters
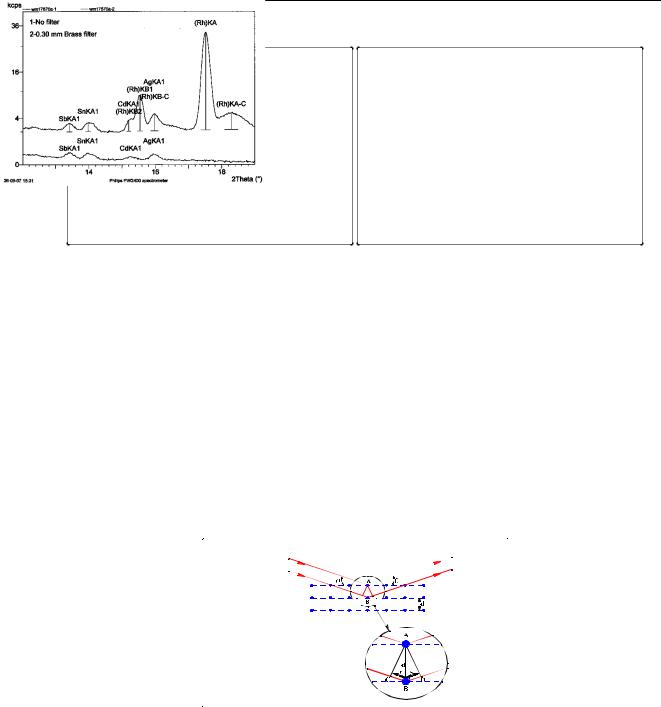
Filters are placed between source and sample. They reduce the intensity of interfering lines and background, and hence improve the signal-to-noise ratio. In 2D optics, a fraction of the scattered tube spectrum reaches the detector and will be present in the measured spectrum. In some cases the tube lines of the spectrum interfere with lines coming from the sample (for example, the Rh K lines coming from the tube can interfere with the Ag and Cd K lines coming from the sample). By mounting a filter between tube and sample, the tube lines are absorbed and the lines coming from the sample are not. An example of a spectrum is given in Figure 33 (left).
Figure 33 (right) shows that the background radiation can be reduced more than the analytical lines. Then, the analytical lines can be determined with higher precision, and with lower detection limits. Commonly used filter materials are Aluminium and Brass with a thickness between 100 and 1000 µm, depending on the tube lines that have to be filtered out.
page: 25 |
DYF-000000 / version 0.1 |
Principles of X-ray Fluorescence
Figure 33 Filter used to filter tube lines and background
If the intensity is too high for the detector and this becomes saturated, a filter can absorb part of the radiation to prevent saturation.
4.11. Diffraction Crystals and collimators
A crystal can be seen as a stack of thin layers all having the same thickness, as shown in Figure 34. If a parallel beam of x-rays falls on the crystal, the first layer reflects a fraction of the x- rays. The remaining radiation penetrates the crystal and is reflected by the subsequent layers. If the difference in path length between reflections from layers is a multiple of half the wavelength of the radiation, the two reflected beams vanish. If the difference is exactly an integer times the wavelength, the two reflected beams reinforce. The difference in path length is an integer times the wavelength if the following relation, called Bragg’s law, holds:
n λ = 2 d sin(θ )
Figure 34 Demonstration of Bragg's Law
At an angle θ, all reflected radiation with a wavelength λ and obeying Bragg’s law are ‘in phase’ and add up. All other wavelengths at the same angle will vanish.
A detector placed at angle θ can therefore measure the intensity of the corresponding wavelength. Reflected wavelengths obeying Bragg’s law for n=1 are called first-order reflections, for n=2 second-order etc. Note that at a specific angle, radiation will be visible with wavelength λ, λ/2 and λ/3, but the detector’s resolution can distinguish between them.
At any specific angle, only radiation with a wavelength obeying Bragg’s law is reflected. Radiation with slightly different wavelengths will be reflected at slightly different angles, but will still reach the detector and will interfere with the energy to be measured. A collimator, which is a set of parallel plates, is used to obtain a parallel x-ray beam that falls exactly at the
page: 26 |
DYF-000000 / version 0.1 |

Principles of X-ray Fluorescence
required angle on the crystal. The primary collimator is placed between the sample and crystal, and a secondary collimator can be placed between the crystal and detector.
4.12.Masks
A mask is a plate with a hole in it. The tube irradiates the sample, but also the cup in which the sample is placed. This cup will also emit its characteristic radiation, but must not reach the detector or it will interfere with the radiation coming from the sample. A mask is placed between the sample and the detection system so that the detector ‘sees’ only the sample.
4.13. Spinner
Samples are not always perfectly homogeneous, and scratches on the surface may also influence measurements. A spinner rotates the sample during the measurement to even out effects of non-homogeneity and scratches.
4.14.Vacuum and Helium system
The source, sample and detection system are mounted in a vacuum chamber. Air will absorb tube radiation, especially low-energy radiation. This would make analysis of light elements impossible since all x-rays would be absorbed by air and not reach the detector. Liquids and wet powders cannot be measured in vacuum because they would evaporate. These types of sample are usually measured in a Helium filled spectrometer. Helium absorbs the radiation of the light elements, up to about Fluorine, so it is not possible to measure these elements in liquids. Helium does not however affect the radiation from heavier elements.
page: 27 |
DYF-000000 / version 0.1 |

Principles of X-ray Fluorescence
5.XRF analysis
A good analysis starts with a well-prepared sample and a good measurement. This section describes how different sample types are prepared, and how they are measured accurately.
After a sample is measured, it is analyzed. This is done in two steps: Qualitative analysis followed by Quantitative analysis. Qualitative analysis determines which elements are present and their net intensities from the measured spectra. In many routine situations, the elements in the sample are known and only the net intensities need to be determined. The net intensities are used in the Quantitative analysis to calculate the concentrations of the elements present.
ED-XRF and WD-XRF often use slightly different methods for Qualitative analysis. In EDXRF the area of a peak gives the intensity while in WD-XRF the height of the peak gives the intensity. Both methods would work for ED-XRF and WD-XRF, but both have their specific advantages and disadvantages.
5.1.Sample preparation.
Often, only a small sample of material is analyzed, for instance in a steel plant a small disk represents the full furnace contents. The sample must be representative of the entire material, and so must be taken very carefully. Once taken, it must also be handled carefully. The sensitivity of modern spectrometers is so high that they even detect fingerprints, which can disturb the analysis. Another basic requirement is that a sample be homogeneous. Spectrometers only analyze the sample’s surface layer, so it must be representative of the whole sample.
Most spectrometers are designed to measure samples that are circular disks with a radius between 5 and 50 mm. The sample is placed in a cup, and the cup is placed in the spectrometer. Special supporting films allow the measurement of loose powders and liquids. Different sample types are discussed below.
5.1.1. Solids
Solids require only a minimum of sample preparation. In many cases, cleaning and polishing is sufficient. Metals may oxidize when exposed to air, so they are often ground or polished before they are measured to remove the rust.
5.1.2. Powders
Powders can be placed on a supporting film and measured directly. Another technique is to press them under very high pressures (20.000 kg) into a tablet. A binding material is sometimes added to improve the quality of the tablet. The tablet is then measured and analyzed. If a binding material is used, this has to be taken into account in the analysis because it does not belong to the initial sample. Care should be taken that the sample is homogeneous.
5.1.3. Beads
Powder together with a binding additive called flux can also be melted (1000 o -1200 oC) into a glass sample called a bead. This sample is homogenous and can be measured directly. Because of the melting process, a part of the sample can evaporate as H2O or CO2 so the sample loses part of its contents. Elements like S, Hg and Cd are also candidates for leaving the sample when heated. This loss is called Loss On Ignition (LOI).
page: 28 |
DYF-000000 / version 0.1 |

Principles of X-ray Fluorescence
Weighing the sample before and after the fusion helps determine the total LOI. The analysis should take into account the flux used and the LOI. Flux materials mostly contain light elements like Li2B4O7, so they cannot be measured. To correct for this, the analyst must take account of which and how many flux materials are being used.
5.1.4. Liquids
Liquids are poured into special cups with supporting films. Diluents are sometimes added to obtain sufficient liquid. Liquids cannot be measured in vacuum because they would evaporate; measuring in air is possible, but the air absorbs much of the radiation and makes it impossible to measure light elements. The spectrometer chamber is therefore filled with He gas – liquids will not evaporate and hardly any radiation is absorbed.
5.1.5. Material on Filters
Filters used to filter air or liquid can be analyzed using XRF. The filter contains only a very small amount of the material to be analyzed. Filters do not require specific sample preparation and can be analyzed directly.
5.2.XRF measurements
XRF is a very sensitive technique and samples must be clean. Even fingerprints on a sample can affect the result of the analysis. For accurate results, the spectrometer (for example, the kV settings of the tube or the detector settings) is tuned to the elements to be analyzed. Bad settings can lead to poor results. In ED-XRF a whole spectrum is measured simultaneously and the area of a peak profile determines the concentration of an element. Measuring the height of the peak profile is an alternative, but a lot of information would be lost, because the area of a peak profile is less sensitive for noise than the height of the same peak. In WD-XRF it is common practice to measure only at the top of the peak profile. The positions of the peaks are known and measuring at the top position only gives the best accuracy and lowest measuring time.
5.2.1. Optimum measurement conditions.
‘Optimum’ can be defined in many different ways, and the definition depends on the criteria used. The criteria can be highest intensity, lowest background, minimum line overlap and many others. A high intensity and low background have the advantage that lines can be detected and measured accurately and quickly. Minimum line overlap has the advantage that the intensity of the lines can be determined directly, without sophisticated mathematical techniques. Weak lines can also be difficult to detect on the tails of strong lines.
The maximum intensity of a line is achieved if the energy of the incoming radiation is just above the absorption edge of that line. In WD-XRF systems and ED-XRF systems with direct excitation, this can be done by applying a voltage to the tube so that the largest part of the tube spectrum (continuum or tube line) has an energy just above the absorption edge of the analytical line.
In ED-XRF systems using secondary targets, it is done by using a target that has a fluorescent line with an energy just above the absorption edge of the analytical line. The voltage applied to the tube is such that the spectrum of the tube excites the element(s) in the target optimally, according to the same principles described for WD-XRF systems. If no such target is available, a Barkla target is used to scatter the total tube spectrum. The tube voltage is selected so that the largest part of the tube spectrum has an energy just above the absorption edge of the analytical line.
page: 29 |
DYF-000000 / version 0.1 |

Principles of X-ray Fluorescence
Line overlap occurs when the line of one element overlaps the line of another element. The interfering line can come from an element in the sample, but also from an element in the tube, crystal, secondary target, or any other component in the optical path.
High resolution and/or dispersion achieve Minimum line overlap. In WD-XRF spectrometers the crystal and collimator have a large effect on the line overlap, which can be minimized by selecting the proper crystal and collimator. In ED-XRF spectrometers, the detector and MCA settings have a large effect on the resolution and must be selected carefully. In some cases it is also worth measuring a weaker line of an element if a strong line is overlapped and the weaker line is not. For spectrometers using secondary targets, the selection of the proper target is essential. Scattered target lines can interfere with the lines of the sample so selecting the target that gives the lowest interference is advisable. Using a target the only excites the elements of interest and not elements that give interfering lines helps to reduce the line overlap.
5.3.Qualitative Analysis in ED-XRF
The first step in the analysis is to determine the top positions and the areas of the line profiles. The positions of the tops represent the presence of elements and the areas represent the intensities of the lines. Where the elements in a sample are known a-priori, only the intensities need to be determined. The Quantitative analyses require net intensities, meaning that the background must be subtracted from the spectrum.
5.3.1. Peak Search and Peak Match
Peak Search and Peak Match are used to find which elements are present in the sample. Peak Search uses a mathematical technique to find the peaks in a spectrum. Peak Match determines the elements to which the peak profiles belong. This is done by comparing the positions of the peaks to a database holding the positions of all possible lines.
5.3.2. Deconvolution and background fitting
Figure 35 shows an example of a spectrum, with two peak profiles and a background. A spectrometer will measure the sum of the background and the profiles. In this example, the profiles don’t overlap and the area of both can be determined without problems.
12 |
|
|
|
|
|
10 |
|
|
|
|
|
8 |
|
|
|
|
|
6 |
|
|
|
|
|
4 |
|
|
|
|
|
2 |
|
|
|
|
|
0 |
|
|
|
|
|
20 |
22 |
24 |
26 |
28 |
30 |
Figure 35 A spectrum with two peak profiles on a background
In other cases, peak profiles can overlap as shown in Figure 36.
page: 30 |
DYF-000000 / version 0.1 |