

ECHO 2013 / Contrast for Diagnosis and Therapy
.pdfBubble Destruction and Wash-In
Quantification of Myocardial Perfusion
Exponential Wash-In Curve
Dusa, et al. Circulation 2000;102(18)II-471
Contrast12:31
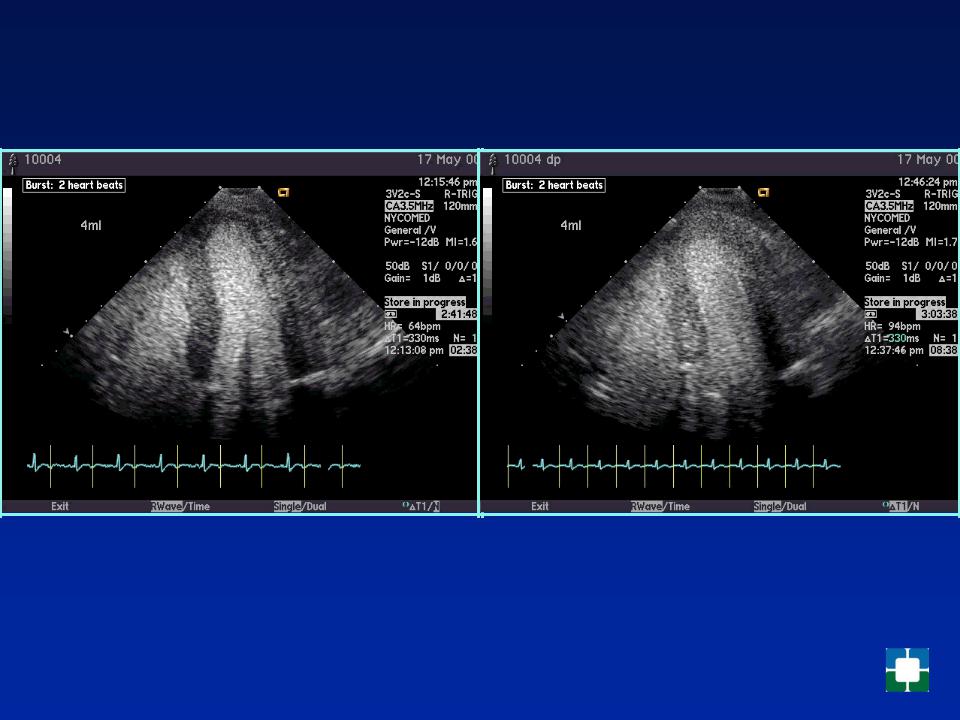
Bubble Destruction and Wash-in
Apical 4-Chamber View
Pre-Dipyridamole Post-Dipyridamole
Normal wash-in at rest, improved with dipyridamole
Contrast12:32
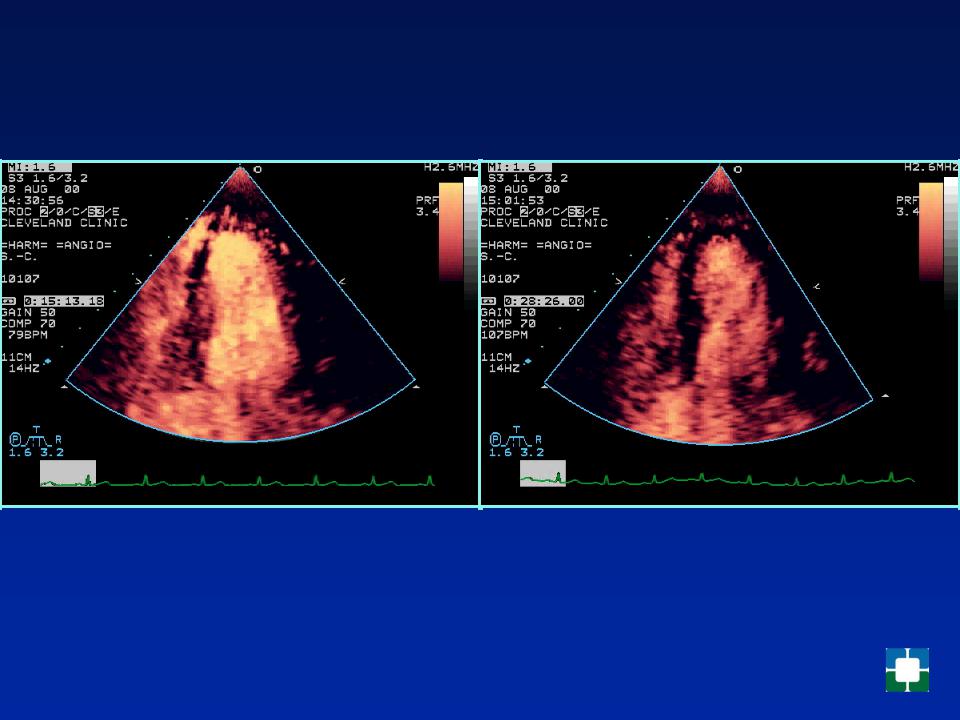
Bubble Destruction and Wash-in
Apical 4-Chamber View, Pre and Post Dipyridamole Harmonic Power Doppler Triggered Mode
Pre-Dipyridamole Post-Dipyridamole
Apical (LAD) reversible defect
Contrast12:33
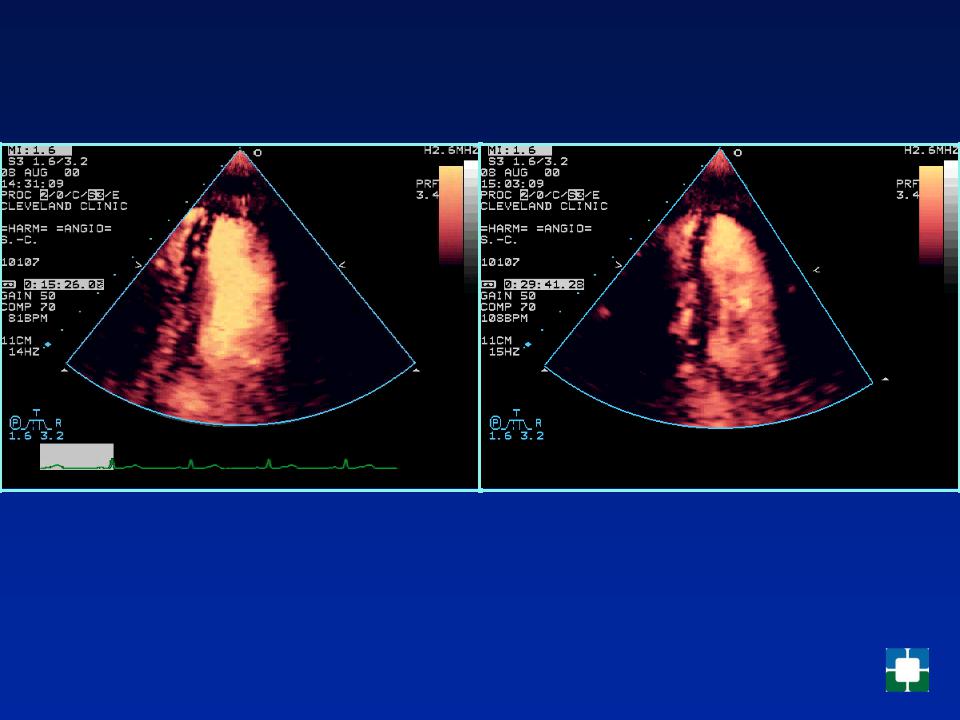
Bubble Destruction and Wash-in
Apical 2-Chamber View, Pre and Post Dipyridamole Harmonic Power Doppler Triggered Mode
Pre-Dipyridamole Post-Dipyridamole
Apical (LAD) reversible defect
Contrast12:34
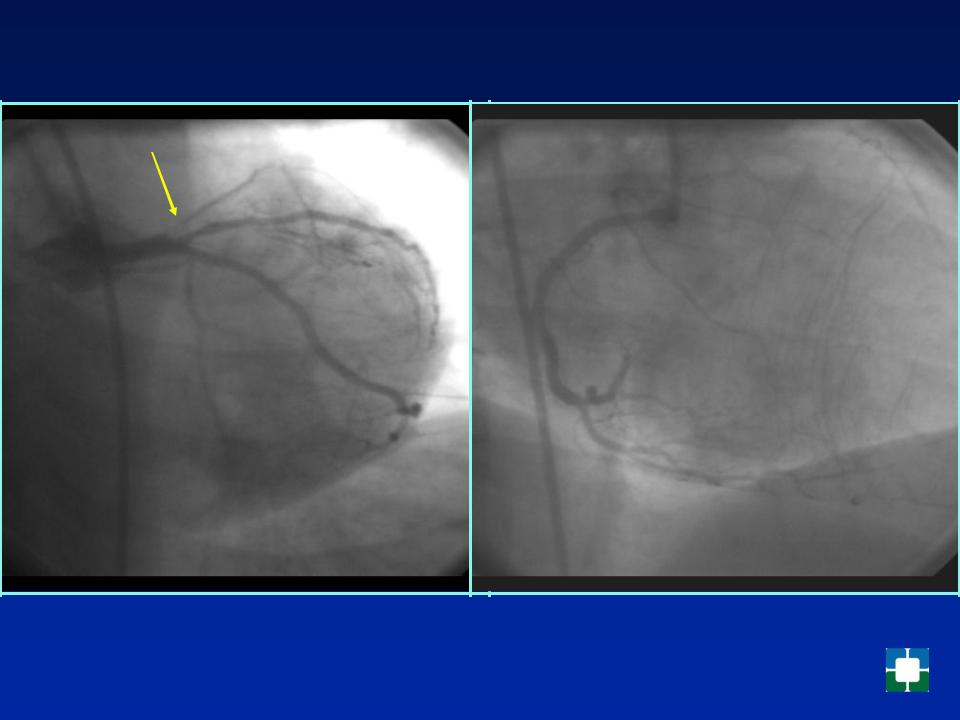
Coronary Angiography
LCA |
RCA |
Subtotaled proximal LAD |
Collaterals to LAD |
Contrast12:35
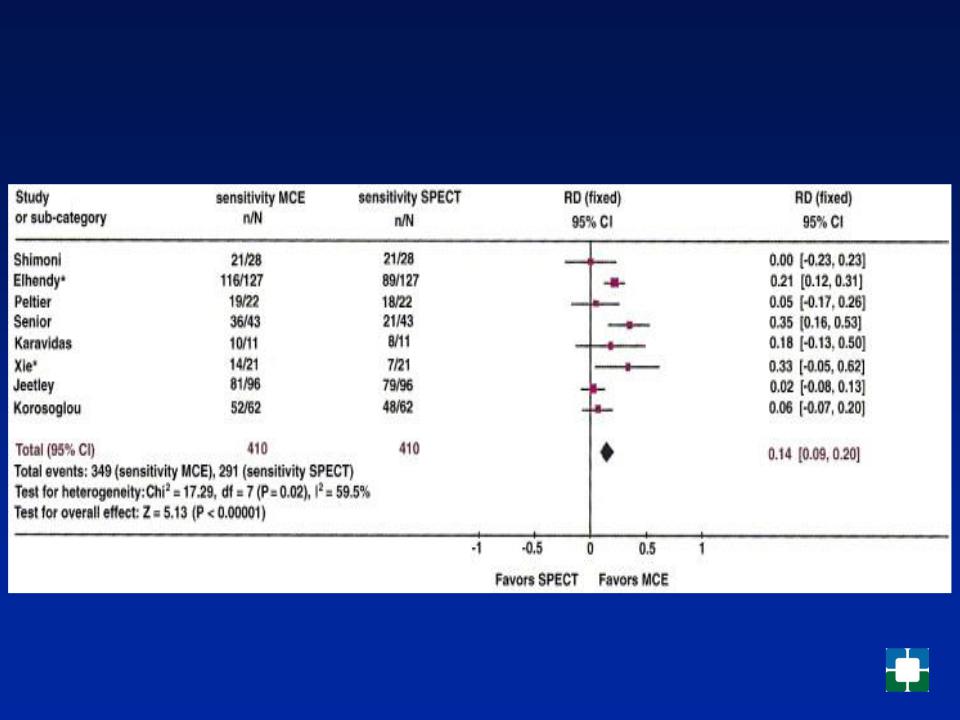
Meta-Analysis: MPE vs SPECT
Significantly Better Sensitivity
Dijkmans, et al, JACC 2006 |
Contrast12:36 |

So Why Isn’t Contrast Used for Perfusion?
In 2013, No Agents are Approved for Use
•Two large development efforts (Point Biomedical and Acusphere) came to naught
–Point: Disappointing results from Phase III trial lead to nonapprovable letter from FDA and loss of funding.
–Acusphere: Poor reproducibility of interpretations lead to FDA panel rejection (16-1). Currently attempting another trial and pursuing approval in Europe.
•Bracco has completed largest perfusion trial to date
–630 patients at 34 centers enrolled, 516 having MCE, SPECT, and cath
–For 70% stenosis, MCE vs SPECT showed
»Sensitivity: 75.2% vs 49.1% (p<0.0001)
»Specificity: 52.4% vs 80.6 (p<0.0001)
»Accuracy: 59.5% vs. 70.7%, (p<0.0001)
–Poor reproducibility: = 0.37 (MCE) and 0.34 (SPECT)
Senior et al. AHA 2012 abstract presentation |
Contrast12:37 |
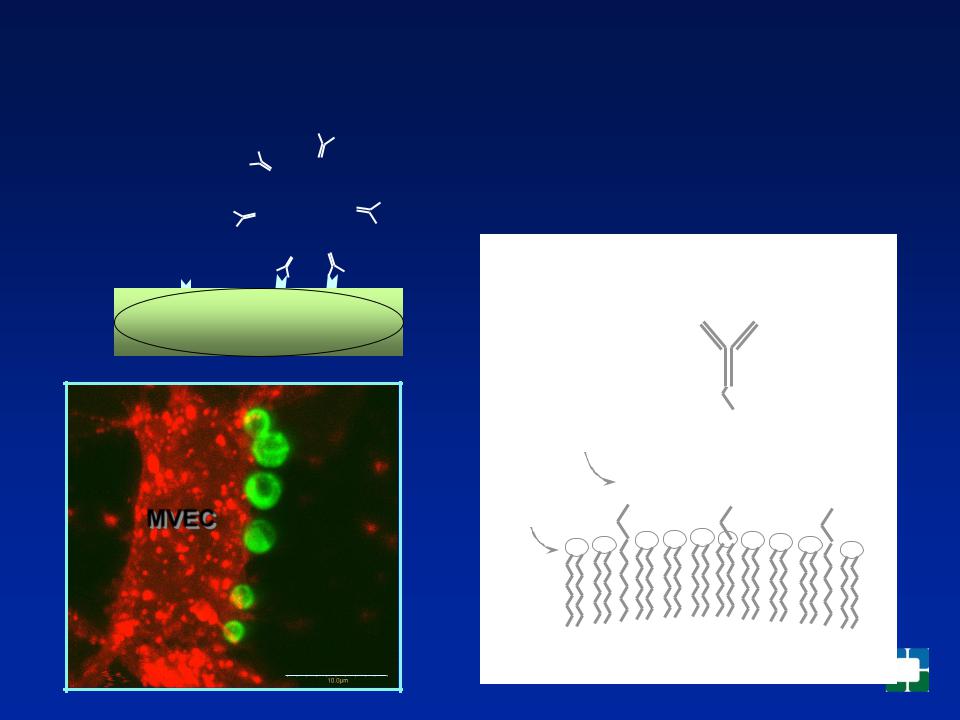
Molecular Imaging
Microbubble Targeting by Surface Ligand Conjugation
Endothelium
MVEC
mAb or other ligand
PEG |
40 |
70 |
40 |
stearate |
O-) |
O-) |
O-) |
|
2 |
2 |
2 |
|
CH |
CH |
CH |
|
2 |
2 |
2 |
DSPC |
(CH |
(CH |
(CH |
|
|
|
dFB gas core
Lankford M, et al., Investig Radiol 2006 |
Contrast12:38 |
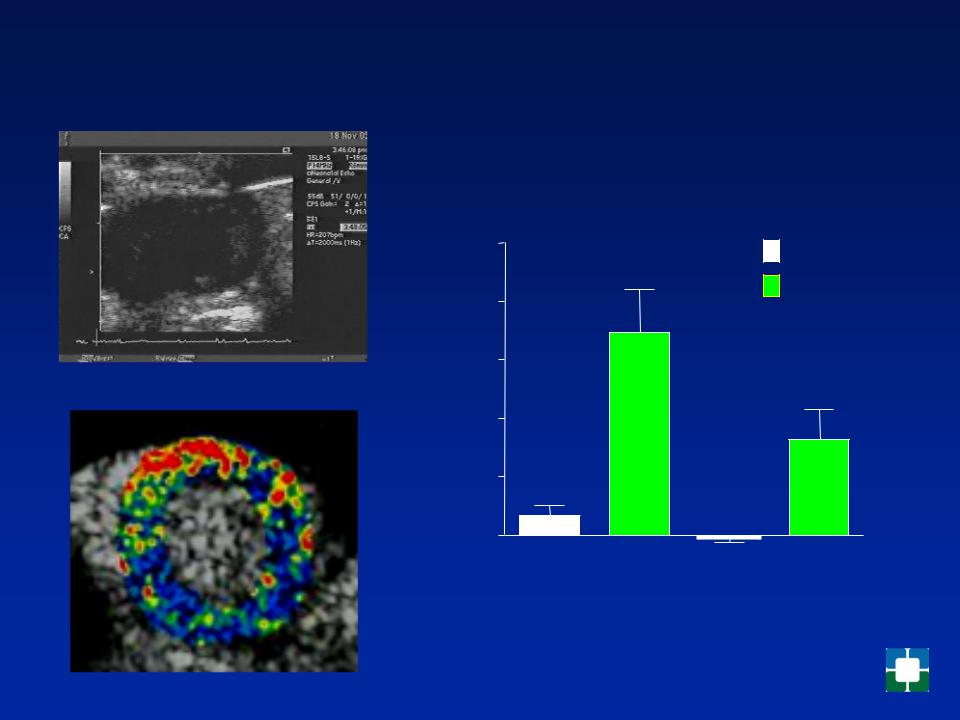
Selectin Targeted MB Retention in Post-ischemia
Perfusion Imaging (Occlusion)
P-selectin (45 min reflow)
Acoustic intensity
2.5 |
*† |
MBc |
|
2.0 |
MBp |
|
1.5
*
1.0
0.5
0.0
Anterior Posterior
Kaufmann BA. Eur Heart J 2007;28:2011
Slide courtesy of Jonathan Lindner Contrast12:39
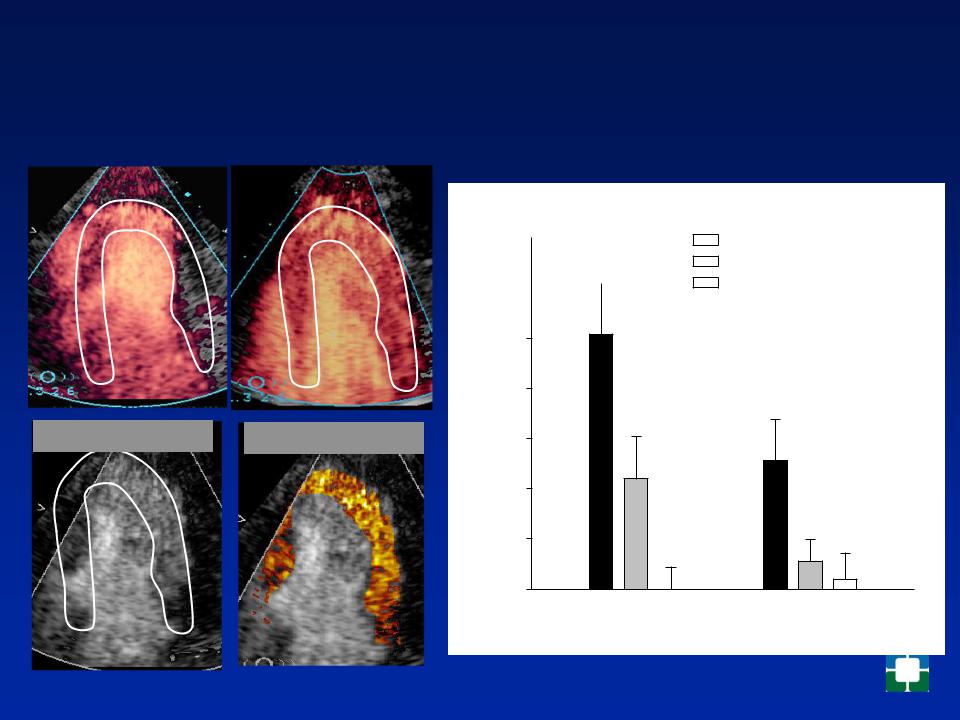
Selectin Targeted MB Retention in Post-ischemic
Myocardium: Non-human Primate
Ischemia |
|
Reflow (45 min) |
MBP-selectin |
MBP-selectin |
35 |
|
|
|
|
|
Ischemic - Risk Area |
|
|
|
|
|
||
|
|
|
||||
|
|
|
|
|
||
|
* |
|
|
Ischemic - Control Area |
||
|
|
|
||||
|
|
|
||||
30 |
|
|
Non-ischemic Control |
|||
|
|
|
|
|
||
|
|
|
||||
|
|
|
|
|
|
|
Intensity |
25 |
|
|
20 |
|
* |
|
|
|
||
Acoustic |
|
† |
|
|
|
||
15 |
|
|
|
10 |
|
|
|
|
|
|
|
|
5 |
|
|
|
0 |
|
|
30 min 90 min Time After Reflow
Slide courtesy of Jonathan Lindner |
Contrast12:40 |