

ECHO 2013 / Heart Failure The Growing Epidemic
.pdfPrevalence is increasing
•No decrease in incidence
•Better Survival
•Aging of the population
•Increase in risk factors for HF
•AHA 1-2 million Americans w HF in 1971-1975 vs 5.2 million Americans w
HF in 2004


Prevalence of HF by Sex and Age 2003-2006 NHANES
WRITING GROUP MEMBERS et al. Circulation 2010;121:e46-e215
Copyright © American Heart Association

The Greying of America
•US Census Bureau
•By 2030 all baby boomers > age 65 yrs with 1 in 5 Americans > age 65
•2008 US citizens > 65yrs: 38.7 million
•2050 US citizens >65yrs: 88.5 million

Prevalence of self-reported HF by age group and sex: United States, 1999.
Ni et al Am Heart J 2003;146:121-8
Heart Failure Prevalence
Trends in the Elderly Curtis Archives 2008
Prevalence
Rates per 1000 eligible Medicare beneficiaries
Year |
Female |
Male |
Total |
1994 |
86.3 |
95.4 |
89.9 |
1995 |
94 |
103.7 |
97.9 |
1996 |
100.4 |
110.4 |
104.4 |
1997 |
105.6 |
117.1 |
110.3 |
1998 |
109.7 |
122.6 |
114.9 |
1999 |
112.4 |
125.6 |
117.8 |
2000 |
114.4 |
127.9 |
119.9 |
2001 |
114.4 |
128.3 |
120.1 |
2002 |
114.6 |
128.2 |
120.2 |
2003 |
115.1 |
129.2 |
121.0 |

Deaths From Congestive Heart
Failure in the US, 1968-2000
Deaths (thousands)
50
40
30
20
10
0 |
|
|
|
|
|
|
|
1965 |
1970 |
1975 |
1980 |
1985 |
1990 |
1995 |
2000 |
Year
National Heart, Lung, and Blood Institute. Disease statistics. In: NHLBI FY 2002 Fact Book. Bethesda, Md; 2002:35-54.

Outcomes
•Relative improvement in survival over time
•Absolute outcomes at the community level still shows close to 50% 5 yr mortality
•Mortality worse with increasing age and in black males

Mortality after onset HF by incidence yr & sex
at 30 days, 1 year, and 5 years
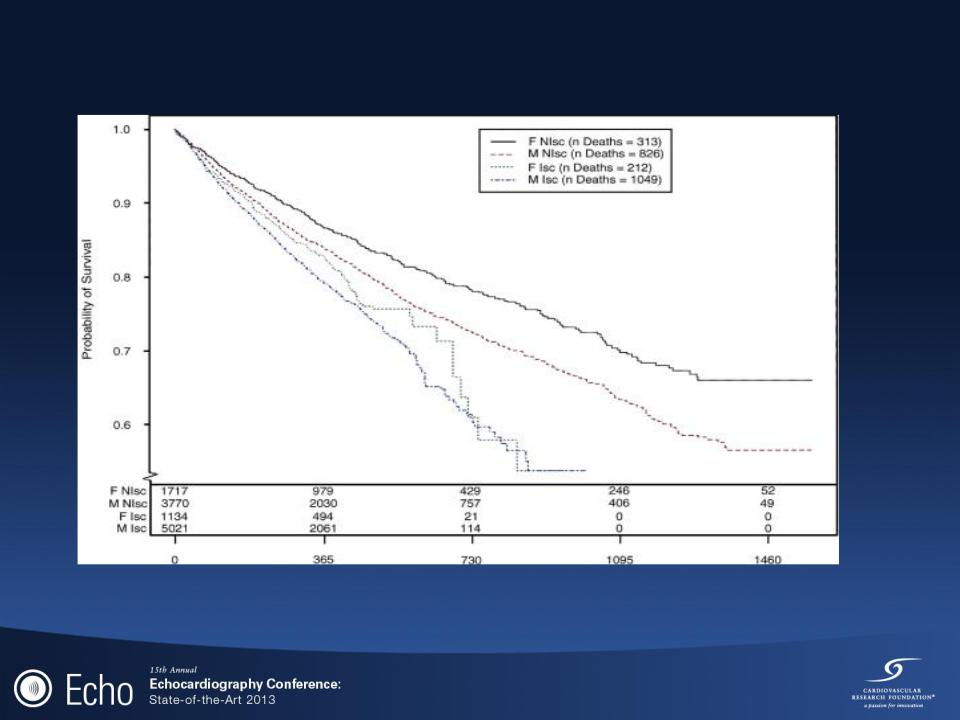
Survival by Etiology of HF and Gender
F-DCM
M-DCM
F-CAD
M-CAD
F = female; Isc = ischemic; M = male; NIsc = nonischemic.
Frazier et al JACC 2007,49;13:1450-1458