

НА_ПЕРЕВОД
.pdfsubject use All |
from downloaded content This |
|
and Terms JSTOR to |
Thu, on 11.58.242.92 |
1479 |
Conditions |
2015 Mar 12 |
|
|
AM 05:23:35 |
|
Finance, insurance, and real estate . . . . . . . . . . . . . . . . . . . . |
1.12 |
(.93, 1.35) |
1.04 |
(.94, |
1.15) |
1.05 |
(.60, 1.83) |
0.69* |
(.50, .95) |
Selected occupation controls (reference is professional/ |
|
|
|
|
|
|
|
|
|
managerial): |
|
|
|
|
|
|
|
|
|
Production/craft/repair . . . . . . . . . . . . . . . . . . . . . . . . . . . . . . . . . . |
4.82* |
(4.68, 4.96) |
6.78* |
(6.62, 6.95) |
4.09* (3.72, 4.50) |
5.92* |
(5.49, 6.39) |
||
Service occupations . . . . . . . . . . . . . . . . . . . . . . . . . . . . . . . . . . . . . . |
1.29* |
(1.26, 1.32) |
2.71* |
(2.65, 2.79) |
1.31* (1.22, 1.41) |
2.58* |
(2.38, 2.80) |
||
Weekly hours . . . . . . . . . . . . . . . . . . . . . . . . . . . . . . . . . . . . . . . . . . . . . |
1.01* |
(1.01, 1.01) |
.99* |
(.99, |
.99) |
1.00 |
(.99, 1.00) |
.98* |
(.98, .99) |
Region effects . . . . . . . . . . . . . . . . . . . . . . . . . . . . . . . . . . . . . . . . . . . . . . . |
|
No |
|
No |
|
|
Yes |
|
Yes |
State-grouping effects . . . . . . . . . . . . . . . . . . . . . . . . . . . . . . . . . . . . . . |
|
Yes |
|
Yes |
|
|
No |
|
No |
Metro effects . . . . . . . . . . . . . . . . . . . . . . . . . . . . . . . . . . . . . . . . . . . . . . . . |
|
Yes |
|
Yes |
|
|
Yes |
|
Yes |
Year effects . . . . . . . . . . . . . . . . . . . . . . . . . . . . . . . . . . . . . . . . . . . . . . . . . |
|
Yes |
|
Yes |
|
|
Yes |
|
Yes |
N . . . . . . . . . . . . . . . . . . . . . . . . . . . . . . . . . . . . . . . . . . . . . . . . . . . . . . . . . . . . . |
1,271,266 |
1,436,740 |
|
237,471 |
263,320 |
||||
Years covered . . . . . . . . . . . . . . . . . . . . . . . . . . . . . . . . . . . . . . . . . . . . . . . |
1973–2007 |
1973–2007 |
1983–2007 |
1983–2007 |
|||||
Number of parameters . . . . . . . . . . . . . . . . . . . . . . . . . . . . . . . . . . . . . |
|
83 |
|
83 |
|
|
51 |
|
51 |
McFadden’s R2 . . . . . . . . . . . . . . . . . . . . . . . . . . . . . . . . . . . . . . . . . . . . . |
|
.16 |
|
.23 |
|
|
.11 |
|
.18 |
|
|
|
|
|
|
|
|
|
|
NOTE.—95% confidence intervals are in parentheses. Data for the cross-sectional estimates come from the CPS-May/MORG files, 1973–2007. Data for the panel estimates come from the CPS-MORG matched files, 1985–2007. Models are weighted with the appropriate CPS weights. Odds ratios from suppressed covariates are available on request. Estimates are restricted to private-sector workers ages 16–64 with positive earnings and hours worked. See the data appendix for a full description of the data construction and model specifications.
* P ! .05.

American Journal of Sociology
forestry, and fishery industries. Among men, transportation workers have over seven times the odds of belonging to a union compared to their counterparts in agriculture, forestry, and fisheries. Occupation patterns odds of membership as well: female production/craft/repair workers have five times the odds of membership compared to professional and managerial workers, whereas males in those occupations have nearly seven times higher odds of unionization compared to professionals and managers. Yet despite these strong effects of labor market position, AfricanAmerican women have over twice the odds of belonging to a union than similarly situated whites. While the African-American estimate is not as large among men, it is still positive and significant. Other covariates operate in the expected directions.16
As the panel estimates reveal, disproportionately high African-Ameri- can unionization probabilities are not restricted to membership odds. Our CPS-MORG minipanel models indicate that black females have nearly two and a half times the odds of joining or remaining in a union within a single year compared to their otherwise similar white peers. Black males have one and a half times the odds of being union “attached” compared to white males. Combined, these results provide strong evidence that blacks’ overrepresentation in private-sector unions is not solely reducible to their concentration in highly unionized labor market positions. Instead, African-Americans’ high odds of membership and of union attachment provide evidence for our protectionist hypothesis: African-American overrepresentation in unionized jobs stems in part from the protections unions may provide against employer discrimination.17
16Additional analyses (not shown; available on request) reveal that racial differences in membership probabilities are lower in the South and in states with right-to-work laws. This may indicate impediments to unionization for blacks in areas where racial threat is most pronounced, consistent with prior research (Jacobs and Dixon 2010). However, unionization rates are much lower in the South than in other regions and in right-to-work states compared to states lacking such laws. The reduced racial differences in unionization probabilities in the South and among states with a right-to- work law, then, may simply reflect the fact that every group’s unionization rate runs low in these areas.
17Some research argues that unionized employers select on unmeasured skills when hiring from the union queue, thereby biasing estimations of union wage premiums and potentially biasing estimates of why certain workers are unionized in the first place (Robinson 1989; Card 1996). As a final robustness check on our unionization analysis, we utilize the National Longitudinal Study of Youth (NLSY), a panel data set that includes a measure of the Armed Forces Qualification Test (AFQT), commonly used as a proxy for productivity-enhancing skills. We model unionization controlling for AFQT and a host of other predictors and find results broadly comparable with our CPS analyses. See table A4 for details.
1480
This content downloaded from 92.242.58.11 on Thu, 12 Mar 2015 05:23:35 AM All use subject to JSTOR Terms and Conditions

Organized Labor and Racial Wage Inequality
Modeling Union Wage Premiums Using Cross-Sectional and
Longitudinal Data
The results from our models predicting membership and union attachment provide evidence consistent with a protectionist account of organized labor and African-Americans in modern America. What remains to be seen is whether unions actually offer African-Americans higher wage returns compared to white workers. Table 3 presents the results of our union wage premium models. The cross-sectional coefficients derive from a regression estimating log weekly wages for private-sector female and male workers. Coefficients marked with an asterisk indicate statistically significant estimates. Among women, the union main effect of .22 indicates that white union members earn, on average, approximately 25% more than otherwise similar nonunion private-sector workers.18 The AfricanAmerican main effect translates to a 7% wage penalty for black females averaged out over the 1973–2007 period. We include a set of union#race interaction terms to capture dissimilar effects of unions on wages for blacks and whites (coefficients from the other union#race interaction terms are not shown; available on request). The interaction coefficient indicates that despite their high odds of union membership, the wage benefits unions provide African-American females are no higher than those provided to white females. Indeed, the negative interaction effect suggests that blacks’ union wage premium is marginally lower than whites’. These basic patterns are replicated in the cross-sectional analysis of men. The union wage premium for whites is slightly higher at .25. The weekly wage deficit relative to whites is larger than the racial wage gap among women. The interaction coefficient indicates that African-Amer- ican men benefit from unionization a bit more than white men, although the effect is substantively small. Combined, the interaction terms for both men and women in the cross-sectional models reveal that unionization benefits blacks and whites similarly, despite the implications of the protectionist hypothesis.19 We return to this issue in the discussion and implications section.
18Since the coefficient represents logged weekly wages, e.22 p 1.25, or 25% higher wages than the reference group. This premium estimate is broadly comparable with prior research that utilizes the CPS to establish cross-sectional union wage premiums. For example, Hirsch and Schumacher (2004, table 4) estimate an average premium of .20 between 1973 and 2001 for both men and women. Blanchflower and Bryson (2004, table 2) report a female union wage premium of .22 between 1974 and 1979 and .13 between 1996 and 2001. Their models lack occupation controls, which leads to a depressed premium estimate. For a discussion about choice of controls when modeling union wage premiums, see Hirsch (2004, pp. 239–41).
19We also ran the cross-sectional premium model on individual survey years. Results indicate no clear time trend in the union#African-American interaction coefficient and are available on request.
1481
This content downloaded from 92.242.58.11 on Thu, 12 Mar 2015 05:23:35 AM All use subject to JSTOR Terms and Conditions

subject use All |
from downloaded content This |
|
and Terms JSTOR to |
Thu, on 11.58.242.92 |
1482 |
Conditions |
2015 Mar 12 |
|
|
AM 05:23:35 |
|
TABLE 3
ESTIMATES OF UNION WAGE EFFECTS FOR PRIVATE-SECTOR WORKERS, VARIOUS YEARS
|
|
|
|
|
|
PANEL ESTIMATES: OCCUPATION OR |
|||
|
CROSS-SECTIONAL ESTIMATES |
|
INDUSTRY CHANGE |
||||||
|
|
|
|
|
|
|
|
||
|
Women |
|
Men |
Women |
|
Men |
|||
|
|
(1) |
|
(2) |
|
|
(3) |
|
(4) |
|
|
|
|
|
|
|
|
|
|
Union main effect . . . . . . . . . . . . . . . . . . . . . . . . . . . . . . . . . . . . . . . . . . . . . . . . . . . . . . |
.22* |
(.21, .22) |
.25* |
(.24, .25) |
|
.15* |
(.11, .19) |
.16* |
(.13, .19) |
African-American main effect (reference is white) . . . . . . . . . . . . . . . . . . |
.07* |
( .07, .07) |
.16* |
( .16, .16) |
|
. . . |
|
. . . |
|
Union#African-American interaction effect . . . . . . . . . . . . . . . . . . . . . . . . |
.01* |
( .02, .00) |
.02* |
(.01, .02) |
|
.05 |
( .12, .03) |
.08* |
( .15, .01) |
Other demographic and labor market position controls: |
.13* |
( .13, .12) |
.19* |
( .19, .18) |
|
|
|
|
|
Hispanic main effect . . . . . . . . . . . . . . . . . . . . . . . . . . . . . . . . . . . . . . . . . . . . . . . . |
|
. . . |
|
. . . |
|||||
Other race main effect . . . . . . . . . . . . . . . . . . . . . . . . . . . . . . . . . . . . . . . . . . . . . . |
.06* |
( .06, .05) |
.11* |
( .11, .10) |
|
. . . |
|
. . . |
|
Married . . . . . . . . . . . . . . . . . . . . . . . . . . . . . . . . . . . . . . . . . . . . . . . . . . . . . . . . . . . . . . . |
.03* |
(.03, .03) |
.14* |
(.14, .14) |
|
.01 |
( .04, .02) |
.01 |
( .08, .04) |
Potential experience . . . . . . . . . . . . . . . . . . . . . . . . . . . . . . . . . . . . . . . . . . . . . . . . . |
.02* |
(.02, .02) |
.04* |
(.04, .04) |
|
.00 |
( .02, .01) |
.02* |
(.00, .03) |
Potential experience2 . . . . . . . . . . . . . . . . . . . . . . . . . . . . . . . . . . . . . . . . . . . . . . . . |
.00* |
( .00, .00) |
.00* |
( .00, .00) |
.00* |
( .00, .00) |
.00* |
( .00, .00) |
|
High school (reference is ! high school) . . . . . . . . . . . . . . . . . . . . . . . . . . . |
.15* |
(.15, .15) |
.19* |
(.19, .19) |
|
.07* |
(.04, .10) |
.10* |
(.07, .13) |
Some college . . . . . . . . . . . . . . . . . . . . . . . . . . . . . . . . . . . . . . . . . . . . . . . . . . . . . . . . . |
.26* |
(.26, .27) |
.29* |
(.29, .30) |
|
.06* |
(.02, .10) |
.09* |
(.05, .13) |
College degree or higher . . . . . . . . . . . . . . . . . . . . . . . . . . . . . . . . . . . . . . . . . . . . |
.47* |
(.47, .47) |
.57* |
(.57, .57) |
|
.15* |
(.08, .22) |
.15* |
(.09, .21) |

subject use All |
from downloaded content This |
|
and Terms JSTOR to |
Thu, on 11.58.242.92 |
1483 |
Conditions |
2015 Mar 12 |
|
|
AM 05:23:35 |
|
Selected industry controls (reference is agriculture/forestry/ |
|
|
|
|
|
|
|
|
fisheries): |
|
|
|
|
|
( .04, .06) |
|
|
Transportation . . . . . . . . . . . . . . . . . . . . . . . . . . . . . . . . . . . . . . . . . . . . . . . . . . . . . . . |
.20* |
(.18, .21) |
.17* |
(.17, .18) |
.01 |
.08* |
(.04, .11) |
|
Manufacturing durables . . . . . . . . . . . . . . . . . . . . . . . . . . . . . . . . . . . . . . . . . . . . |
.25* |
(.24, .26) |
.25* |
(.24, .26) |
.05* |
(.01, .09) |
.08* |
(.05, .11) |
Finance, insurance and real estate . . . . . . . . . . . . . . . . . . . . . . . . . . . . . . . . . |
.20* |
(.19, .21) |
.26* |
(.25, .27) |
.05* |
(.01, .10) |
.06* |
(.01, .10) |
Selected occupation controls (reference is professional/ |
|
|
|
|
|
|
|
|
managerial): |
.32* |
( .32, .32) |
.27* |
( .27, .27) |
.03* |
( .04, .02) |
.02* |
( .03, .01) |
Production/craft/repair . . . . . . . . . . . . . . . . . . . . . . . . . . . . . . . . . . . . . . . . . . . . . . |
||||||||
Service occupations . . . . . . . . . . . . . . . . . . . . . . . . . . . . . . . . . . . . . . . . . . . . . . . . . . |
.23* |
( .23, .23) |
.26* |
( .26, .26) |
.03* |
( .04, .03) |
.03* |
( .04, .02) |
Weekly hours . . . . . . . . . . . . . . . . . . . . . . . . . . . . . . . . . . . . . . . . . . . . . . . . . . . . . . . . . . . |
.04* |
(.04, .04) |
.03* |
(.03, .03) |
.04* |
(.04, .04) |
.03* |
(.03, .03) |
Region effects . . . . . . . . . . . . . . . . . . . . . . . . . . . . . . . . . . . . . . . . . . . . . . . . . . . . . . . . . . . |
No |
No |
Yes |
Yes |
State-grouping effects . . . . . . . . . . . . . . . . . . . . . . . . . . . . . . . . . . . . . . . . . . . . . . . . . . |
Yes |
Yes |
No |
No |
Metro effects . . . . . . . . . . . . . . . . . . . . . . . . . . . . . . . . . . . . . . . . . . . . . . . . . . . . . . . . . . . . |
Yes |
Yes |
No |
No |
Year effects . . . . . . . . . . . . . . . . . . . . . . . . . . . . . . . . . . . . . . . . . . . . . . . . . . . . . . . . . . . . . |
Yes |
Yes |
Yes |
Yes |
N . . . . . . . . . . . . . . . . . . . . . . . . . . . . . . . . . . . . . . . . . . . . . . . . . . . . . . . . . . . . . . . . . . . . . . . . . |
1,271,266 |
1,436,740 |
105,256 |
137,542 |
Years covered . . . . . . . . . . . . . . . . . . . . . . . . . . . . . . . . . . . . . . . . . . . . . . . . . . . . . . . . . . . |
1973–2007 |
1973–2007 |
1983–2007 |
1983–2007 |
Number of parameters . . . . . . . . . . . . . . . . . . . . . . . . . . . . . . . . . . . . . . . . . . . . . . . . . |
86 |
86 |
48 |
48 |
R2 . . . . . . . . . . . . . . . . . . . . . . . . . . . . . . . . . . . . . . . . . . . . . . . . . . . . . . . . . . . . . . . . . . . . . . . . |
.70 |
.67 |
.89 |
.89 |
|
|
|
|
|
NOTE.—95% confidence intervals are in parentheses. Data for the cross-sectional estimates come from the CPS-May/MORG files, 1973–2007. Data for the panel estimates come from the CPS-MORG matched files, 1983–2007. Models are weighted with the appropriate CPS weights. Coefficients from suppressed control variables are available on request. Estimates are restricted to private-sector workers ages 16–64 with positive earnings and hours worked. Dependent variable in all models is logged weekly wages. Metro effects are excluded from the panels because of the sampling structure of the CPS. See the data appendix for a full description of the data construction and model specifications.
* P ! .05.

American Journal of Sociology
We supplement the cross-sectional premium estimates with models measuring individual-level change in union status. These panel models capture the effects of changing to a union job on wages over the course of a oneyear period for a subset of our CPS-MORG respondents not initially in a union. The other coefficient estimates in these models indicate the wage effect of a change over the course of a year: for example, the service occupation dummy estimates the average wage loss for respondents who move into a service occupation and the average wage gain associated with a move from a service occupation to other types of work. Time-invariant covariates, such as race main effects, are not estimated in models with individual fixed effects. A coefficient is estimated for the union#AfricanAmerican interaction term: while race is a time-invariant measure, the effect of joining a union is allowed to vary by race. In order to reduce measurement error in the union change estimates, we restrict our sample to those respondents who indicate an industry or occupation change.
The panel model for women estimates a union wage premium of .15 for whites (or a 16% wage premium), somewhat lower than our crosssectional estimate. The union#African-American interaction coefficient is negatively signed, although not statistically significant. The panel model for men also estimates a slightly lower union wage premium compared to the cross-sectional premium. And in contrast to the cross-sectional model, here we see a negative—and significant—union#African-Amer- ican interaction term. While black men’s absolute gains from unionization are substantial, their relative gains are not: among men who have changed industry or occupation, black men fare worse from their transition to a labor union compared to white men.
Estimating Deunionization’s Contribution to Black-White Wage Disparities
The union wage premium estimates presented in table 3 indicate that deunionization’s effect on the growth in black-white wage inequality operates through blacks’ concentration in unions, and not through any added advantage African-Americans receive for membership. Nevertheless, table 2 reveals substantially higher unionization odds for African-Americans, pointing to the possibility that dramatic private-sector union decline helped drive apart black and white wages in the closing decades of the 20th century, especially among women. In figure 4, we use the estimates generated from the cross-sectional premium model from table 3 to predict black-white wage disparities under two scenarios. First, we generate annual wage estimates for blacks and whites, allowing unionization to vary as it does in the data, and estimate the African-American wage penalty over time (our model-predicted wages). Second, we generate annual es-
1484
This content downloaded from 92.242.58.11 on Thu, 12 Mar 2015 05:23:35 AM All use subject to JSTOR Terms and Conditions
Organized Labor and Racial Wage Inequality
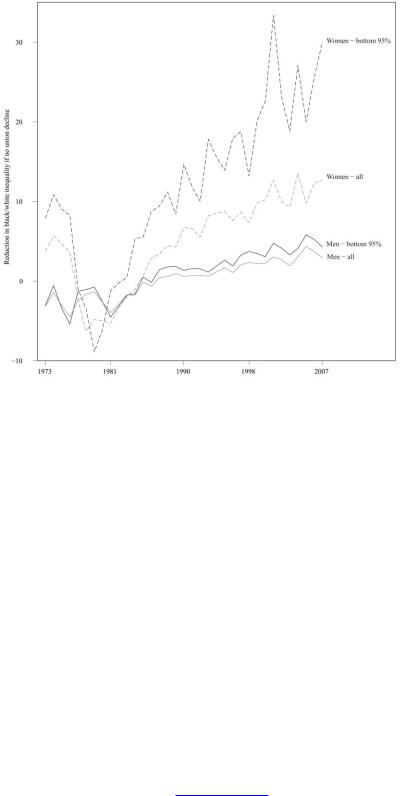
FIG. 4.—Counterfactual estimates of unionization and racial wage inequality in the private sector, 1973 2007. Data for 1973–81 come from the CPS-May files; data for 1983–2007 come from the CPS-MORG files. Estimates are based on the cross-sectional wage premium models presented in table 3. The inequality series was generated by subtracting the modelpredicted wage series from the fixed unionization series and dividing by the fixed unionization series. The y axis captures the percentage point reduction in inequality had no deunionization occurred. See the text and the data appendix for further details.
timates of black and white wages after fixing unionization at its 1979 race-specific levels for females and at its 1973 race-specific levels for males, and we estimate the black wage penalty under this alternative scenario (our counterfactual-predicted wages).20 We present the overall percentage reduction in black-white wage inequality had unionization in the private sector remained at its highest levels, calculated by subtracting the two series and dividing by the counterfactual-predicted series. Inequality es-
20 Except for white women, by 1990 all of our counterfactual wages are significantly higher than the model-predicted wage series in which union membership declines. A full set of these series are available on request.
1485
This content downloaded from 92.242.58.11 on Thu, 12 Mar 2015 05:23:35 AM All use subject to JSTOR Terms and Conditions

American Journal of Sociology
timates are highly sensitive to the inclusion of top earners in the sample, and with the exception of a few occupations, such as airline pilots, unionization rates among top earners are comparatively low, especially among men.21 For these reasons, we replicate our counterfactual procedure for the bottom 95% of wage earners and also present the corresponding reduction in inequality for these truncated samples.
Among women, deunionization has contributed greatly to growing racial wage disparities. By 2007, compared to our model-predicted series, black-white weekly wage gaps would be 13% lower barring private-sector union declines from 1979 onward. Within the truncated sample of female earners, the corresponding reduction reaches 30% in recent years. For example, in 2007, white workers’ wage advantage in our truncated sample was 6.8 percentage points; without union decline in the private sector, the difference would have been 5.3 points. Had 1979 unionization rates prevailed, overall inequality between black and white females would be approximately 28% lower than our model-predicted series.22 These inequality effects stem from the absolute gains unions provide AfricanAmerican females: in 2007, barring any private-sector deunionization, weekly wages for blacks would be $15 higher. For whites, wage levels would increase by only $6 a week.
What about private-sector men? Figure 4 reveals what we hypothesized previously: since unionization rates do not differ dramatically between white and black men for most of the period covered in our analysis, declining union rolls do not reduce black-white wage inequality all that appreciably. The counterfactual line for all male workers indicates that by the end of the series, union decline has exacerbated black-white inequality by about 3%–4%. Estimates using the truncated sample reveal an effect roughly twice the size. What these male inequality trend lines obscure, however, is deunionization’s impact on male wage levels. For black men in 2007, average weekly wages in our truncated sample would be approximately $49 higher had no union decline occurred. For full-time workers, that translates to an annual loss of income of over $2,500. White male workers also experience a similar weekly wage loss as a result of union decline, which blunts organized labor’s impact on black-white wage gaps.
21Of high-earning females belonging to a union, a disproportionate number are teachers and nurses, especially in the later years. We suspect that many of these are sector miscodes, further justifying the inclusion of the truncated samples.
22This is calculated by taking the difference between the fixed unionization wage gap (5.3) and model-predicted wage gap (6.8) and dividing by the fixed unionization wage gap (5.3).
1486
This content downloaded from 92.242.58.11 on Thu, 12 Mar 2015 05:23:35 AM All use subject to JSTOR Terms and Conditions

Organized Labor and Racial Wage Inequality
DISCUSSION AND IMPLICATIONS
The preceding analyses clarify contemporary relationships between organized labor and African-American workers and situate labor union decline within trends in and levels of black-white wage inequality. As table 2 reveals, black workers’ overrepresentation in labor unions stems from more than their concentration in those pockets of the private sector amenable to organization. Despite the strength of the positional covariates, African-American women have over twice the odds of belonging to a union, and black men have one and a half times the odds of belonging to a union than white men. Panel estimates measuring union attachment reveal an even greater interrace differential for women: blacks have nearly two and a half times the odds of belonging to or joining a union compared to their white peers, and black men have one and a half times the odds of being union “attached” compared to white men. The CPS lacks information on why individuals enter particular jobs or how respondents feel about unions, precluding a purely causal interpretation of our findings. Public opinion research includes some of this information and finds that blacks’ support of labor unions is higher than that of other groups (Freeman and Rogers 1999, p. 71). Historical work reveals a strong desire among many African-Americans for the bureaucratized, standardized routines of union employment (Lichtenstein 2002). Viewed alongside this other research, we believe that the results of our unionization analyses provide further evidence that black workers seek shelter against discrimination in the unorganized labor market, disconfirming a purely positional account of African-Americans and labor unions.
The high unionization probabilities and rates of union attachment mark a dramatic historical reversal, especially for black female workers. During the late 19th and early 20th centuries, increases in low-skill immigration and the resulting competition for jobs among native and foreign workers often led to violence against African-Americans, given their subordinate position in the economy and their nearly universal exclusion from protective institutions such as labor unions (Olzak 1989, p. 1239). And while many unions explicitly or through more indirect routes barred black men during the first upsurge of organized labor in the United States, AfricanAmerican men were at least eligible for employment in certain occupations sought after by immigrant and low-skill native white laborers. Whites effectively blocked African-American women from these occupations, consigning them largely to farming and domestic service (Glenn 1985). At the dawn of World War II, over half of all employed black women worked in domestic service (Aldridge 1999, table 11.1). Passage of the Wagner Act rested on the exclusion of these two occupations from the law’s reach,
1487
This content downloaded from 92.242.58.11 on Thu, 12 Mar 2015 05:23:35 AM All use subject to JSTOR Terms and Conditions

American Journal of Sociology
guaranteeing the continual subjugation of the female African-American workforce.
Continued racial and gender oppression thus doubly segregated black women, both from the employment niches offering any opportunity for economic advancement and from the key labor market institution situated between the employer and the employee. Rapid occupational ascent for African-American women followed in the 1960s and 1970s, stemming from the Civil Rights and women’s movement and the resulting legal pressure on employers. Lawsuits and the growing threat thereof also helped open up labor unions to black women. The impact of the social movements of the 1960s and 1970s did not end there: they also sparked a resurgence of worker activism as “militancy moved from the streets to the shop floors” (Isaac and Christiansen 2002, p. 741). While this influence was most pronounced among public-sector unions, the activism generated by the Civil Rights and women’s movements helped to organize “marginalized low-wage segments of the private sector” that were disproportionately female and African-American (Isaac, McDonald, and Lukasik 2006, p. 53). By the end of the 1970s, two in five black female privatesector workers in the Midwest and nearly one in four nationwide belonged to a labor union. After decades of struggle, African-American women joined African-American men in private-sector unions in unprecedented numbers.
But despite blacks’ overrepresentation in organized labor, unions fail to provide them any additional wage benefits compared to white workers (see table 3). In our panel estimates, black males actually receive less from joining a union than white males. One implication of protectionist theory is that unions provide higher relative returns to blacks: discrimination reduces African-American wages relative to whites in the nonunion sector, driving African-Americans into union jobs. The protection of union employment should then lead to higher relative wage benefits for blacks compared with whites, who face no comparable discrimination in nonunion settings.23 What accounts for this absence of an added benefit? Lack of direct measures of discrimination or other firm-level processes prevents definite conclusions, but one possible explanation knits together research detailing the organizational diversity within the American labor movement with the robust sociological literature on occupational and job devaluation. Historical studies document tremendous differences in orga-
23 This protectionist theory also implies higher racial wage disparities among nonunion workers than among their organized counterparts. In supplemental analyses (not shown; available on request), we model wages separately for union and nonunion workers. Results indicate much greater racial disparities among nonunionists until the very end of our series.
1488
This content downloaded from 92.242.58.11 on Thu, 12 Mar 2015 05:23:35 AM All use subject to JSTOR Terms and Conditions