

00b49525ec79ad0290000000
.pdfFigure 2: Percentage of firms at risk
The z-scores of all the firms in our sample are computed based on their last available full year accounts as at the end of September of each year from 1979 to 2003.
|
45 |
|
|
|
|
|
|
|
|
|
|
|
|
|
|
|
|
|
|
|
|
|
|
|
|
|
40 |
|
|
|
|
|
|
|
|
|
|
|
|
|
|
|
|
|
|
|
|
|
|
|
|
|
35 |
|
|
|
|
|
|
|
|
|
|
|
|
|
|
|
|
|
|
|
|
|
|
|
|
firms |
30 |
|
|
|
|
|
|
|
|
|
|
|
|
|
|
|
|
|
|
|
|
|
|
|
|
|
|
|
|
|
|
|
|
|
|
|
|
|
|
|
|
|
|
|
|
|
|
|
|
|
|
z-score |
25 |
|
|
|
|
|
|
|
|
|
|
|
|
|
|
|
|
|
|
|
|
|
|
|
|
|
|
|
|
|
|
|
|
|
|
|
|
|
|
|
|
|
|
|
|
|
|
|
|
|
|
of negative |
20 |
|
|
|
|
|
|
|
|
|
|
|
|
|
|
|
|
|
|
|
|
|
|
|
|
15 |
|
|
|
|
|
|
|
|
|
|
|
|
|
|
|
|
|
|
|
|
|
|
|
|
|
% |
|
|
|
|
|
|
|
|
|
|
|
|
|
|
|
|
|
|
|
|
|
|
|
|
|
|
|
|
|
|
|
|
|
|
|
|
|
|
|
|
|
|
|
|
|
|
|
|
|
|
|
|
10 |
|
|
|
|
|
|
|
|
|
|
|
|
|
|
|
|
|
|
|
|
|
|
|
|
|
5 |
|
|
|
|
|
|
|
|
|
|
|
|
|
|
|
|
|
|
|
|
|
|
|
|
|
0 |
|
|
|
|
|
|
|
|
|
|
|
|
|
|
|
|
|
|
|
|
|
|
|
|
|
1979 |
1980 |
1981 |
1982 |
1983 |
1984 |
1985 |
1986 |
1987 |
1988 |
1989 |
1990 |
1991 |
1992 |
1993 |
1994 |
1995 |
1996 |
1997 |
1998 |
1999 |
2000 |
2001 |
2002 |
2003 |
29
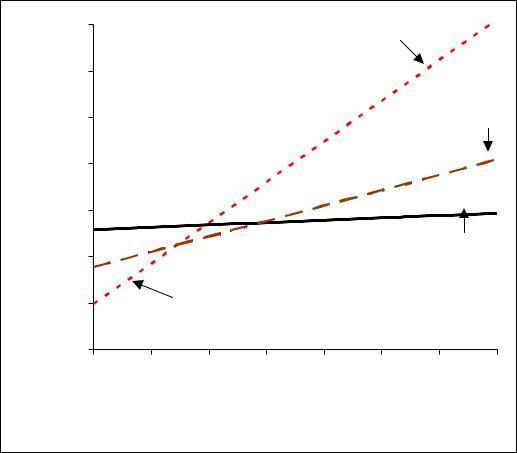
Figure 3: Expected costs of using different models
Z-scores and profit before tax (PBT) figures for all the firms in our sample are computed based on their last available full year accounts as at the end of September of each year from 1979 to 2003 (year t). Firms are then tracked for the next twelve months (to 30 September of year t+1) to identify those that failed. The z-score model classifies all firms with z<0 as potential failures, the PBT model classifies all firms with PBT<0 as potential failures, the proportional chance model randomly classifies firms as potentially failed/non-failed based on ex post determined probability of failure and the naïve model classifies all firms as nonfailures. The type I error rate represents the percentage of failed firms classified as non-failed by the respective model, and the type II error rate represents the percentage of non-failed firms classified as failed by the respective model. Overall accuracy gives the percentage of firms correctly classified in total; cI:cII is the ratio of the relative costs of type I to type II errors. Total expected costs are based on the average type I and type II error rates and prior probability of failure based on the average failure rate over the 25-year period. For illustrative purposes, we assume the cost of a type II error (cII) is 1%. Assuming a constant cost ratio (cI:cII), change in the type II error cost produces a proportional change in total expected costs.
|
0.70% |
|
|
|
|
Prop chance |
|
|
|
|
|
|
|
|
|
||
|
0.60% |
|
|
|
|
|
|
|
cost (%) |
0.50% |
|
|
|
|
|
|
PBT |
0.40% |
|
|
|
|
|
|
|
|
expected |
|
|
|
|
|
|
|
|
0.30% |
|
|
|
|
|
|
|
|
|
|
|
|
|
|
|
|
|
Total |
|
|
|
|
|
|
z-score |
|
0.20% |
|
|
|
|
|
|
|
|
|
|
|
|
|
|
|
|
|
|
0.10% |
|
Naive |
|
|
|
|
|
|
0.00% |
|
|
|
|
|
|
|
|
10 |
20 |
30 |
40 |
50 |
60 |
70 |
80 |
Ratio of type I to type II error costs
Naive |
|
|
|
|
|
Prop chance |
|
z-score |
|
|
|
PBT |
|
|
|
|
|
|
|
|
|||||
|
|
|
|
|
|
|
|
|
|
|
|
|
30

Table 1: Model for analysing fully listed industrial firms
The model takes the form:
z = 3.20 + 12.18*x1 + 2.50*x2 - 10.68*x3 + 0.029*x4
where |
|
|
x1 |
= |
profit before tax/current liabilities (53%) |
x2 |
= |
current assets/total liabilities (13%) |
x3 |
= |
current liabilities/total assets (18%) |
x4 |
= |
no-credit interval1 (16%) |
and c0…c4 are the respective model constant and coefficients. The percentages in brackets represent the Mosteller-Wallace contributions of the ratios to the power of the model. x1 measures profitability, x2 working capital position, x3 financial risk, and x4 liquidity.
1no-credit interval = (quick assets – current liabilities)/daily operating expenses with the denominator proxied by (sales – PBT – depreciation)/365
31

Table 2: Failure rates and percentage of firms with z<0
The z-scores of all the firms in our sample are computed based on their last available full year accounts as at the end of September of each year from 1979 to 2003 (year t). Firms are then tracked over the next twelve months (to 30 September of year t+1) to identify those that failed. Columns 2 and 5 give the number of firms with z<0 and z>0 respectively on 30 September of each year t, columns 3 and 6 provide the number of firms failing with -ve and +ve z-scores respectively between 1 October of year t and 30 September of year t+1. Column 4 gives the percentage of -ve z-score firms that failed and column 7 gives the percentage of +ve z-score firms that failed. Column 8 indicates the percentage of firms with -ve z-score on 30 September of year t and the last column gives the percentage of firms that failed between 1 October of year t and 30 September of year t + 1.
|
|
z<0 |
|
|
|
z>0 |
|
|
Overall |
Year |
No. of |
No. of |
Failure |
|
No. of |
No. of |
Failure |
z<0 |
failure |
t |
firms |
failures |
rate (%) |
|
firms |
failures |
rate (%) |
(%) |
rate (%) |
1979 |
186 |
11 |
5.9 |
1157 |
0 |
0.0 |
13.8 |
0.8 |
|
1980 |
225 |
14 |
6.2 |
1095 |
2 |
0.2 |
17.0 |
1.2 |
|
1981 |
258 |
17 |
6.6 |
1014 |
0 |
0.0 |
20.3 |
1.3 |
|
1982 |
312 |
8 |
2.6 |
912 |
0 |
0.0 |
25.5 |
0.7 |
|
1983 |
325 |
14 |
4.3 |
864 |
0 |
0.0 |
27.3 |
1.2 |
|
1984 |
291 |
10 |
3.4 |
844 |
0 |
0.0 |
25.6 |
0.9 |
|
1985 |
258 |
4 |
1.6 |
827 |
0 |
0.0 |
23.8 |
0.4 |
|
1986 |
246 |
3 |
1.2 |
764 |
0 |
0.0 |
24.4 |
0.3 |
|
1987 |
211 |
2 |
0.9 |
742 |
0 |
0.0 |
22.1 |
0.2 |
|
1988 |
165 |
2 |
1.2 |
773 |
0 |
0.0 |
17.6 |
0.2 |
|
1989 |
191 |
11 |
5.8 |
762 |
1 |
0.1 |
20.0 |
1.3 |
|
1990 |
220 |
15 |
6.8 |
731 |
1 |
0.1 |
23.1 |
1.7 |
|
1991 |
274 |
20 |
7.3 |
659 |
0 |
0.0 |
29.4 |
2.1 |
|
1992 |
276 |
6 |
2.2 |
608 |
0 |
0.0 |
31.2 |
0.7 |
|
1993 |
305 |
5 |
1.6 |
638 |
0 |
0.0 |
32.3 |
0.5 |
|
1994 |
253 |
6 |
2.4 |
683 |
0 |
0.0 |
27.0 |
0.6 |
|
1995 |
249 |
6 |
2.4 |
719 |
0 |
0.0 |
25.7 |
0.6 |
|
1996 |
274 |
9 |
3.3 |
775 |
0 |
0.0 |
26.1 |
0.9 |
|
1997 |
282 |
10 |
3.5 |
822 |
0 |
0.0 |
25.5 |
0.9 |
|
1998 |
293 |
5 |
1.7 |
803 |
1 |
0.1 |
26.7 |
0.5 |
|
1999 |
314 |
8 |
2.5 |
706 |
0 |
0.0 |
30.8 |
0.8 |
|
2000 |
345 |
7 |
2.0 |
601 |
1 |
0.2 |
36.5 |
0.8 |
|
2001 |
333 |
16 |
4.8 |
529 |
4 |
0.8 |
38.6 |
2.3 |
|
2002 |
345 |
4 |
1.2 |
485 |
3 |
0.6 |
41.6 |
0.8 |
|
2003 |
302 |
1 |
0.3 |
442 |
0 |
0.0 |
40.6 |
0.1 |
|
Total |
6733 |
214 |
3.2 |
18955 |
13 |
0.1 |
26.2 |
0.9 |
|
32

Table 3: Failure rates and percentages of loss-making firms
Profit before tax (PBT) figures for all firms in our sample are computed based on their last available full year profit and loss account as at the end of September of each year from 1979 to 2003 (year t). Firms are then tracked over the next twelve months (to 30 September of year t+1) to identify those that failed. Columns 2 and 5 give the number of firms with PBT<0 and PBT>0 respectively on 30 September of each year t; columns 3 and 6 provide the number of firms failing with -ve and +ve PBT respectively between 1 October of year t and 30 September of year t+1. Column 4 provides the percentage of -ve PBT firms that failed and column 7 the percentage of +ve PBT firms that failed. Column 8 indicates the percentage of firms with -ve PBT on 30 September of year t and the last column gives the percentage of firms that failed between 1 October of year t and 30 September of year t + 1.
|
|
PBT<0 |
|
|
|
PBT>0 |
|
|
Overall |
Year |
No. of |
No. of |
Failure |
|
No. of |
No. of |
Failure |
PBT<0 |
failure |
t |
firms |
failures |
rate (%) |
|
firms |
failures |
rate (%) |
(%) |
rate (%) |
1979 |
134 |
7 |
5.2 |
1209 |
4 |
0.3 |
10.0 |
0.8 |
|
1980 |
152 |
4 |
2.6 |
1168 |
12 |
1.0 |
11.5 |
1.2 |
|
1981 |
235 |
13 |
5.5 |
1037 |
4 |
0.4 |
18.5 |
1.3 |
|
1982 |
263 |
5 |
1.9 |
961 |
3 |
0.3 |
21.5 |
0.7 |
|
1983 |
255 |
9 |
3.5 |
934 |
5 |
0.5 |
21.4 |
1.2 |
|
1984 |
147 |
8 |
5.4 |
988 |
2 |
0.2 |
13.0 |
0.9 |
|
1985 |
115 |
2 |
1.7 |
970 |
2 |
0.2 |
10.6 |
0.4 |
|
1986 |
118 |
1 |
0.8 |
892 |
2 |
0.2 |
11.7 |
0.3 |
|
1987 |
94 |
2 |
2.1 |
859 |
0 |
0.0 |
9.9 |
0.2 |
|
1988 |
66 |
2 |
3.0 |
872 |
0 |
0.0 |
7.0 |
0.2 |
|
1989 |
50 |
2 |
4.0 |
903 |
10 |
1.1 |
5.2 |
1.3 |
|
1990 |
80 |
4 |
5.0 |
871 |
12 |
1.4 |
8.4 |
1.7 |
|
1991 |
142 |
14 |
9.9 |
791 |
6 |
0.8 |
15.2 |
2.1 |
|
1992 |
180 |
4 |
2.2 |
704 |
2 |
0.3 |
20.4 |
0.7 |
|
1993 |
211 |
5 |
2.4 |
732 |
0 |
0.0 |
22.4 |
0.5 |
|
1994 |
144 |
6 |
4.2 |
792 |
0 |
0.0 |
15.4 |
0.6 |
|
1995 |
122 |
4 |
3.3 |
846 |
2 |
0.2 |
12.6 |
0.6 |
|
1996 |
140 |
8 |
5.7 |
909 |
1 |
0.1 |
13.3 |
0.9 |
|
1997 |
135 |
6 |
4.4 |
969 |
4 |
0.4 |
12.2 |
0.9 |
|
1998 |
145 |
3 |
2.1 |
951 |
3 |
0.3 |
13.2 |
0.5 |
|
1999 |
170 |
7 |
4.1 |
850 |
1 |
0.1 |
16.7 |
0.8 |
|
2000 |
171 |
5 |
2.9 |
775 |
3 |
0.4 |
18.1 |
0.8 |
|
2001 |
181 |
14 |
7.7 |
681 |
6 |
0.9 |
21.0 |
2.3 |
|
2002 |
213 |
6 |
2.8 |
617 |
1 |
0.2 |
25.7 |
0.8 |
|
2003 |
168 |
1 |
0.6 |
576 |
0 |
0.0 |
22.6 |
0.1 |
|
Total |
3831 |
142 |
3.71 |
21857 |
85 |
0.4 |
14.9 |
0.9 |
|
33

Table 4: Error rates and total expected costs under different models
Z-score and profit before tax (PBT) figures for all the firms in our sample are computed based on their last available full year accounts as at the end of September of each year from 1979 to 2003 (year t). Firms are then tracked over the next twelve months (to 30 September of year t+1) to identify those that failed. The z-score model classifies all firms with z<0 as potential failures, the PBT model classifies all firms with PBT<0 as potential failures, the proportional chance model randomly classifies firms as potentially failed/non-failed based on the average failure rate over the 25-year period and the naïve model classifies all firms as non-failures. The type I error rate represents the percentage of failed firms classified as non-failed by the respective model, and the type II error rate represents the percentage of non-failed firms classified as failed by the respective model. Overall accuracy gives the percentage of firms correctly classified in total. cI:cII is the ratio of the relative costs of type I to type II errors. Total expected costs are based on the average type I and type II error rates and ex post determined probability of failure. For illustrative purposes, we assume the cost of a type II error (cII) is 1%. Assuming a constant cost ratio (cI:cII), change in the type II error cost produces a proportional change in total expected costs.
|
Error rate(%) |
Overall |
|
Total expected costs (%) |
|||
Model |
|
|
accuracy |
cI:cII = cI:cII = |
cI:cII = |
cI:cII = |
|
|
Type I |
Type II |
rate (%) |
||||
|
20:1 |
40:1 |
60:1 |
80:1 |
|||
|
|
|
|
||||
z-score |
5.7 |
25.6 |
74.6 |
0.26 |
0.27 |
0.28 |
0.29 |
PBT |
37.4 |
14.5 |
85.3 |
0.21 |
0.28 |
0.34 |
0.41 |
Proportional chance |
99.1 |
0.9 |
98.2 |
0.18 |
0.36 |
0.53 |
0.71 |
Naïve |
100.0 |
0.0 |
99.1 |
0.18 |
0.35 |
0.53 |
0.71 |
34

Table 5: Relative costs of misclassifications and total expected costs
Z-score and profit before tax (PBT) figures for all the firms in our sample are computed based on their last available full year accounts as at the end of September of each year from 1979 to 2003 (year t). Firms are then tracked over the next twelve months (to 30 September of year t+1) to identify those that failed. The z-score model classifies all firms with z<0 as potential failures and the PBT model classifies all firms with PBT<0 as potential failures. The type I error rate represents the percentage of failed firms classified as non-failed by the respective model, and the type II error rate represents the percentage of non-failed firms classified as failed by the respective model. Overall accuracy gives the percentage of firms correctly classified in total; cI:cII is the ratio of the relative costs of type I to type II errors. Total expected costs are based on the average type I and type II error rates and ex post determined probability of failure. For illustrative purposes, we assume the cost of a type II error (cII) is 1%. Assuming a constant cost ratio (cI:cII), change in the type II error cost produces a proportional change in total expected costs.
cI:cII |
Cut-off |
Error rate (%) |
Expected cost (%) |
|||
Type I |
Type II |
z-score |
PBT |
|||
|
|
|||||
20 |
-1.72 |
22.47 |
15.25 |
0.19 |
0.21 |
|
30 |
-1.32 |
20.26 |
17.36 |
0.23 |
0.24 |
|
40 |
-1.03 |
16.74 |
18.87 |
0.25 |
0.28 |
|
50 |
-0.81 |
12.78 |
20.17 |
0.26 |
0.31 |
|
60 |
-0.63 |
10.13 |
21.37 |
0.27 |
0.34 |
|
70 |
-0.47 |
8.37 |
22.34 |
0.27 |
0.38 |
|
80 |
-0.34 |
7.93 |
23.84 |
0.29 |
0.41 |
|
35

Table 6: Firm failure probabilities by –ve z-score quintile
The z-scores of all the firms in our sample are computed based on their last available full year accounts as at the end of September of each year from 1979 to 2003 (year t). The firms are then ranked on their z-scores and for the negative z- score stocks, five portfolios of equal number of stocks are formed each year. Firms are then tracked for the next twelve months (to 30 September of year t+1) to identify those that failed. The z-score model classifies all firms with z<0 as failures.The entries in the table refer exclusively to the -ve z-score firms in our sample.
|
|
Negative z-score quintile |
|
|||
|
5 |
4 |
3 |
2 |
1 |
Total |
|
(worst) |
(best) |
firms |
|||
|
|
|
|
|||
|
|
|
|
|
|
|
Failed (%) |
7.3 |
4.3 |
2.1 |
1.8 |
0.8 |
214 |
Non-failed (%) |
92.7 |
95.7 |
97.9 |
98.2 |
99.2 |
6519 |
|
|
|
|
|
|
|
Number of firms |
1356 |
1347 |
1338 |
1342 |
1350 |
6733 |
% of total failures (n = 227) |
42.3 |
25.6 |
11.5 |
10.6 |
4.4 |
94.3 |
36