Добавил:
Опубликованный материал нарушает ваши авторские права? Сообщите нам.
Вуз: Предмет: Файл:

Mankiw Principles of Economics (3rd ed)

.pdf
Скачиваний:
1077
Добавлен:
22.08.2013
Размер:
5.93 Mб
Скачать

308

PART FIVE FIRM BEHAVIOR AND THE ORGANIZATION OF INDUSTRY

A SHIFT IN DEMAND IN THE SHORT RUN AND LONG RUN

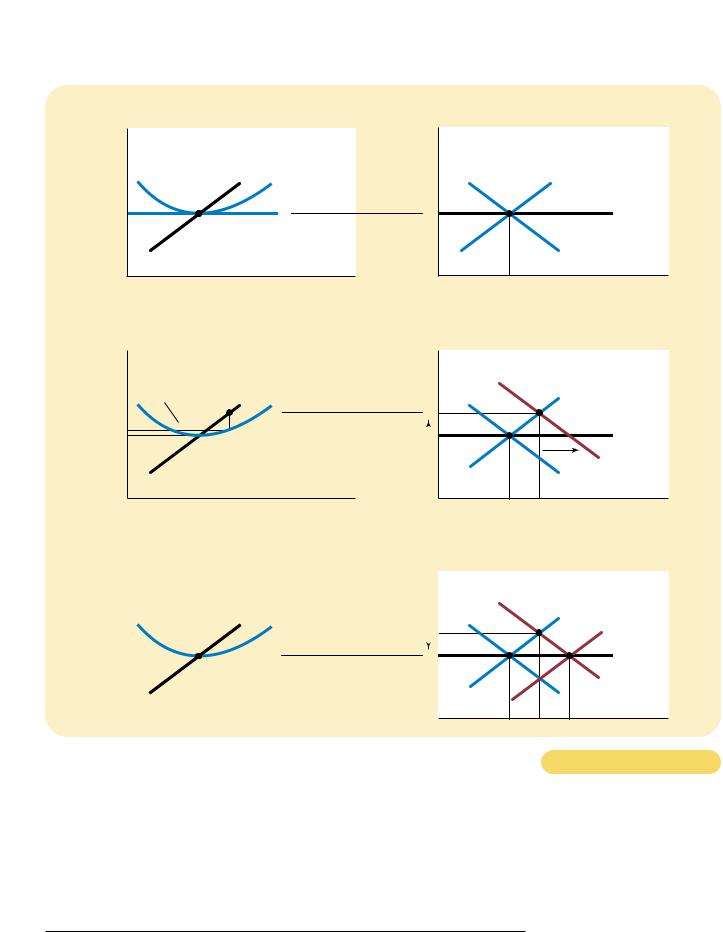
Because firms can enter and exit a market in the long run but not in the short run, the response of a market to a change in demand depends on the time horizon. To see this, let’s trace the effects of a shift in demand. This analysis will show how a market responds over time, and it will show how entry and exit drive a market to its long-run equilibrium.

Suppose the market for milk begins in long-run equilibrium. Firms are earning zero profit, so price equals the minimum of average total cost. Panel (a) of Figure 14-8 shows the situation. The long-run equilibrium is point A, the quantity sold in the market is Q1, and the price is P1.

Now suppose scientists discover that milk has miraculous health benefits. As a result, the demand curve for milk shifts outward from D1 to D2, as in panel (b). The short-run equilibrium moves from point A to point B; as a result, the quantity rises from Q1 to Q2, and the price rises from P1 to P2. All of the existing firms respond to the higher price by raising the amount produced. Because each firm’s supply curve reflects its marginal-cost curve, how much they each increase production is determined by the marginal-cost curve. In the new, short-run equilibrium, the price of milk exceeds average total cost, so the firms are making positive profit.

Over time, the profit in this market encourages new firms to enter. Some farmers may switch to milk from other farm products, for example. As the number of firms grows, the short-run supply curve shifts to the right from S1 to S2, as in panel (c), and this shift causes the price of milk to fall. Eventually, the price is driven back down to the minimum of average total cost, profits are zero, and firms stop entering. Thus, the market reaches a new long-run equilibrium, point C. The price of milk has returned to P1, but the quantity produced has risen to Q3. Each firm is again producing at its efficient scale, but because more firms are in the dairy business, the quantity of milk produced and sold is higher.

WHY THE LONG-RUN SUPPLY CURVE

MIGHT SLOPE UPWARD

So far we have seen that entry and exit can cause the long-run market supply curve to be horizontal. The essence of our analysis is that there are a large number of potential entrants, each of which faces the same costs. As a result, the long-run market supply curve is horizontal at the minimum of average total cost. When the demand for the good increases, the long-run result is an increase in the number of firms and in the total quantity supplied, without any change in the price.

There are, however, two reasons that the long-run market supply curve might slope upward. The first is that some resource used in production may be available only in limited quantities. For example, consider the market for farm products. Anyone can choose to buy land and start a farm, but the quantity of land is limited. As more people become farmers, the price of farmland is bid up, which raises the costs of all farmers in the market. Thus, an increase in demand for farm products cannot induce an increase in quantity supplied without also inducing a rise in farmers’ costs, which in turn means a rise in price. The result is a long-run market supply curve that is upward sloping, even with free entry into farming.

A second reason for an upward-sloping supply curve is that firms may have different costs. For example, consider the market for painters. Anyone can enter


(a) Initial Condition


Firm


Market

Price


Price


MC

ATC


Short-run supply, S1


P1

P

P1

A

Long-run


supply


Demand, D1

0

Quantity (firm)

0

Q1

Quantity (market)


(b) Short-Run Response


Firm


Price


Price

Profit

MC

ATC


P2


P2


P1


P


1


Market

S1

B

A

Long-run

supply

D2

D1

0


Quantity (firm)

0


(c) Long-Run Response


Firm


Price


Price


MC

ATC


P2


P1


P1


Q1 Q2

Quantity (market)

Market

B

S1

S2


AC

Long-run supply

D2

D1

0

Quantity (firm)

0

Q1 Q2 Q3 Quantity (market)

AN INCREASE IN DEMAND IN THE SHORT RUN AND LONG RUN.

The market starts in a

long-run equilibrium, shown as point A in panel (a). In this equilibrium, each firm makes zero profit, and the price equals the minimum average total cost. Panel (b) shows what happens in the short run when demand rises from D1 to D2. The equilibrium goes from point A to point B, price rises from P1 to P2, and the quantity sold in the market rises from Q1 to Q2. Because price now exceeds average total cost, firms make profits, which over time encourage new firms to enter the market. This entry shifts the short-run supply curve to the right from S1 to S2, as shown in panel (c). In the new long-run equilibrium, point C, price has returned to P1 but the quantity sold has increased to Q3. Profits are again zero, price is back to the minimum of average total cost, but the market has more firms to satisfy the greater demand.

Figur e 14-8

310

PART FIVE FIRM BEHAVIOR AND THE ORGANIZATION OF INDUSTRY


gluts, price wars, shakeouts,


IN THE NEWS


consolidations. . . .


One man who attended the Pebble


Entry or Overinvestment?


meeting, Joseph Soviero, a Union


bide vice president, cites an odd but


problem in chemicals: the strong


of the past few years. “The prof-


that the industry sees during the


times has always led to overinvest-


and it has this time,” Mr. Soviero


be euphoric.

says. He adds that the chemicals busi-


Instead, an undertone of concern is

ness cycle is alive and has peaked. At


evident among these executives from

Union Carbide, he says, “we always talk


Mobil Corp., Union Carbide Corp. and

about the cycle” and try to manage it.


other capital-intensive companies. In be-

So far, demand isn’t a big problem.


tween golf, fine meals and cigars, they

In many industries, it is still growing


hear a sobering message from their

steadily, though slowly. What is develop-


hosts.

ing is too much supply, stemming from


“I feel like the prophet of doom” is

the recurring problem of overinvestment.


the welcoming line of R. Duane Dickson,

. . . The next few years will bring fierce


a director of Mercer Management Con-

competition and falling prices.


sulting and host of the meeting. “It’s our


belief that the downturn has started. I

SOURCE: The Wall Street Journal, August 7, 1997,


can’t tell you how far it’s going to go. But

p. A1.


A K e y C u l p r i t : H i g h P r o f i t s

it could be a very ugly one.”


For two days, the executives and


BY BERNARD WYSOCKI, JR.

their advisers discuss what they expect


MONTEREY, CALIF.—About 20 execu-

in their industries between now and


tives are huddled in a conference room

2000: growing overcapacity, world-wide


the market for painting services, but not everyone has the same costs. Costs vary in part because some people work faster than others and in part because some people have better alternative uses of their time than others. For any given price, those with lower costs are more likely to enter than those with higher costs. To increase the quantity of painting services supplied, additional entrants must be encouraged to enter the market. Because these new entrants have higher costs, the price must rise to make entry profitable for them. Thus, the market supply curve for painting services slopes upward even with free entry into the market.

Notice that if firms have different costs, some firms earn profit even in the long run. In this case, the price in the market reflects the average total cost of the marginal firm—the firm that would exit the market if the price were any lower. This firm earns zero profit, but firms with lower costs earn positive profit. Entry does not eliminate this profit because would-be entrants have higher costs than firms already in the market. Higher-cost firms will enter only if the price rises, making the market profitable for them.

CHAPTER 14 FIRMS IN COMPETITIVE MARKETS

311

Thus, for these two reasons, the long-run supply curve in a market may be upward sloping rather than horizontal, indicating that a higher price is necessary to induce a larger quantity supplied. Nonetheless, the basic lesson about entry and exit remains true. Because firms can enter and exit more easily in the long run than in the short run, the long-run supply curve is typically more elastic than the short-run supply curve.

QUICK QUIZ: In the long run with free entry and exit, is the price in a market equal to marginal cost, average total cost, both, or neither? Explain with a diagram.

CONCLUSION: BEHIND THE SUPPLY CURVE

We have been discussing the behavior of competitive profit-maximizing firms. You may recall from Chapter 1 that one of the Ten Principles of Economics is that rational people think at the margin. This chapter has applied this idea to the competitive firm. Marginal analysis has given us a theory of the supply curve in a competitive market and, as a result, a deeper understanding of market outcomes.

We have learned that when you buy a good from a firm in a competitive market, you can be assured that the price you pay is close to the cost of producing that good. In particular, if firms are competitive and profit-maximizing, the price of a good equals the marginal cost of making that good. In addition, if firms can freely enter and exit the market, the price also equals the lowest possible average total cost of production.

Although we have assumed throughout this chapter that firms are price takers, many of the tools developed here are also useful for studying firms in less competitive markets. In the next three chapters we will examine the behavior of firms with market power.

firms, but it will have quite

Summar y

Because a competitive firm is a price taker, its revenue is proportional to the amount of output it produces. The price of the good equals both the firm’s average revenue and its marginal revenue.

To maximize profit, a firm chooses a quantity of output such that marginal revenue equals marginal cost. Because marginal revenue for a competitive firm equals the market price, the firm chooses quantity so that price equals marginal cost. Thus, the firm’s marginal cost curve is its supply curve.

In the short run when a firm cannot recover its fixed costs, the firm will choose to shut down temporarily if

the price of the good is less than average variable cost. In the long run when the firm can recover both fixed and variable costs, it will choose to exit if the price is less than average total cost.

In a market with free entry and exit, profits are driven to zero in the long run. In this long-run equilibrium, all firms produce at the efficient scale, price equals the minimum of average total cost, and the number of firms adjusts to satisfy the quantity demanded at this price.

Changes in demand have different effects over different time horizons. In the short run, an increase in demand raises prices and leads to profits, and a decrease in

312

PART FIVE FIRM BEHAVIOR AND THE ORGANIZATION OF INDUSTRY

demand lowers prices and leads to losses. But if firms can freely enter and exit the market, then in the long run

the number of firms adjusts to drive the market back to the zero-profit equilibrium.


Key Concepts


competitive market, p. 292


cost, p. 298


average revenue, p. 294


Questions for Review


1.What is meant by a competitive

2.Draw the cost curves for a typical price, explain how the firm chooses that maximizes profit.

3.Under what conditions will a temporarily? Explain.

4.Under what conditions will a Explain.

Problems and Applications

equal marginal cost in the short run, both? Explain.

equal the minimum of average total in the long run, or both? Explain.

curves typically more elastic in the long run? Explain.

1.What are the characteristics of a competitive market? Which of the following drinks do you think is best described by these characteristics? Why aren’t the others?

a.tap water

b.bottled water

c.cola

d.beer

2.Your roommate’s long hours in Chem lab finally paid off—she discovered a secret formula that lets people do an hour’s worth of studying in 5 minutes. So far, she’s sold 200 doses, and faces the following average-total- cost schedule:

QAVERAGE TOTAL COST

199

$199

200

200

201

201

b.Is this industry in long-run equilibrium? Why or why not?

4.You go out to the best restaurant in town and order a lobster dinner for $40. After eating half of the lobster, you realize that you are quite full. Your date wants you to finish your dinner, because you can’t take it home and because “you’ve already paid for it.” What should you do? Relate your answer to the material in this chapter.

5.Bob’s lawn-mowing service is a profit-maximizing, competitive firm. Bob mows lawns for $27 each. His total cost each day is $280, of which $30 is a fixed cost. He mows 10 lawns a day. What can you say about Bob’s short-run decision regarding shut down and his longrun decision regarding exit?

6.Consider total cost and total revenue given in the table below:

QUANTITY

If a new customer offers to pay your roommate $300 for one dose, should she make one more? Explain.

3.The licorice industry is competitive. Each firm produces 2 million strings of licorice per year. The strings have an average total cost of $0.20 each, and they sell for $0.30. a. What is the marginal cost of a string?


0

1

2

3

4

5

6

7

Total cost

$8

$9

$10

$11

$13

$19

$27

$37

Total revenue

0

8

16

24

32

40

48

56

a.Calculate profit for each quantity. How much should the firm produce to maximize profit?

CHAPTER 14 FIRMS IN COMPETITIVE MARKETS

313

b.Calculate marginal revenue and marginal cost for each quantity. Graph them. (Hint: Put the points between whole numbers. For example, the marginal cost between 2 and 3 should be graphed at 2 1/2.) At what quantity do these curves cross? How does this relate to your answer to part (a)?

c.Can you tell whether this firm is in a competitive industry? If so, can you tell whether the industry is in a long-run equilibrium?

7.From The Wall Street Journal (July 23, 1991): “Since peaking in 1976, per capita beef consumption in the United States has fallen by 28.6 percent . . . [and] the size of the U.S. cattle herd has shrunk to a 30-year low.”

a.Using firm and industry diagrams, show the shortrun effect of declining demand for beef. Label the diagram carefully and write out in words all of the changes you can identify.

b.On a new diagram, show the long-run effect of declining demand for beef. Explain in words.

8.“High prices traditionally cause expansion in an industry, eventually bringing an end to high prices and manufacturers’ prosperity.” Explain, using appropriate diagrams.

9.Suppose the book-printing industry is competitive and begins in a long-run equilibrium.

a.Draw a diagram describing the typical firm in the industry.

b.Hi-Tech Printing Company invents a new process that sharply reduces the cost of printing books. What happens to Hi-Tech’s profits and the price of books in the short run when Hi-Tech’s patent prevents other firms from using the new technology?

c.What happens in the long run when the patent expires and other firms are free to use the technology?

10.Many small boats are made of fiberglass, which is derived from crude oil. Suppose that the price of oil rises.

a.Using diagrams, show what happens to the cost curves of an individual boat-making firm and to the market supply curve.

b.What happens to the profits of boat makers in the short run? What happens to the number of boat makers in the long run?

11.Suppose that the U.S. textile industry is competitive, and there is no international trade in textiles. In longrun equilibrium, the price per unit of cloth is $30.

a.Describe the equilibrium using graphs for the entire market and for an individual producer.

Now suppose that textile producers in other countries are willing to sell large quantities of cloth in the United States for only $25 per unit.

b.Assuming that U.S. textile producers have large fixed costs, what is the short-run effect of these imports on the quantity produced by an individual producer? What is the short-run effect on profits? Illustrate your answer with a graph.

c.What is the long-run effect on the number of U.S. firms in the industry?

12.Suppose there are 1,000 hot pretzel stands operating in New York City. Each stand has the usual U-shaped average-total-cost curve. The market demand curve for pretzels slopes downward, and the market for pretzels is in long-run competitive equilibrium.

a.Draw the current equilibrium, using graphs for the entire market and for an individual pretzel stand.

b.Now the city decides to restrict the number of pretzel-stand licenses, reducing the number of stands to only 800. What effect will this action have on the market and on an individual stand that is still operating? Use graphs to illustrate your answer.

c.Suppose that the city decides to charge a license fee for the 800 licenses. How will this affect the number of pretzels sold by an individual stand, and the stand’s profit? The city wants to raise as much revenue as possible and also wants to ensure that 800 pretzel stands remain in the city. By how much should the city increase the license fee? Show the answer on your graph.

13.Assume that the gold-mining industry is competitive.

a.Illustrate a long-run equilibrium using diagrams for the gold market and for a representative gold mine.

b.Suppose that an increase in jewelry demand induces a surge in the demand for gold. Using your diagrams, show what happens in the short run to the gold market and to each existing gold mine.

c.If the demand for gold remains high, what would happen to the price over time? Specifically, would the new long-run equilibrium price be above, below, or equal to the short-run equilibrium price in part (b)? Is it possible for the new long-run equilibrium price to be above the original long-run equilibrium price? Explain.

14.(This problem is challenging.) The New York Times (July 1, 1994) reported on a Clinton administration proposal to lift the ban on exporting oil from the North Slope of Alaska. According to the article, the administration said that “the chief effect of the ban has

314

PART FIVE FIRM BEHAVIOR AND THE ORGANIZATION OF INDUSTRY

been to provide California refiners with crude oil cheaper than oil on the world market. . . . The ban created a subsidy for California refiners that had not been passed on to consumers.” Let’s use our analysis of firm behavior to analyze these claims.

a.Draw the cost curves for a California refiner and for a refiner in another part of the world. Assume that the California refiners have access to inexpensive Alaskan crude oil and that other refiners must buy more expensive crude oil from the Middle East.

b.All of the refiners produce gasoline for the world gasoline market, which has a single price. In the long-run equilibrium, will this price depend on the costs faced by California producers or the costs faced by other producers? Explain. (Hint: California cannot itself supply the entire world market.) Draw new graphs that illustrate the profits earned by a California refiner and another refiner.

c.In this model, is there a subsidy to California refiners? Is it passed on to consumers?

M O N O P O L Y

If you own a personal computer, it probably uses some version of Windows, the operating system sold by the Microsoft Corporation. When Microsoft first designed Windows many years ago, it applied for and received a copyright from the government. The copyright gives Microsoft the exclusive right to make and sell copies of the Windows operating system. So if a person wants to buy a copy of Windows, he or she has little choice but to give Microsoft the approximately $50 that the firm has decided to charge for its product. Microsoft is said to have a monopoly in the market for Windows.

Microsoft’s business decisions are not well described by the model of firm behavior we developed in Chapter 14. In that chapter, we analyzed competitive markets, in which there are many firms offering essentially identical products, so each firm has little influence over the price it receives. By contrast, a monopoly such as Microsoft has no close competitors and, therefore, can influence the market price of its product. While a competitive firm is a price taker, a monopoly firm is a price maker.

IN THIS CHAPTER YOU WILL . . .

Lear n why some markets have only one seller

Analyze how a monopoly deter mines the quantity to pr oduce and the price to char ge

See how the monopoly’s decisions af fect economic well - being

Consider the various public policies aimed at solving the pr oblem of monopoly

See why monopolies tr y to char ge

dif fer ent prices to dif fer ent customers

315

316

PART FIVE FIRM BEHAVIOR AND THE ORGANIZATION OF INDUSTRY

In this chapter we examine the implications of this market power. We will see that market power alters the relationship between a firm’s price and its costs. A competitive firm takes the price of its output as given by the market and then chooses the quantity it will supply so that price equals marginal cost. By contrast, the price charged by a monopoly exceeds marginal cost. This result is clearly true in the case of Microsoft’s Windows. The marginal cost of Windows—the extra cost that Microsoft would incur by printing one more copy of the program onto some floppy disks or a CD—is only a few dollars. The market price of Windows is many times marginal cost.

It is perhaps not surprising that monopolies charge high prices for their products. Customers of monopolies might seem to have little choice but to pay whatever the monopoly charges. But, if so, why does a copy of Windows not cost $500? Or $5,000? The reason, of course, is that if Microsoft set the price that high, fewer people would buy the product. People would buy fewer computers, switch to other operating systems, or make illegal copies. Monopolies cannot achieve any level of profit they want, because high prices reduce the amount that their customers buy. Although monopolies can control the prices of their goods, their profits are not unlimited.

As we examine the production and pricing decisions of monopolies, we also consider the implications of monopoly for society as a whole. Monopoly firms, like competitive firms, aim to maximize profit. But this goal has very different ramifications for competitive and monopoly firms. As we first saw in Chapter 7, selfinterested buyers and sellers in competitive markets are unwittingly led by an invisible hand to promote general economic well-being. By contrast, because monopoly firms are unchecked by competition, the outcome in a market with a monopoly is often not in the best interest of society.

One of the Ten Principles of Economics in Chapter 1 is that governments can sometimes improve market outcomes. The analysis in this chapter will shed more light on this principle. As we examine the problems that monopolies raise for society, we will also discuss the various ways in which government policymakers might respond to these problems. The U.S. government, for example, keeps a close eye on Microsoft’s business decisions. In 1994, it prevented Microsoft from buying Intuit, a software firm that sells the leading program for personal finance, on the grounds that the combination of Microsoft and Intuit would concentrate too much market power in one firm. Similarly, in 1998, the U.S. Justice Department objected when Microsoft started integrating its Internet browser into its Windows operating system, claiming that this would impede competition from other companies, such as Netscape. This concern led the Justice Department to file suit against Microsoft, the final resolution of which was still unsettled as this book was going to press.


WHY MONOPOLIES ARISE


monopoly

A firm is a monopoly if it is the sole seller of its product and if its product does not

a firm that is the sole seller of a

have close substitutes. The fundamental cause of monopoly is barriers to entry: A mo-

product without close substitutes

nopoly remains the only seller in its market because other firms cannot enter


the market and compete with it. Barriers to entry, in turn, have three main sources:

CHAPTER 15 MONOPOLY

317

A key resource is owned by a single firm.

The government gives a single firm the exclusive right to produce some good or service.

The costs of production make a single producer more efficient than a large number of producers.

Let’s briefly discuss each of these.

MONOPOLY RESOURCES

The simplest way for a monopoly to arise is for a single firm to own a key resource.

“Rather than a monopoly, we like

For example, consider the market for water in a small town in the Old West. If

to consider ourselves ‘the only

dozens of town residents have working wells, the competitive model discussed in

game in town.’”

Chapter 14 describes the behavior of sellers. As a result, the price of a gallon of wa-


ter is driven to equal the marginal cost of pumping an extra gallon. But if there is


only one well in town and it is impossible to get water from anywhere else, then


the owner of the well has a monopoly on water. Not surprisingly, the monopolist


has much greater market power than any single firm in a competitive market. In


the case of a necessity like water, the monopolist could command quite a high


price, even if the marginal cost is low.


Although exclusive ownership of a key resource is a potential cause of mo-


nopoly, in practice monopolies rarely arise for this reason. Actual economies are


large, and resources are owned by many people. Indeed, because many goods are


traded internationally, the natural scope of their markets is often worldwide. There


are, therefore, few examples of firms that own a resource for which there are no


close substitutes.


CASE STUDY THE DEBEERS DIAMOND MONOPOLY

A classic example of a monopoly that arises from the ownership of a key resource is DeBeers, the South African diamond company. DeBeers controls about 80 percent of the world’s production of diamonds. Although the firm’s share of the market is not 100 percent, it is large enough to exert substantial influence over the market price of diamonds.

How much market power does DeBeers have? The answer depends in part on whether there are close substitutes for its product. If people view emeralds, rubies, and sapphires as good substitutes for diamonds, then DeBeers has relatively little market power. In this case, any attempt by DeBeers to raise the price of diamonds would cause people to switch to other gemstones. But if people view these other stones as very different from diamonds, then DeBeers can exert substantial influence over the price of its product.

DeBeers pays for large amounts of advertising. At first, this decision might seem surprising. If a monopoly is the sole seller of its product, why does it need to advertise? One goal of the DeBeers ads is to differentiate diamonds from other gems in the minds of consumers. When their slogan tells you that “a diamond is forever,” you are meant to think that the same is not true of emeralds, rubies, and sapphires. (And notice that the slogan is applied to all diamonds, not just DeBeers diamonds—a sign of DeBeers’s monopoly position.) If the ads are