

C++ For Mathematicians (2006) [eng]
.pdf
318 |
C++ for Mathematicians |
Choosing the appropriate plotter type
The plotutils package is capable of producing various types of graphics files including gif, eps, and several others. Fortunately, the methods for creating images for these various formats are all identical. If we write code to produce one type of file and subsequently decide we prefer another type, it is easy to change the code to implement the new choice.
Each drawing is produced by an object that is a subclass of the type Plotter. To create a gif image, we declare an object of type GIFPlotter; for an eps image, we declare a PSPlotter object. For other graphics formats, see the file plotutils.pdf included in the info subdirectory.
At this point you may be wondering, which type of file should I choose? Here’s some guidance. Graphic image files can be divided into two broad categories: bit images and vector graphics. Bit image files are (essentially) a matrix of pixels; they are useful for representing photographs and are manipulated using “paint” style programs. On the other hand, vector graphic files represent their drawings using mathematical primitives such as line segments, ellipses, Bezier curves, and so forth. They are edited using “draw” style programs. For our first project, drawing , we use PSPlotter to produce an eps file. If were interested in drawing a picture of a Julia set (by plotting individual points), then we would use a GIFPlotter.
These various constructors are defined in the header file plotter.h, so the directive #include "plotter.h" is needed.
Arguments to the constructor
Regardless of which subtype of the class Plotter we choose, the declaration of the Plotter object is the same. The constructor requires four arguments like this:
PlotterType(input, output, error, parameters) where
•input is an object of type ifstream such as cin. At present, this input stream is not used, so the simplest choice is to set this equal to cin.
•output is an object of type ofstream such as cout. When the Plotter object writes its results, it sends it to this argument. Therefore, it is usually not a good idea to set this equal to cout. Rather, it is better to create a separate object of type ofstream to write to a file on disk. Thus, we need the directive #include <fstream> and to declare an output object like this:
ofstream pout("filename");
and use pout for the second argument to the constructor.
•error is also an object of type fstream to which error messages are written. If something goes awry during the drawing process, the Plotter object reports the problem through this output stream. The simplest choice is to set this to cerr, the standard error output stream.
Strings, Input/Output, and Visualization |
319 |
•params is an object of type PlotterParams. The plotutils documentation explains various options that can be embedded in this object and then passed to the Plotter. However, the simplest thing to do is to specify no special options. Just declare an object of type PlotParams and pass that as the fourth argument to the constructor.
Thus, a Plotter object is created with code that looks like this:
ofstream pout("picture.eps"); PlotterParams params;
PSPlotter P(cin, pout, cerr, params);
With this in place, the plotter object P is created. See Program 14.11 lines 11–13.
Other initialization
After a Plotter object is constructed, there are a few additional steps to take before we can begin drawing. The first of these is mandatory: the Plotter needs to be “opened.” This is analogous to opening a file for writing. To open a Plotter we use its openpl() method. This method returns a negative value if anything goes amiss. See lines 16–19 of Program 14.11.
The next step is to establish a coordinate system. This is done by specifying the coordinates of the lower left and upper right corners of a square6 in the plane in which you wish to draw. For our project, the region extending from (−32 ,−32 ) to
( 3 |
, 3 ) is sufficient because it encompasses both line segments and the circle centered |
||
2 |
2 |
|
|
at the origin of radius √ |
|
|
|
2. |
|||
|
The coordinate system is established with the space or fspace methods. Both |
||
of these take four arguments corresponding to the x and y coordinates of the lower left corner followed by the coordinates of the upper right corner. The only difference between these two methods is that space takes integer arguments whereas fspace takes real (the f is for float) arguments. Thus, on line 22 of Program 14.11 we have
P.fspace(-1.5, -1.5, 1.5, 1.5); but we could have used
P.space(-2, -2, 2, 2);
instead.
We are nearly ready to draw; all we need to do now is select our pen (this happens on lines 25 and 26 of Program 14.11). First we select the line width of the pen with the flinewidth method. The argument produces a line thickness relative to the overall size of your drawing area (established with the space/fspace method). The color is chosen with either the pencolorname or pencolor method. The pencolorname method takes a char* string argument giving the English name7
6It is possible to specify a nonsquare rectangular region, but this results in a distorted image. The drawing region you specified is mapped to a square “viewport”. If your region is not square, then it is rescaled horizontally or vertically to make it square. This causes circles to become ellipses, and so on.
7Of course, not all color names are recognized by this method, but the basic ones are.

Strings, Input/Output, and Visualization |
321 |
However, if the compiler cannot find these files, it will complain. For the g++ compiler (and many others), these are specified using the -I (for headers) and -L (for libraries) options. For example, suppose these files are located on your computer as follows.
Header file |
/home/zelda/include/plotter.h |
Library file |
/home/zelda/lib/libplotter.a |
To compile, use the following command.
g++ xo.cc -I/home/zelda/include -L/home/zelda/lib -lplotter
(See Appendix A.1.4 for more detail about the -I, -L, and -l options.)
When you run the program (named a.out or something similar) it produces the file xo.eps. You can now use this file in a LATEX document or for whatever purpose you wish. The output of the program is shown in Figure 14.2.
The full code for the program xo.cc follows.
Program 14.11: A program to draw the symbol .
1 #include <iostream>
2#include <fstream>
3 #include "plotter.h"
4using namespace std;
5
6const char* IMAGE_FILE = "xo.eps";
7
8int main(int argc, char** argv) {
9
10// Construct the plotter
11ofstream pout(IMAGE_FILE);
12PlotterParams params;
13PSPlotter P(cin, pout, cerr, params);
14
15// Open the plotter
16if (P.openpl() < 0) {
17cerr << "Unable to open plotter" << endl;
18return 1;
19}
20
21// Set up my coordinate system
22P.fspace(-1.5, -1.5, 1.5, 1.5);
23
24// Set drawing parameters
25P.flinewidth(0.05);
26P.pencolorname("black");
27
28// Draw the X
29P.line(-1,-1,1,1);
30P.line(-1,1,1,-1);
31
32// Draw the circle
33P.fcircle(0.,0.,sqrt(2.));
34
35 // Close the image

322 |
C++ for Mathematicians |
36if (P.closepl() < 0) {
37cerr << "Unable to close plotter" << endl;
38return 1;
39}
40
41return 0;
42}
Figure 14.2: The symbol drawn by Program 14.11.
Although we can use C++ to draw pictures such as , mouse-driven drawing programs are more convenient for producing such simple diagrams. The advantage in using C++ to draw accrues when we want to visualize a mathematical object that requires nontrivial computation to produce.
We demonstrate this now with three examples.
14.8.3 Pascal’s triangle modulo two
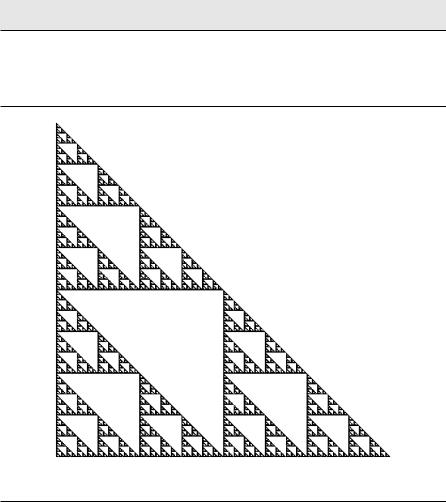
Pascal’s triangle is a table of the binomial coefficients; the nth row (beginning with n = 0) contains the values n0 , n1 , . . . , nn . There are myriad interesting properties of binomial coefficients and Pascal’s triangle. One of the more striking is to look at Pascal’s triangle with entries taken modulo 2. That is, we plot a black point for each odd entry of Pascal’s triangle (and leave even entries blank).
Because the image is an array of dots (pixels), we use a GIFPlotter object to do the drawing. Although we could create an array to hold all the entries in Pascal’s triangle, we opt instead to create two arrays to hold individual rows (the current row built from the previous row).
Here is the code which should be self explanatory.
Program 14.12: A program to visualize Pascal’s triangle modulo 2.
1 #include <iostream>
2#include <fstream>
3 #include "plotter.h"
4using namespace std;
5

Strings, Input/Output, and Visualization |
323 |
6const char* IMAGE_FILE = "pascal.gif";
7 const int NROWS = 2048;
8
9int main() {
10
11// Place to hold row of Pascal’s triangle and a copy to generate the
12// next row.
13int row[NROWS+1];
14int prev_row[NROWS+1];
15for (int i=0; i<=NROWS; i++) {
16row[i] = 0;
17prev_row[i] = 0;
18}
19
20// Construct the plotter
21PlotterParams params;
22ofstream pout(IMAGE_FILE);
23GIFPlotter P(cin, pout, cerr, params);
24
25// Open the plotter
26if (P.openpl() < 0) {
27cerr << "Unable to open plotter" << endl;
28return 1;
29}
30
31// Set up my coordinate system
32P.space(-1,-1,NROWS+1,NROWS+1);
33
34// Set drawing parameters
35P.pencolorname("black");
36
37// Generate rows of Pascal’s triangle (mod 2)
38for (int r=0; r<NROWS; r++) {
39row[0] = 1;
40for (int j=1; j<r; j++) {
41row[j] = (prev_row[j-1]+prev_row[j])%2;
42}
43row[r] = 1;
44
45// Plot points for this row
46for (int j=0; j<=r; j++) {
47if (row[j] == 1) {
48P.point(NROWS-r,j);
49}
50}
51
52// copy row to prev_row
53for (int j=0; j<=r; j++) prev_row[j] = row[j];
54}
55
56// Close the image
57if (P.closepl() < 0) {
58cerr << "Unable to close plotter" << endl;
59return 1;
60}
61
324 |
C++ for Mathematicians |
62return 0;
63}
The output of this program (Figure 14.3) is the beautiful fractal known as Sierpinski’s triangle.
Figure 14.3: Visualizing Pascal’s triangle modulo 2.
14.8.4 Tracing the motion of a point moving randomly in a triangle
The next example visualizes the following process. Three fixed points (named A, B, and C) are located at the vertices of an equilateral triangle. A moving point X begins at one of these locations and then moves to a new location at random. At each step, the new location is the midpoint of one of the segments AX, BX, CX—each with probability 13 . Imagine that each time we find a new location for X, we plot a point in the plane. After many iterations, what do we see?
Program 14.13 draws a picture by precisely this mechanism. Because the image is a collection of pixels, it makes sense to use a GIFPlotter to produce a gif image

Strings, Input/Output, and Visualization |
325 |
file.
The code is reasonably straightforward. One feature we want to emphasize is the procedure draw_point on lines 11–13. This procedure takes two arguments: a Plotter and a Point (see Chapter 6). This procedure is invoked inside main on line 78 where it is passed a GIFPlotter named P (and a Point named X). At first glance this may appear to be a programming error: the procedure requires a Plotter but is invoked with a GIFPlotter. This mismatch of types is not a problem because a GIFPlotter is a subclass of Plotter.
Program 14.13: A program to plot points in a triangle by a random method.
1 #include <iostream>
2#include <fstream>
3 #include "plotter.h"
4#include "Point.h"
5 #include "uniform.h"
6using namespace std;
7
8const char* IMAGE_FILE = "dance.gif";
9
10// Draw a point on a plotter.
11void draw_point(Plotter& P, const Point& X) {
12P.fpoint(X.getX(), X.getY());
13}
14
15int main(int argc, char** argv) {
16// check that user specified number of points
17if (argc < 2) {
18cerr << "Usage: " << argv[0] << " npoints" << endl;
19return 1;
20}
21
22 int NPOINTS;
23
24// convert 2nd arg to an integer; make sure its positive
25NPOINTS = atoi(argv[1]);
26if (NPOINTS < 1) {
27cerr << "Usage: " << argv[0] << " npoints" << endl;
28cerr << "where npoints is a positive integer" << endl;
29return 1;
30}
31
32// Set the corners of the triangle
33Point A(0.,0.);
34Point B(1.,0.);
35Point C(0.5, sqrt(3.)/2.);
36
37 Point X; // the dancing point
38
39// Construct the plotter
40PlotterParams params;
41ofstream pout(IMAGE_FILE);
42GIFPlotter P(cin, pout, cerr, params);
43