

7. NMR of compounds containing NH2, NO2 and NO groups |
325 |
|||||||
|
|
8 |
|
|
|
21 |
|
|
|
|
NH2 |
9 |
|
|
CH3 |
|
|
|
|
|
|
15 |
O |
|
|
|
|
|
|
CH2 |
10 |
|
|
||
3 N |
|
14 |
20 |
|
||||
5 |
|
|
|
|
|
|||
|
|
|
|
|
|
|
|
|
7 2 |
|
6 |
|
11 |
|
|
CH3 |
|
H N |
|
N |
|
|
13 |
O 19 |
|
|
|
1 |
+ |
|
|
12 |
18 |
|
|
|
|
H |
|
|
O |
|
|
|
|
|
|
|
|
16 CH3 |
|
|
|
|
|
|
|
|
17 |
|
|
|
|
2 N 3 |
−N |
|
13 |
12 |
|
||
|
|
8 |
|
|||||
|
10 |
|
7 |
SO2 |
|
NH2 |
|
|
|
|
|
|
|
||||
|
5 |
|
|
|
|
|
11 |
|
6 |
4 |
|
|
9 |
10 |
|
||
|
|
|
|
|||||
CH3 |
|
|
|
|
|
|
|
|
(14)
the signals of all three carbons were clearly split into two peaks, one being assigned to the ˛-helix structure and the other to the antiparallel pleated-sheet structure106.
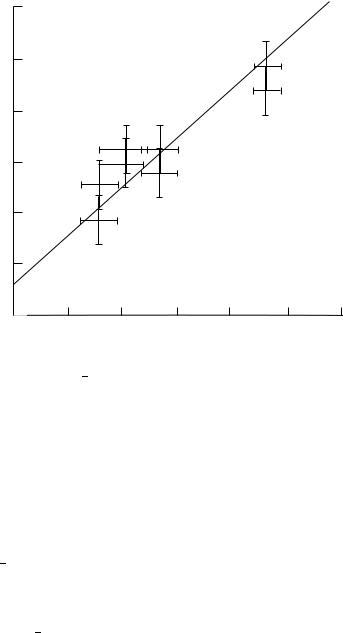
High-resolution dipolar/chemical shift NMR experiments for solids have been used to measure the N H bond distances in a series of compounds108, many of which have also been studied by neutron diffraction, such as 15N glycine. The results demonstrate that, when recorded carefully, with attention paid to the experimental procedures described, two-dimensional/chemical shift spectra can yield bond distances accurate to within 0.005 A,˚ and the mutual orientation of dipolar and chemical shift tensors accurate to within 3°. A comparison of N H bond distances obtained by solid state NMR techniques with distances obtained by single-crystal neutron-diffraction techniques is shown in Figure 5. The bond lengths obtained by NMR are consistently 0.0035 A˚ longer than those measured by neutron-diffraction techniques, owing mainly to differences in the time scales of the measurements (NMR events are observed over intervals usually no shorter than tens of microseconds whereas neutron-diffraction events require only picoseconds), and in the distance function sampled (NMR measures the dipole dipole interactions, which are proportional to 1/r3, but diffraction experiments measure scattering amplitudes, which are proportional to 1/r).
In systems from which only a polycrystalline or an amorphous sample can be obtained, NMR becomes the method of choice since the diffraction technique requires single crystal samples.
Double-cross-polarization 15N MAS NMR has been employed109 to study the transport and metabolism of D- and L-alanine by aerococcus viridans.
E. Relationship of Aromatic Nitro Group Torsion Angles with 17O Chemical Shifts
In 1985 Boykin and Balakrishnan110 showed for the first time that the 17O chemical shifts of the nitro group vary with the torsion angle that describes the orientation of the group relative to the atoms of the aromatic ring. The very large chemical shift range for this nucleus makes it particularly attractive for examining the influences of subtle changes in molecular structure despite its poor receptivity. The large quadrupole moment normally results in very short relaxation times: on the one hand these broaden the lines, but on the
326 |
Edward W. Randall and Christiana A. Mitsopoulou |
||
|
A |
B C |
D |
|
1.1 |
|
|
Bond length (NMR)
1.0
1.0 |
1.1 |
Bond length (neutron)
(Å)
FIGURE 5. Comparison of 15N 1H bond distances obtained by solid state NMR techniques with distances obtained by single-crystal neutron-diffraction techniques. Reprinted with permission from Reference 108. Copyright (1987) American Chemical Society
other they also permit very rapid accumulation of spectra, which offsets the sensitivity problem.
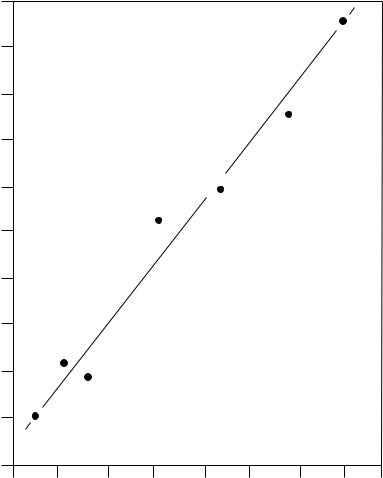
The 17O chemical shifts of a series of sterically crowded aromatic nitro compounds and their torsion angles between the aromatic rings and the nitro groups are given in Table 23. A comparison of the chemical shifts of nitrobenzene. 1-nitronaphthalene and 9-nitroanthracene reveals a substantial deshielding trend. Although an increase in overlap between the nitro group and the aromatic ring with increasing ring size would be expected to result in increasing single bond character of the nitro function and should be reflected by a shielding trend, the opposite is observed. This corresponds to increasing nitrogen oxygen double bond character of the respective nitro groups, which can be explained in terms of a rotation of the nitro group relative to the plane of the aromatic ring.
The apparent relationship between torsion angle and 17O chemical shift has been explored further by examination of the data for several ortho alkyl-substituted nitrobenzenes and dinitrobenzenes (Table 23). The deshielding values of the shifts reflect increasing nitrogen oxygen double bond character, which is expected as the nitro group is rotated from the plane of the aromatic ring.
Figure 6 shows a good correlation between torsional angle and 17O chemical shift. The empirical equation 7 has been established by Boykin and Balakrishnan110, between nitro group torsion angles (q in degrees) and the chemical shifts of the 17O resonance of the
7. NMR of compounds containing NH2, NO2 and NO groups |
327 |
||||
TABLE 23. |
17O chemical shifts for aromatic nitro compounds |
|
|
|
|
υ17O (ppm) |
|
Compound |
Torsion angle (deg) |
||
575 |
nitrobenzene |
|
0 |
|
|
605 |
1-nitronapthalene |
|
|
|
|
637 |
9-nitroanthracene |
|
85 |
|
|
575 |
2-nitronapthalene |
|
|
|
|
612 |
1,5-dinitronapthalene |
|
48.7 |
|
|
609,578 |
1,3-dinitronapthalene |
|
|
|
|
599 |
1,8-dinitronaphthalene |
43 |
|
|
|
602 |
o-nitrotoluene |
|
|
|
|
572 |
p-nitrotoluene |
|
|
|
|
597 |
2,4-dimethylnitrobenzene |
|
|
|
|
612 |
2,3-dimethylnitrobenzene |
|
|
|
|
629 |
2,6-dimethylnitrobenzene |
|
|
|
|
628 |
2,4,6-trimethylnitrobenzene |
65 |
|
|
|
657 |
2,4,6-tri-t-butylnitrobenzene |
|
|
|
|
584 |
p-dinitrobenzene |
|
8 |
|
|
579 |
m-dinitrobenzene |
|
11 |
|
|
609 |
o-dinitrobenzene |
|
|
|
|
627 |
N-[2-(dimethylamino)ethyl]-3-methyl-2- |
69 |
|
|
|
|
nitrobenzamide hydrochloride |
|
|
|
|
629 |
N-[2-(dimethylamino)ethyl]-3-ethyl-2-nitrobenzamide |
72 |
|
|
|
|
hydrochloride |
|
|
|
|
632 |
N-[2-(dimethylamino)ethyl]-3-isopropyl-2- |
76 |
|
|
|
|
nitrobenzamide hydrochloride |
|
|
|
|
644 |
N-[2-(dimethylamino)ethyl]-3-t-butyl-2- |
92 |
|
|
|
|
nitrobenzamide hydrochloride |
|
|
|
|
|
nitroquinolines: |
|
|
|
|
|
H |
CH3 |
|
|
|
|
N |
N |
|
|
|
|
5 |
CH3 |
|
|
|
|
6 |
|
|
|
|
|
3 |
|
|
|
|
|
7 |
2 |
|
|
|
|
N |
|
|
|
|
561 |
8 |
|
0 |
|
|
3-nitro |
|
|
|
||
646 |
2-methyl-3-nitro |
|
100 |
|
|
628 |
5-nitro |
|
79 |
|
|
646 |
6-methyl-5-nitro |
|
100 |
|
|
569 |
6-nitro |
|
10 |
|
|
596 |
7-methyl-6-nitro |
|
42 |
|
|
579 |
7-nitro |
|
22 |
|
|
612 |
8-methyl-7-nitro |
|
60 |
|
|
627 |
8-nitro |
|
78 |
|
|
633 |
7-methyl-8-nitro |
|
85 |
|
|
|
nitroacridines: |
|
|
|
|
|
H |
CH3 |
|
|
|
|
N |
N |
|
|
|
CH3
2
3
N
(continued overleaf )
328 |
Edward W. Randall and Christiana A. Mitsopoulou |
|
|
|
TABLE 23. |
(continued) |
|
|
|
|
|
|
υ17O (ppm) |
Compound |
Torsion angle (deg) |
605 |
1-nitro |
52 |
|
567 |
2-nitro |
7 |
|
582 |
3-nitro |
25 |
|
623 |
4-nitro |
73 |
|
|
|
|
|
90 |
|
|
|
|
|
|
3 |
|
70 |
|
angleTorsionbetween nitroandringsgroups (degrees) |
|
13 |
30 |
|
|
|
50 |
5 |
|
|
7 |
aromatic |
|
|
16
10
15
0
1
570 |
590 |
610 |
630 |
650 |
17O Chemical shift (ppm)
FIGURE 6. Plot of torsional angle between aromatic rings and nitro groups vs the 17O chemical shift (ppm) data. Reprinted with permission from D. J. Craik, G. C. Levy and R. T. C. Brownlee, J. Org. Chem., 48, 1601 (1983). Copyright (1983) American Chemical Society

7. NMR of compounds containing NH2, NO2 and NO groups |
329 |
nitro group (d): |
|
D 1.29υ š 0.24 739 |
7 |
Boyd and coworkers111 used equation 7 to determine the nitro-group torsion angles by 17O NMR spectroscopy for a series of 4-(alkylamino)-nitroquinolines (15) and their ortho methyl-substituted analogues, but they noticed that the range of 17O NMR chemical shifts seen with these N-heterocyclic compounds is larger (561 646 ppm) than the range for the nitroaromatics110 (Table 23).
H |
CH3 |
N |
N |
5 |
CH3 |
|
|
6 |
3 |
7 |
2 |
N |
R |
8 |
(15)
Whereas most of the NMR-determined changes in torsion angle on addition of an ortho methyl group were in the expected range, two were not. In 2-methyl-3-nitroquinoline, addition of a 2-methyl group to a 3-nitro derivative led to a change in chemical shift of 85 ppm, indicating (by equation 7) a change in nitro-group torsion angle of > 90°. In 7- methyl-8-nitroquinoline, addition of a 7-methyl group to 8-nitroquinoline gave very little apparent change. So the crystallographic torsion angles were used to calculate a modified version (equation 8) of the equation111:
D 1.18 š0.13 υ 661 |
8 |
Equation 8 was then used to compute torsional angles for the nitroquinolines. Unhindered nitro groups gave values close to coplanar for the aromatic ring as expected, whereas addition of one ortho methyl group increased the torsion angle to ca 30°. The 5-nitro derivative had a nitro-group torsion angle of ca 80°, due to peri interactions with the 4-aminoalkyl side-chain.
It is known112 that nitro groups ortho to primary or secondary amines are usually planar owing to hydrogen bonding. However, when the ortho group has a tertiary sp3 nitrogen113 115 the torsion angle can increase by more than 40°, and changing the ortho group to an sp nitrogen116 can further increase the nitro-group torsion angle by ca 50°.
The 8-nitroquinoline derivative is the first example of a nitroarene with a peri aromatic nitrogen substituent, and the torsion angle of 70° 78° (measured by both NMR spectroscopy and X-ray crystallography) indicates the substantial steric effect of the nitrogen lone pair. Addition of a 7-methyl group at the other ortho position of the nitro group of this compound results in the nitro group being virtually at right angles to the ring (torsion angle 86°).
Using the same equation (8) Boyd and coworkers117 calculated the torsion angles in a series of 3-nitro-4-alkylbenzamides (16). 17O chemical shifts indicated similar amide torsion angles (from 35° to 45°) as the alkyl group varied from hydrogen to t-butyl, but widely differing nitro-group torsion angles; from 36° (hydrogen) to 92° (t-butyl) (Table 23). Crystal structures of the isopropyl and t-butyl derivatives indicate amidegroup torsion angles (50° and 64°) somewhat larger than those predicted by 17O NMR, and nitro-group torsion angles (59° and 65°, respectively) considerably smaller than those
330 |
Edward W. Randall and Christiana A. Mitsopoulou |
predicted by 17O NMR (75° and 92°, respectively). These results support earlier data111 that 17O chemical shifts predict erroneously large nitro-group torsion angles in non-rigid but sterically crowded molecules, because of additional contributions to the shift resulting from van der Waals repulsions.
R
NO2
H |
|
N |
CH3 |
|
N |
CH3
O
(16)
VI. IMAGING
In 1982 Hall and Sukumar118 demonstrated the ability to select species processing distinct chemical shifts in images, where the chemical shifts do not overlap, using capillaries of water, acetone, benzene and methylene chloride. Since then, volume-localized spectroscopy and chemical-shift imaging have been applied to a number of medical and non-medical problems. Most of these studies, however, are focused on the 1H and 31P nucleides, especially those investigations which are clinically oriented119,120.
With respect to non-clinical studies, however, such as those which are biological or chemical, other nuclei like 13C, 14N or 15N come more easily into consideration. And although it is true that there were then some papers with 13C images reported in the literature121 before 1988 and one 14N image (liquid nitrogen)122 was published in that year, it was not until 1992 that chemically shifted 14N images were reported123, and 15N images from samples at either natural abundance or enriched concentration were obtained, at least in the liquid phase124. The separated images were for the ammonium and nitrate ions, which each give a narrow line, and for the different types of nitrogen in the azide ion, namely at the central and terminal positions. These give slightly broader resonances than do the other ions, and with conventional imaging spectrometers which employ small switchable gradient sets that are unshielded some (or all!) of the image intensity may be lost.
The latest imaging work in high field gradients, however, has shown that broad lines may be imaged easily even for solids, so that imaging of 14N should no longer be a problem despite the short values for T2.
The steady-state free-procession (SSFP) technique was used with no NOE, and in the case of aniline the T1 of the 15N was reduced by addition of chromium acetylacetate as
a relaxation reagent to the sample. The 15N spectrum of aniline showed a single broad line ( 1/2 D 42 Hz) in which, because of proton exchange125,126, there is no evidence of 15N-1H coupling (J D 80 Hz).
As in spectroscopy, there are two ways of imaging 15N (and 14N), the direct and the indirect method. In the direct mode the simplest enhancement is available with 15Nf1Hgd.r. experiments in which the Overhauser effect is used to advantage. The maximum value of
the effect is 3.93 for 1Hf15Ng. The NOE is negligible for 14N, as we have seen already. The first NOE-enhanced 15N image which was reported127 was for aniline-15N. It is
interesting, because in this sample the exchange processes cause partial collapse of the 1H
7. NMR of compounds containing NH2, NO2 and NO groups |
331 |
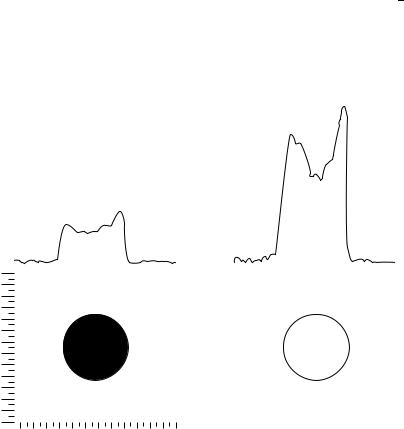
and the 15N multiplets to broad lines127. These multiplets are observed only under very dry conditions125. A single but still broadened 15N line ( D 20 Hz) was obtained for this sample (a 99.5% enriched sealed aniline-15N sample). Irradiation at the 1H resonance frequency of the nearly collapsed NH2 proton doublet ( 1/2 D 42 Hz) at sufficient power caused sharpening of the 15N resonance to 18 Hz, but more importantly results in its enhancement by a factor of 3.7. 1D profiles and 2D images were obtained in the magnitude mode (see Figure 7). The total acquisition time was 16 min, which resulted in an S/N ratio for the profile of approximately 10:1.
Phenylhydrazine was used for 15N images enhanced by the NOE at natural abundance. As in the case of aniline, proton exchange leads to nearly complete collapse of the 15N H couplings for both the NH and NH2 groups. The two groups are different, however, in that the process is more rapid for the NH2 than for the NH group and so leads to a narrower 15N line (16 Hz at 20 °C) compared with the NH2 value of 80 Hz in the single-resonance
experiment. The NOE values are nearly equal128 at a value of about 2.9, and the T1 values for 15N were measured as 8.40 š 0.1 s (for NH) and 3.91 š 0.01 s (for NH2).
FI |
|
|
|
|
|
|
FI |
|
|
|
|
|
|
|
|
|
|
|
|
|
|
|
|
|
|
|
|
|
|
|
|
|
|
|
|
|
|
|
|
|
|
|
|
|
|
|
|
|
|
|
|
|
|
|
|
|
|
|
|
|
|
|
|
|
|
|
|
|
|
|
|
|
|
|
|
|
|
|
|
|
|
|
|
|
|
|
|
|
|
|
|
|
|
|
|
|
|
|
|
|
|
|
|
|
|
|
|
|
|
|
|
|
|
|
|
|
|
||
|
|
|
|
|
|
|
|
|
|
|
|
|
|
|
|
|
|
|
|
|
|
|
|
|
|
|
|
|
|
|
|
|
|
|
|
|
|
|
|
|
|
|
|
|
|
|
|
|
|
|
|
|
|
|
|
|
|
||
|
|
|
|
|
|
|
|
|
|
|
|
|
|
|
|
|
|
|
|
|
|
|
|
|
|
|
|
|
|
|
|
|
|
|
|
|
|
|
|
|
|
|
|
|
|
|
|
|
|
|
|
|
|
|
|
|
|||
|
|
|
|
|
|
|
|
|
|
|
|
|
|
|
|
|
|
|
|
|
|
|
|
|
|
|
|
|
|
|
|
|
|
|
|
|
|
|
|
|
|
|
|
|
|
|
|
|
|
|
|
|
|
|
|
|
|||
(Ca) |
|
|
|
|
|
|
(Ca) |
|
|
|
|
|
|
|
|
|
|
|
|
|
|
|
|
|
|
|
|
|
|
|
|
|
|
|
|
|
|
|
|
|
|
|
|
|
|
|
|
|
|
|
|
|
|
|
|
|
|
|
|
|
|
|
|
|
|
|
|
|
|
|
|
|
|
|
|
|
|
|
|
|
|
|
|
|
|
|
|
|
|
|
|
|
|
|
|
|
|
|
|
|
|
|
|
|
|
|
|
|
|
|
|
|
|
|
|
|
|||
0.6 |
|
|
|
|
|
|
0.6 |
|
|
|
|
|
|
|
|
|
|
|
|
|
|
|
|
|
|
|
|
|
|
|
|
|
|
|
|
|
|
|
|
|
|
|
|
|
|
|
|
|
|
|
|
|
|
|
|
|
|
|
|
|
|
|
|
|
|
|
|
|
|
|
|
|
|
|
|
|
|
|
|
|
|
|
|
|
|
|
|
|
|
|
|
|
|
|
|
|
|
|
|
|
|
|
|
|
|
|
|
|
|
|
|
|
|
|
|
|
|
||
0.8 |
|
|
|
|
|
|
0.8 |
|
|
|
|
|
|
|
|
|
|
|
|
|
|
|
|
|
|
|
|
|
|
|
|
|
|
|
|
|
|
|
|
|
|
|
|
|
|
|
|
|
|
|
|
|
|
|
|
|
|
|
|
|
|
|
|
|
|
|
|
|
|
|
|
|
|
|
|
|
|
|
|
|
|
|
|
|
|
|
|
|
|
|
|
|
|
|
|
|
|
|
|
|
|
|
|
|
|
|
|
|
|
|
|
|
|
|
|
|
|
||
1.0 |
|
|
|
|
|
|
1.0 |
|
|
|
|
|
|
|
|
|
|
|
|
|
|
|
|
|
|
|
|
|
|
|
|
|
|
|
|
|
|
|
|
|
|
|
|
|
|
|
|
|
|
|
|
|
|
|
|
|
|
|
|
|
|
|
|
|
|
|
|
|
|
|
|
|
|
|
|
|
|
|
|
|
|
|
|
|
|
|
|
|
|
|
|
|
|
|
|
|
|
|
|
|
|
|
|
|
|
|
|
|
|
|
|
|
|
|
|
|
|
||
1.2 |
|
|
|
|
|
|
1.2 |
|
|
|
|
|
|
|
|
|
|
|
|
|
|
|
|
|
|
|
|
|
|
|
|
|
|
|
|
|
|
|
|
|
|
|
|
|
|
|
|
|
|
|
|
|
|
|
|
|
|
|
|
|
|
|
|
|
|
|
|
|
|
|
|
|
|
|
|
|
|
|
|
|
|
|
|
|
|
|
|
|
|
|
|
|
|
|
|
|
|
|
|
|
|
|
|
|
|
|
|
|
|
|
|
|
|
|
|
|
|
||
1.4 |
|
|
|
|
|
|
1.4 |
|
|
|
|
|
|
|
|
|
|
|
|
|
|
|
|
|
|
|
|
|
|
|
|
|
|
|
|
|
|
|
|
|
|
|
|
|
|
|
|
|
|
|
|
|
|
|
|
|
|
|
|
|
|
|
|
|
|
|
|
|
|
|
|
|
|
|
|
|
|
|
|
|
|
|
|
|
|
|
|
|
|
|
|
|
|
|
|
|
|
|
|
|
|
|
|
|
|
|
|
|
|
|
|
|
|
|
|
|
|
||
1.6 |
|
|
|
|
|
|
1.6 |
|
|
|
|
|
|
|
|
|
|
|
|
|
|
|
|
|
|
|
|
|
|
|
|
|
|
|
|
|
|
|
|
|
|
|
|
|
|
|
|
|
|
|
|
|
|
|
|
|
|
|
|
|
|
|
|
|
|
|
|
|
|
|
|
|
|
|
|
|
|
|
|
|
|
|
|
|
|
|
|
|
|
|
|
|
|
|
|
|
|
|
|
|
|
|
|
|
|
|
|
|
|
|
|
|
|
|
|
|
|
||
1.8 |
|
|
|
|
|
|
1.8 |
|
|
|
|
|
|
|
|
|
|
|
|
|
|
|
|
|
|
|
|
|
|
|
|
|
|
|
|
|
|
|
|
|
|
|
|
|
|
|
|
|
|
|
|
|
|
|
|
|
|
|
|
|
|
|
|
|
|
|
|
|
|
|
|
|
|
|
|
|
|
|
|
|
|
|
|
|
|
|
|
|
|
|
|
|
|
|
|
|
|
|
|
|
|
|
|
|
|
|
|
|
|
|
|
|
|
|
|
|
|
||
2.0 |
|
|
|
|
|
|
2.0 |
|
|
|
|
|
|
|
|
|
|
|
|
|
|
|
|
|
|
|
|
|
|
|
|
|
|
|
|
|
|
|
|
|
|
|
|
|
|
|
|
|
|
|
|
|
|
|
|
|
|
|
|
|
|
|
|
|
|
|
|
|
|
|
|
|
|
|
|
|
|
|
|
|
|
|
|
|
|
|
|
|
|
|
|
|
|
|
|
|
|
|
|
|
|
|
|
|
|
|
|
|
|
|
|
|
|
|
|
|
|
||
2.2 |
|
|
|
|
|
|
2.2 |
|
|
|
|
|
|
|
|
|
|
|
|
|
|
|
|
|
|
|
|
|
|
|
|
|
|
|
|
|
|
|
|
|
|
|
|
|
|
|
|
|
|
|
|
|
|
|
|
|
|
|
|
|
|
|
|
|
|
|
|
|
|
|
|
|
|
|
|
|
|
|
|
|
|
|
|
|
|
|
|
|
|
|
|
|
|
|
|
|
|
|
|
|
|
|
|
|
|
|
|
|
|
|
|
|
|
|
|
|
|
||
2.4 |
|
|
|
|
|
|
2.4 |
|
|
|
|
|
|
|
|
|
|
|
|
|
|
|
|
|
|
|
|
|
|
|
|
|
|
|
|
|
|
|
|
|
|
|
|
|
|
|
|
|
|
|
|
|
|
|
|
|
|
|
|
2.4 |
1.8 |
1.2 |
0.8 |
0.0 |
2.4 |
1.8 |
1.2 |
0.8 |
0.0 |
||||||||||||||||||||||||||||||||||||||||||||||||||
|
|
|
F2 (ca) |
|
|
|
|
|
|
|
|
|
|
|
|
|
|
|
|
|
|
|
|
|
|
|
|
F2 (ca) |
|
|
|
|
|
|
|
|
|
|
|
|
|
|
|
|
|
|
|
|
|
||||||||||
|
|
|
(a) |
|
|
|
|
|
|
|
|
|
|
|
|
|
|
|
|
|
|
|
|
|
|
|
|
|
|
(b) |
|
|
|
|
|
|
|
|
|
|
|
|
|
|
|
|
|
|
|
|
|
||||||||
FIGURE 7. Fourier 2D spin-echo 15N images of aniline-15N without slice selection. A trace through the centre of each image is also shown. Echo time (TE) D 35 ms; pulse width D 55 ms, pulse angle
(a) D 90°, number of transients per phase-encoding step (NT) D 16, number of phase-encoding steps (NPE) D 64, number of data points collected in F2(NP) D 256, repetition time (TR) D 10.05 s, in-plane spatial resolution D 0.39ð 0.39 mm. (a) Single resonance; total imaging time D 2 h 52 min. (b) Double resonance (15Nf1Hg on during relaxation delay of 10 s only); total imaging time D 2 h 52 min127

332 |
Edward W. Randall and Christiana A. Mitsopoulou |
It is established therefore that imaging of 15N by direct methods is feasible and can be improved by 15Nf1Hg experiments even when the 15N resonance is broadened by rapid exchange of attached protons. But if the compound of interest has resolved J(15N 1H) interactions, then indirect detection by a SEDOR J1Hf15Ng experiment for liquids offers much greater sensitivity129 131.
VII. REFERENCES
1.(a) M. Witanowski, L. Stefaniac and G. A. Webb, Nitrogen NMR Spectroscopy, in Annual Reports on NMR Spectroscopy, 25, 2 (1993).
(b)M. Witanowski, L. Stefaniac and G. A. Webb, Nitrogen NMR Spectroscopy, in Annual Reports on NMR Spectroscopy, 18, 2 (1986).
(c)M. Witanowski and G. A. Webb (Eds), Nitrogen NMR, Plenum Press, London and New York,
1973.
2. G. C. Levy and R. L. Lichter, Nitrogen-15 Nuclear Magnetic Resonance Spectroscopy, Wiley Interscience, New York, 1979.
3.J. Mason, in Multinuclear NMR (Ed. J. Mason), Plenum Press, New York, 1987, p. 355.
4.D. G. Gillies and E. W. Randall, Nitrogen NMR, in Progress in NMR, 6, 119 (1970).
5.W. von Philipsborn and R. Mueller, Angew, Chem, Int. Ed. Engl., 25, 383 (1986),
6.G. J. Martin, M. L. Martin and J. P. Gouesnard, in NMR Basic Principles and Progress 18, 15-N NMR Spectroscopy, Springer-Verlag, Heidelberg, 1981.
7.W. McFarlane and H. C. E. McFarlane, in Multinuclear NMR (Ed. J. Mason), Plenum Press, New York, 1987, p. 403.
8.D. W. Boykin, 17O-NMR Spectroscopy in Organic Chemistry (Ed. D. W. Boykin), CRC Press, Boca Raton, 1990.
9.E. Curzon, B. T. Golding, C. Pierpoint and B. W. Waters, J. Organomet. Chem., 262, 263 (1984).
10.B. Gordillo and E. L. Eliet, J. Am. Chem. Soc., 113, 2172 (1991).
11.R. R. Ernst, G. Bodenhausen and A. Wokaum, Principles of Nuclear Magnetic Resonance in One and Two Frequency Dimensions, Clatendon Press, Oxford, 1987.
12.D. Shaw, Fourier Transform NMR Spectroscopy, Studies in Physical and Theoretical Chemistry, Vol. 30, 2nd ed., Elsevier, Amsterdam, 1984.
13.R. Freeman A Handbook of Nuclear Magnetic Resonance, Longman, Harlow, 1988.
14.R. K. Harris and B. E. Mann, NMR and the Periodic Table, Academic Press, London, 1978.
15.J. P. Gouesnard and J. Dorie, Nouv. J. Chim., 6, 143 (1982); J. Dorie and J. P. Gouesnard, J. Chim. Phys. Phys.-Chim. Biol., 82, 369 (1985).
16.R. J. Abraham and P. Loftus in Proton and Carbon-13 NMR Spectroscopy, Heyden, London,
1978.
17. C. N. R. Rao in The Chemistry of the Nitro and Nitroso Groups, Part 1 (Ed. H. Feuer), Wiley Interscience, New York, 1969, p. 79, p. 137 and references cited therein.
18.J. D. Memory and N. K. Wilson, NMR of Aromatic Compounds, Wiley, New York, 1982.
19.G. C. Levy, R. L. Lichter and G. L. Nelson, Carbon-13 Nuclear Magnetic Resonance Spec-
troscopy, 2nd ed., Wiley Interscience, New York, 1980, pp. 111 112.
20. E. D. Becker, High Resolution NMR Theory and Chemical Applications, 2nd ed., Academic Press, New York, 1980.
21.D. E. Leyden and R. H. Cox, in Analytical Applications of NMR, Chemical Analysis Series, Vol 48 (Eds. P. J. Elving and J. D. Winefordner), Wiley Interscience, New York, 1977.
22.E. Breitmaier and W. Voelter, Carbon-13 NMR Spectroscopy, 3rd completely rev. ed., VCH, Weinheim, New York, 1987, pp. 319, 320.
23.D. F. Ewig, Org. Magn. Reson., 12, 499 (1979).
24. D. F. Ewing, in Correlation Analysis in Chemistry: Recent Advances (Eds. J. Shorter and
N. B. Chapman), Chap. 8, Plenum Press, New York, 1978.
25.W. J. Hehre, R. W. Taft and R. D. Topsom, Prog. Phys. Org. Chem., 12, 159 (1976).
26.J. Bromilow, R. T. C. Brownlee, V. O. Lopez and R. W. Taft, J. Org. Chem., 44, 4766 (1979).
27.H. M. Hugel, D. P. Kelly, R. J. Spear, J. Bromilow, R. T. C. Brownlee and D. J. Craik, Aust. J. Chem., 32, 1511 (1979).
28.G. J. Martin, M. L. Martin and S. Odiot, Org. Magn. Reson., 7, 2 (1975).
29.C. Hansch, A. Leo and R. W. Taft, Chem. Rev., 91, 165 (1991).

7. NMR of compounds containing NH2, NO2 and NO groups |
333 |
30.Reference 2, pp. 53 57.
31.M. P. Sibi, E. C. Prince, J. LeMelle and R. L. Lichter, Spectrosc. Int. J., 2, 198 (1983).
32.M. P. Sibi and R. L. Lichter, J. Org. Chem., 42, 2999 (1977).
33.C. Yamagami, N. Takao and Y. Takeuchi, Aust. J. Chem., 41, 1 (1988).
34.C. Yamagami, N. Takao, T. Nishioka, T. Fujita and Y. Takeuchi, Org. Magn. Reson., 22, 439 (1984).
35.Reference 2, p. 220.
36.M. P. Sibi and R. L. Lichter, J. Org. Chem., 42, 2999 (1977).
37.D. M. Kanjia, J. Mason, I. A. Stenhouse, R. E. Banks and N. D. Venayak, J. Chem. Soc., Perkin Trans. 2, 975 (1981).
38.G. G. Furin, A. I. Rezvukhin, M. A. Fedotov and G. G. Yakobson, J. Fluorine Chem., 22, 231 (1983); G. G. Furin, M. A. Fedotov, G. G. Yakobson and A. V. Zibarev, J. Fluorine Chem., 28, 273 (1985).
39.T. Yokoyama, I. Hamazone, M. Mishima, M. J. Kamlet and R. W. Taft, J. Org. Chem., 52, 163 (1987).
40.R. W. Taft and R. D. Tompson, Prog. Phys. Org. Chem., 16, 1 (1987).
41.M. Mishima, R. T. McIver, R. W. Taft, F. G. Bordwell and W. N. Olmstead, J. Am. Chem. Soc., 106, 2717 (1984).
42.T. Yokoyama, T. Komaki, H. Sato, R. W. Taft and F. Anvia, J. Org. Chem., 54, 3983 (1989),
43.M. J. Kamlet and R. W. Taft, J. Org. Chem., 47, 1734 (1982).
44.J. Bromilow, R. T. C. Brownlee, D. J. Craik, M. Sadec and R. W. Taft, J. Org. Chem., 45, 2429 (1980).
45.R. D. Batts and G. Pallos, Org. Magn. Reson., 13, 349 (1980).
46.Reference 2, pp. 53 57.
47.W. Bremser, J. I. Kroschwitz and J. D. Roberts, J. Am. Chem. Soc., 91, 6189 (1969).
48.D. T. Clark and J. D. Roberts, J. Am. Chem. Soc., 88, 745 (1966).
49.M. Witanowski, L. Stefaniak and G. A. Webb, J. Chem. Soc. (B), 1065 (1967).
50.M. Witanowski, W. Sicinska, Z. Biedrzycka and G. A. Webb, Magn. Reson. Chem., 31, 916 (1993).
51.H. A. Christ and P. Diehl, Helv. Phys. Acta, 36, 170 (1963); H. A. Christ. Helv. Phys. Acta, 33, 572 (1960).
52.M. Katoh, T. Sugawara, Y. Kawada and H. Iwamura, Bull. Chem. Soc. Jpn., 52, 3475 (1979).
53.T. E. St. Amour, M. I. Burgar, B. Valentine and D. Fiat, J. Am. Chem. Soc., 103, 1128 (1981).
54.K. B. Lipkowitz, J. Am. Chem. Soc., 104, 2647 (1982).
55.R. R. Fraser, A. J. Ragauskas and J. B. Stothers, J. Am. Chem. Soc., 104, 6475, (1982).
56.D. J. Craik, G. C. Levy and R. T. C. Brownlee, J. Org. Chem., 48, 1601 (1983).
57.D. J. Craik, G. C. Wenz and R. T. C. Brownlee, J. Org. Chem., 48, 1601 (1983).
58.D. W. Boykin, A. L. Baumstark, P. Balakrishnan, A. Perjessy and P. Hrnciar, Spectrochim. Acta, 40A, 887 (1984).
59.G. G. Furin, A. I. Rezvukhin, M. A. Fedotov and G. G. Yacobson, J. Fluorine Chem., 22, 231 (1983).
60.K. G. Orrell, V. Sik and D. Stephenson, Magn. Reson. Chem., 25, 1007 (1987).
61.H. Dahn, P. Pechy and R. Floegel, Helv. Chim. Acta, 77, 306 (1994).
62.G. Cerioni, J. Phys. Org. Chem., 4, 260 (1991).
63.L. O. Anderson and J. Mason, J. Chem. Soc., Dalton Trans., 202 (1974).
64.D. W. Boykin, Spectrosc. Lett., 23, 1133 (1990).
65.R. Bonnett, R. Holleyhead, B. L. Johnson and E. W. Randall, J. Chem. Soc., Perkin Trans. 1, 2261 (1975).
66.H. A. Christ, P. Diehl, H. R. Schneider and H. Dahn, Helv. Chim. Acta, 44, 865 (1961).
67.T. Axenrod, P. S. Pregosin, M. J. Wieder, R. B. Bradley, E. D. Becker and G. A. Milne, J. Am. Chem. Soc., 93, 6536 (1971).
68.R. E. Wasylishen, Can. J. Chem., 54, 833 (1976).
69.T. Axenrod, M. J. Wieder, Tun Khin, G. A. Webb, H. J. C. Yeh and S. Bulusu, Org. Magn. Reson., 12, 1 (1979).
70.G. Binsch, J. B. Lambert, B. N. Roberts and D. J. Roberts, J. Am. Chem. Soc., 86, 5564 (1964).
71.J. M. Schulman and T. Venanzi, J. Am. Chem. Soc., 98, 4701 (1976).
72.J. M. Schulman and T. Venanzi, J. Am. Chem. Soc., 98, 6739 (1976).
73.Tun Khin and G. A. Webb, Org. Magn. Reson., 10, 175 (1977).
334 |
Edward W. Randall and Christiana A. Mitsopoulou |
74.G. A. Webb, in NMR and the Periodic Table (Eds. R. K. Harris and B. E. Mann), Academic Press, London, 1978, p. 49.
75.P. C. Lauterbur, J. Chem. Phys., 38, 1415 (1963).
76.M. S. Sibi and R. L. Lichter. J. Org. Chem., 42, 2999 (1977).
77.J. Dorie, B. Mechin and G. Martin, Org. Magn. Reson., 12, 229 (1979).
78.T. Axenrod, C. M. Watnick. M. J. Wieder, S. Dungthai, G. A. Webb, H. J. C. Yeh, S. Bulusu and M. M. King, Org. Magn. Reson. 20, 11 (1982).
79.Reference 1c, Chap. 1, p. 31.
80.Reference 2, Chap. 2, p. 108.
81.A. J. R. Bourn and E. W. Randall, Mol. Phys., 8, 567 (1964).
82.S. M. Susskind, G. E. Scuseria and R. H. Contreras, Z. Phys. Chem. (Leipzig), 266, 395 (1985).
83.V. M. S. Gil and W. von Philipsborn, Magn. Reson. Chem., 27, 409 (1989).
84.Yoshihiro Kuroda, Hohi Lee and Akio Kuwae, J. Phys. Chem., 84, 3417 (1980).
85.I. Yavari and J. D. Roberts, Org. Magn. Reson., 20, 325 (1982).
86.A. I. Resvukhin, G. G. Furin and G. G. Jakobson, Izv. Akad. Nauk SSSR, Ser. Khim., 2512 (1981).
87.V. Mlynarik, Collect. Czech. Chem. Commun., 48, 948 (1983).
88.Shoichi Ide, Kazuhisa Iwasawa, Akihiro Yoshino, Tadayoshi Yoshida and Kensuke Takashi,
Magn, Reson. Chem., 25, 675 (1987).
89.J. W. Emsley and J. C. Lindon, NMR Spectroscopy Using Liquid Crystal Solvents, Pergamon, Oxford, 1975.
90.C. L. Khetrapal and A. C. Kumar, in Advances in Magnetic Resonance (Ed. J. J. Waugh), Academic Press, New York, 1977.
91.J. M. Briggs, E. J. Rahkamma and E. W. Randall, J. Magn. Reson., 17, 55 (1975).
92.J. W. Emsley and E. W. Randall, J. Magn. Reson., 23, 481 (1976).
93.G. Fronza, R. Mondelli, F. Lelj, E. W. Randall and C. A. Veracine, J. Magn. Reson., 37, 275 (1980).
94.P. Diehl, Pure Appl. Chem., 32, 111 (1972).
95.H. Knicker, R. Frund and H. D. Ludemann, Naturwissenschaften, 80, 219 (1993).
96.E. Grech, L. Stefaniak, I. Ando, H. Yoshimizu, G. A. Webb and L. Sobczyk, Bull. Chem. Soc. Jpn., 63, 2716 (1990).
97.T. Gullion and J. Schaefer, J. Magn. Reson., 81, 196 (1989).
98.Y. Pan, T. Gullion and J. Schaefer, J. Magn. Reson., 90, 330 (1990),
99.J. R. Garbow and C. A. McWherter, J. Am. Chem. Soc., 115, 238 (1993).
100.Y. Pan and J. Schaefer, J. Magn. Reson., 90, 341 (1990).
101.B. S. A. Kumar and S. J. Opella, J. Magn. Reson., Series A, 101, 333 (1993).
102.A. E. Aliev and K. D. M. Harris, J. Am. Chem. Soc., 115, 6369 (1993).
103.M. Munowitz, W. W. Bachovchin, J. Herzfeld, C. M. Dobson and R. G. Griffin, J. Am. Chem. Soc., 104, 1192 (1982).
104.R. Fruttero, G. E. Hawkes, E. W. Randall, A. Gasco and C. J. Groombridge, J. Chem. Soc., Perkin Trans. 2, 1863 (1988).
105.H. Nakai, M. Takasuka and M. Shiro, J. Chem. Soc., Perkin Trans. 2, 1459 (1984).
106.D. Muller and H. R. Kricheldorf, Polym. Bull. (Berlin), 6, 101 (1981).
107.H. R. Kricherdorf and D. Muller, Macromolecules, 16, 615 (1983).
108.J. E. Roberts, G. S. Harbison, M. G. Munowitz, J. Herzfeld and R. G. Griffin, J. Am. Chem. Soc., 109, 4163 (1987).
109.G. S. Jacob, J. Schaefer and G. E. Wilson, Jr., J. Biol. Chem., 260, 2777 (1985).
110.P. Balakrishnan and D. W. Boykin, J. Org. Chem., 50, 3663 (1985).
111.M. Boyd, P. D. W. Boyd, G. J. Atwell, W. R. Wilson and W. A. Denny, J. Chem. Soc. Perkin Trans. 2, 579 (1992).
112.H. H. Cady, Acta Crystallogr., 23, 601 (1967).
113.A. F. Hegarty, M. T. McCormack, B. J. Hathaway and L. Hulett, J. Chem. Soc., Perkin Trans. 2, 1136 (1977).
114.J. R. Holden and C. Dickinson, J. Phys. Chem., 73, 1199 (1969).
115.C. P. Huber, Acta Crystallogr., Sect. C, 41, 1076, (1985).
116.R. E. Cobbledick, F. W. B. Einstein, N. Farrell, A. B. Gilchrist and D. Sutton, J. Chem. Soc., Dalton Trans., 373 (1977).
117.M. Boyd, H. H. Lee, R. F. Anderson and W. A. Denny, J. Chem. Soc., Perkin Trans. 2, 291 (1994).