

Enzymes (Second Edition)
.pdf300
Figure 8.16 Interactions of the dihydrofolate reductase active site with the inhibitor methotrexate (left) and the substrate dihydrofolate (right).
[Reprinted from Klebe (1994) with permission from Academic Press Limited.]
STRUCTURE—ACTIVITY RELATIONSHIPS AND INHIBITOR DESIGN |
301 |
enzyme or of the enzyme—lead inhibitor complex. Based on inspection of the crystal structure, one suggests, changes in chemical structure of the inhibitor to better engage the enzyme active site. The new compound is then synthesized and tested for inhibitory potency. Next, to determine whether the predicted interactions in fact occur, a crystal structure of the enzyme with this new inhibitor bound is obtained. This new structure is then used to search for additional changes to the inhibitor structure that might further improve potency, and the process is continued until an inhibitor of sufficient potency is obtained. This iterative structure-based inhibitor design method was used in the design and synthesis of inhibitors of thymidylate synthase reported by Appelt et al. (1991); this paper provides a good illustration of the method.
Thus, the first step to structure-based inhibitor design is to obtain a crystal or NMR structure of the target enzyme, with or without a lead inhibitor bound to it. In some cases, the determination of a crystal or NMR structure of the target protein proves problematic because of the technical difficulties associated with crystallographic and NMR methods. If the structure of a closely related enzyme has been reported, however, one can still attempt to model the three-dimensional structure of the target enzyme by means of homology modeling (Lesk and Boswell, 1992). In homology modeling one attempts to build a model of the target enzyme by superimposing the amino acid residues of the target onto the three-dimensional structure of the homologous protein whose structure has been solved. For these method to work, the target enzyme and its homologue must share at least 30% amino acid sequence identity. The accuracy of the model obtained in this way is directly related to the degree of sequence identity between the two proteins: the greater the sequence identity, the more accurate the modeled structure.
With the modeled or actual structure of the target enzyme active site in hand, the next step is to assess the active site structure in a meaningful way, to permit the use of this information to predict inhibitor binding motifs. The simple visual inspection of such structures can be augmented today with computer programs that allow the analyst to map the electrostatic potential surface of the active site, identify and localize specific types of functional group within the active site (potential acid—base groups, hydrogen-bonding acceptors or donors, etc.), and the like. When the active site has been well described, one attempts to design inhibitors with stereochemical and functional complementarity to the active site structure. Again, these activities are greatly aided by high powered computer programs that make possible the probing of complementarity between a potential inhibitor and the enzyme active site. Assessment of the stereochemical complementarity of a potential inhibitor is aided by the use of molecular dynamics simulation programs by means of which the most energetically favorable conformations of inhibitory molecules can be assessed to determine whether they will adapt a conformation that is complementary to the enzyme active site.
New programs allow one to perform free energy perturbation calculations in which a bound inhibitor is slowly mutated and the difference in calculated
302 REVERSIBLE INHIBITORS
free energy of binding between the starting and final structures determined (Marshall and Cramer, 1988). In this way, one can search for structural perturbations that will increase the affinity of an inhibitor for the enzyme active site. The complementarity of functional groups can be probed by computational methods as well. For example, the computer program GRID (Goodford, 1985) can be used to search the structure of an enzyme active site for areas that are likely to interact strongly with a particular functional group probe.
A recent example of the use of such programs comes from the studies by von Itzstein et al. (1993) aimed at designing potent inhibitors of the sialidase enzyme from influenza virus. This group started with the enzyme active site obtained from a series of crystals for the enzyme to which various sialic acid analogues were bound. Visual inspection of the cocrystal structure for the enzyme bound to the unsaturated sialic acid analogue Neu5Ac2en suggested that replacement of the 4-hydroxyl group of the substrate by an amino group might be useful. A GRID calculation was performed with a protonated primary amine group as the probe, and a ‘‘hot spot,’’ or area of likely strong interaction, was identified within the enzyme active site.
The results of this process of visual inspection and calculation suggested that replacement of the 4-hydroxyl group with an amino group would lead to much tighter binding because a salt bridge would form between the amino group and the side chain carboxylate of Glu 119 of the enzyme. Further evaluation of the computational data suggested that replacement of the 4-hydroxyl group with a guanidinyl group would even further enhance inhibitor binding by engaging both Glu 119 and Glu 227 through lateral binding of the two terminal nitrogens on this functional group. Based on these results, the 4-amino and 4-guanidino derivatives of Neu5Ac2en were synthesized and, as expected, found to be potent inhibitors of the enzyme, with K values of 50 and 0.2 nM, respectively. When the crystal structures of the enzyme bound to each of these new inhibitors was determined, the predicted modes of inhibitor interactions with the enzyme were by and large confirmed.
The design of new enzyme inhibitors, both by structure-based design methods and in the absence of enzyme structural information, is a large and growing field. We have only briefly introduced this complex and exciting area. There are many excellent sources for additional information on strategies for inhibitor design. These include several texts devoted entirely to this subject (e.g., Sandler and Smith, 1994; Gringauz, 1996). Also, most modern medicinal chemistry textbooks contain sections on SAR and inhibitor design (see, e.g., Nogrady, 1985; Dean, 1987). Finally, a number of primary journals commonly feature papers in the field of inhibitor design and SAR. These include Journal of Medicinal Chemistry (ACS), Journal of Enzyme Inhibitors, Bioorganic and Medicinal Chemistry L etters, and Journal of Computer-Aided Molecular Design.
These sources, and the specific references at the end of this chapter, will provide good starting points for the reader interested in exploring these subjects in greater depth.
STRUCTURE—ACTIVITY RELATIONSHIPS AND INHIBITOR DESIGN |
303 |
8.7 SUMMARY
In this chapter we described the modes by which an inhibitor can bind to an enzyme molecule and thus render it inactive. Graphical methods were introduced for the diagnosis of the mode of inhibitor interaction with the enzyme on the basis of the effects of that inhibitor on the apparent values of the kinetic constants K and V . Having thus identified the inhibitor modality, we described methods for quantifying the inhibitor potency in terms of K , the dissociation constant for the enzyme—inhibitor complex.
Also in this chapter, we introduced some of the physicochemical determinants of enzyme—inhibitor interactions and saw how these could be systematically varied for the design of more potent inhibitors. Finally we introduced the concept of structure-based inhibitor design in which the crystal or NMR structure of the target enzyme is used to aid the design of new inhibitor molecules in an iterative process of enzyme—inhibitor structure determination, new inhibitor design and synthesis, and quantitation of new inhibitor potency.
REFERENCES AND FURTHER READING
Appelt, K., Bacquet, R. J., Bartlett, C. A., Booth. C. L. J., Freer, S. T., Fuhry, M. A. M., et al. (1991) J. Med. Chem. 34, 1925.
Blundell, T. L., Cooper, J., Foundling, S. I., Jones, D. M., Atrash, B., and Szelke, M.
(1987) Biochemistry 26, 5586.
Chaiken, I., Rose, S., and Karlsson, R. (1991) Anal. Biochem. 201, 197. Cheng, Y.-C., and Prusoff, W. H. (1973) Biochem. Pharmacol. 22, 3099. Chou, T.-C., and Talalay, P. (1977) J. Biol. Chem. 252, 6438.
Cleland, W. W. (1979) Methods Enzymol. 63, 103.
Coats, E. A., Genther, C. S., and Smith, C. C. (1984) In QSAR in Design of Bioactive Compounds, M. Kuchar, Ed., J. R. Prous Science, Barcelona, Spain, pp. 71—85.
Dean, P. M. (1987) Molecular Foundations of Drug—Receptor Interactions, Cambridge University Press, New York.
Dixon, M. (1953) Biochem. J. 55 170.
Dougas, H., and Penney, C. (1981) Bioorganic Chemistry: A Chemical Approach to Enzyme Action, Springer-Verlag, New York.
Fesik, S. W. (1991) J. Med. Chem. 34, 2937.
Furfine, E. S., D’Souza, E., Ingold, K. J., Leban, J. J., Spectro, T., and Porter, D. J. T.
(1992) Biochemistry, 31, 7886.
Goodford, P. J. (1985) J. Med. Chem. 28, 849.
Gringauz, A. (1996) Medicinal Chemistry: How Drugs Act and Why, Wiley, New York. Hammett, L. P. (1970) Physical Organic Chemistry, McGraw-Hill, New York. Hansch, C. (1969) Acc. Chem. Res. 2, 232.
Hansch, C., and Klein, T. E. (1986) Acc. Chem. Res. 19, 392.
304 REVERSIBLE INHIBITORS
Hansch, C., and Leo, A. (1979) Substituent Constants for Correlation Analysis in Chemistry and Biology, Wiley, New York.
Karlsson, R. (1994) Anal. Biochem. 221, 142.
Klebe, G. (1994) J. Mol. Biol. 237, 212.
Kubinyi, H. (1993) QSAR: Hansch Analysis and Related Approaches, VCH, New York.
Lesk, A. M., and Boswell, D. R. (1992) Curr. Opin. Struct. Biol. 2, 242.
Li, R.-L., and Poe, M. (1988) J. Med. Chem. 31, 366.
Loewe, S. (1957) Pharmacol. Rev. 9, 237.
Ma, H., Yang, H. Q., Takano, E., Hatanaka, M., and Maki, M. (1994) J. Biol. Chem. 269, 24430.
Marshall, G. R., and Cramer, R. D., III (1988) Trends Pharmacol. Sci. 9, 285.
Martin, Y. C. (1978) Quantitative Drug Design, Dekker, New York.
Martinez-Irujo, J. J., Villahermosa, M. L., Mercapide, J., Cabodevilla, J. F., and Santiago, E. (1998) Biochem. J. 329, 689.
Matthews, D. A., Bolin, J. T., Burridge, J. M., Filman, D. J., Volz, K. W., and Kraut, J.
(1985) J. Biol. Chem. 260, 392.
McRee, D. E. (1993) Practical Protein Crystallography, Academic Press, San Diego, CA.
Nogrady, T. (1985) Medicinal Chemistry, A Biochemical Approach, Oxford University
Press, New York.
Pauling, L., and Pressman, D. (1945) J. Am. Chem. Soc. 75, 4538.
Sandler, M., and Smith, H. J. (1994) Design of Enzyme Inhibitors as Drugs, Vols. 1 and 2, Oxford University Press, New York.
Schramm, V. L., Horenstein, B. A., and Kline, P. C. (1994) J. Biol. Chem. 269, 18259.
Segel, I. H. (1975) Enzyme Kinetics, Wiley, New York.
Segel, I. H. (1976) Biochemical Calculations, 2nd ed., Wiley, New York.
Suckling, C. J. (1991) Experimentia, 47, 1139.
Taft, R. W. (1953) J. Am. Chem. Soc. 75, 4538.
Von Itzstein, M., Wu, W.-Y., Kok, G. B., Pegg, M. S., Dyason, J. C., Jin, B., Phan, T. V., Smythe, M. L., White, H. F., Oliver, S. W., Colman, P. M., Varghese, J. N., Ryan, D. M., Woods, J. M., Bethell, R. C., Hotham, V. J., Cameron, J. M., and Penn, C. R. (1993) Nature, 363, 418.
Wolfenden, R. (1972) Acc. Chem. Res. 5, 10.
Yonetani, T., and Theorell, H. (1964) Arch. Biochem. Biophys. 106, 243.

Enzymes: A Practical Introduction to Structure, Mechanism, and Data Analysis.
Robert A. Copeland Copyright 2000 by Wiley-VCH, Inc.
ISBNs: 0-471-35929-7 (Hardback); 0-471-22063-9 (Electronic)
9
TIGHT BINDING INHIBITORS
In Chapter 8 we discussed reversible inhibitors of enzymes that bind and are released at rates that are rapid in comparison to the rate of enzyme turnover and have overall dissociation constants that are large in comparison to the total concentration of enzyme present. We are able to analyze the interactions of these inhibitors with their target enzymes by means of equations of the Henri—Michaelis—Menten type discussed in Chapters 5 and 8 because we can generally assume that the free inhibitor concentration is well modeled by the total concentration of added inhibitor: that is, since [E] is much smaller than K , the concentration of the EI complex is held to be very small compared to [I]. This assumption, however, is not valid for all inhibitors. Some inhibitors bind to their target enzyme with such high affinity that the population of free inhibitor molecules is significantly depleted by formation of the enzymeinhibitor complex. For these tight binding inhibitors, the steady state approximations used thus far are no longer valid; in fact, it has been suggested that these assumptions should be abandoned whenever the K of an inhibitor is less than 1000-fold greater than the total enzyme concentration (Goldstein, 1944; Dixon and Webb, 1979). In this chapter we shall describe alternative methods for data analysis in the case of tight binding inhibitors that allow us to characterize the type of inhibition mechanism involved and to quantify correctly the dissociation constant for the enzyme—inhibitor complex.
9.1 IDENTIFYING TIGHT BINDING INHIBITION
In this chapter we shall consider the steady state approach to studying tight binding inhibitors. Such work requires assay conditions that permit all the
305
306 TIGHT BINDING INHIBITORS
equilibria involving the inhibitor, substrate, and enzyme to be reached rapidly with respect to the measurement of the steady state velocities. Many tight binding inhibitors, however, are restricted in their action by a slow onset of inhibition — that is, by a time-dependent component to their inhibition. We deal with time-dependent inhibition explicitly in Chapter 10. For our present discussion, we shall assume either that the establishment of equilibrium is rapid or that sufficient time has been allowed before the initiation of reaction by the substrate for the inhibitor and enzyme to establish equilibrium (i.e., a preincubation of the enzyme with the inhibitor has been incorporated into the experimental design).
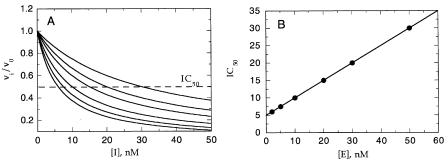
The simplest determination that tight binding inhibition is occurring comes from measurement of the dose—response curve for inhibition (see Chapter 8). An IC value obtained from this treatment of the data that is similar to the concentration of total enzyme in the sample (i.e., within a factor of 10) is a good indication that the inhibitor is of the tight binding type. A more defining feature of tight binding inhibitors is the variation of the IC value observed for these inhibitors with total enzyme concentration at a fixed substrate concentration. This is true because a tight binding inhibitor interacts with the enzyme in nearly stoichiometric fashion. Hence, the higher the concentration of enzyme present, the higher the concentration of inhibitor required to reach half-maximal saturation of the inhibitor binding sites (Figure 9.1A). Several authors have derived equations similar in form to Equation 9.1, which demonstrates that the IC value of a tight binding inhibitor will track linearly with the total concentration of enzyme, [E] (Myers, 1952; Cha et al., 1975; Williams and Morrison, 1979; Greco and Hakala, 1979):
IC |
|
[E] K |
(9.1) |
|
|
|
|
Figure 9.1 (A) Dose—response plot of fractional velocity as a function of tight binding inhibitor concentration at different enzyme concentrations. Note that this plot is the same as the dose—response plots introduced in Chapter 8, except that here the x axis is plotted on a linear, rather than a logarithmic, scale. (B) Plot of IC value obtained from the curves in (A) as a function of enzyme concentration.
DISTINGUISHING INHIBITOR TYPE FOR TIGHT BINDING INHIBITORS |
307 |
Thus, a plot of IC as a function of [E] (at a single, fixed substrate concentration) is expected to yield a straight line with slope of 0.5 and y intercept equal to K . The value K is related to the true K by factors involving the substrate concentration and K , depending on the mode of interaction between the inhibitor and the enzyme.
9.2 DISTINGUISHING INHIBITOR TYPE FOR TIGHT BINDING INHIBITORS
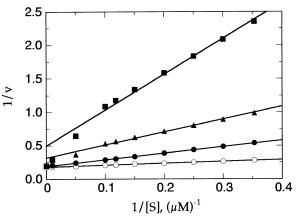
Morrison (Morrison, 1969; Williams and Morrison, 1979) has provided indepth mathematical treatments of the effects of tight binding inhibitors on the initial velocities of enzymatic reactions. These studies revealed, among other things, that the classical double-reciprocal plots used to distinguish inhibitor type for simple enzyme inhibitors fail in the case of tight binding inhibitors. For example, based on the work just cited by Morrison and coworkers, the double-reciprocal plot for a tight binding competitive inhibitor would give the pattern of lines illustrated in Figure 9.2. The data at very high substrate concentrations curve downward in this plot, and the curves at different inhibitor concentrations converge at the y axis. Note, however, that this curvature is apparent only at very high substrate concentrations and in the presence of high inhibitor concentrations. This subtlety in the data analysis is easy to miss if care is not taken to include such extreme conditions, or if these conditions are not experimentally attainable. Hence, if the few data points in the very high substrate region are ignored, it is tempting to fit the data in Figure 9.2 to a series of linear functions, as has been done in this illustration. The pattern of lines that emerges from this treatment of the data is a series of
Figure 9.2 Double-reciprocal plot for a tight binding competitive inhibitor: the pattern of lines is similar to that expected for a classical noncompetitive inhibitor (see Chapter 8).

308 TIGHT BINDING INHIBITORS
lines that intersect at or near the x axis, to the left of the y axis. This is the expected result for a classical noncompetitive inhibitor (see Chapter 8), and we can generally state that regardless of their true mode of interaction with the enzyme, tight binding inhibitors display double-reciprocal plots that appear similar to the classical pattern for noncompetitive inhibitors.
As one might imagine, this point has led to a number of misinterpretations of kinetic data for inhibitors in the literature. For example, the naturally occurring inhibitors of ribonuclease are nanomolar inhibitors of the enzyme. Initial evaluation of the inhibitor type by double-reciprocal plots indicated that these inhibitors acted through classical noncompetitive inhibition. It was not until Turner et al. (1983) performed a careful examination of these inhibitors, over a broad range of inhibitor and substrate concentrations, and properly evaluated the data (as discussed below) that these proteins were recognized to be tight binding competitive inhibitors.
How then can one determine the true mode of interaction between an enzyme and a tight binding inhibitor? Several graphical approaches have been suggested. One of the most straightforward is to determine the IC values for the inhibitor at a fixed enzyme concentration, but at a number of different substrate concentrations. As with simple reversible inhibitors, the IC of a tight binding inhibitor depends on the K of the inhibitor, the substrate concentration, and the substrate K in different ways, depending on the mode of inhibition. For tight binding inhibitors we must additionally take into consideration the enzyme concentration in the sample, since this will affect the measured IC , as discussed earlier. The appropriate relationships between these factors and the IC for different types of tight binding inhibitor have been derived several times in the literature (Cha, 1975; Williams and Morrison, 1979; Copeland et al., 1995). Rather than working through these derivations again, we shall simply present the final form of the relationships.
For tight binding competitive inhibitors:
|
|
|
|
|
K |
2 |
|
||
IC |
K |
|
|
1 |
[S] |
|
|
[E] |
|
|
|
|
|
||||||
|
|
|
|
|
|
|
|
|
|
For tight binding noncompetitive inhibitors:
IC [S] K [E]K [S] 2
K K
when 1:
(9.2)
(9.3)
IC |
K |
[E] |
(9.4) |
|
2 |
|
|||
|
|
|
|
|

DISTINGUISHING INHIBITOR TYPE FOR TIGHT BINDING INHIBITORS |
309 |
||||
For tight binding uncompetitive inhibitors: |
|
|
|
||
|
K |
[E] |
|
||
IC K 1 |
|
|
|
|
(9.5) |
[S] |
2 |
|
|||
From the form of these equations, we see that a plot of the IC value as a function of substrate concentration will yield quite different patterns, depending on the inhibitor type. For a tight binding competitive inhibitor, the IC value will increase linearly with increasing substrate concentration (Figure 9.3A). For an uncompetitive inhibitor, a plot of IC value as a function of substrate concentration will curve downward sharply (Figure 9.3A), while for
a noncompetitive inhibitor the IC will curve upward or downward, or be
independent of [S], depending on whether is greater than, less than, or equal to 1.0 (Figure 9.3A and B).
In an alternative graphical method for determining the inhibitor type, and obtaining an estimate of the inhibitor K , the fractional velocity of the enzyme reaction is plotted as a function of inhibitor concentration at some fixed substrate concentration (Dixon, 1972). The data can be fit to Equation 8.20 to yield a curvilinear fit as shown in Figure 9.4A. (Note that this is the same as the dose—response plots discussed in Chapter 8, except here the x axis is plotted on a linear, rather than a logarithmic, scale). A line is drawn from the v/v value at [I] 0 (referred to here as the starting point) through the point on the curve where v v /2 (n 2) and extended to the x axis. A second line is drawn from the starting point through the point on the curve where v v /3 (n 3), and, in a similar fashion, additional lines are drawn from the starting point through other points on the curve where v v /n (where n is an integer). The nest of lines thus drawn will intersect the x axis at a constant spacing, which is defined as K.
Figure 9.3 (A) The effects of substrate concentration on the IC values of competitive (solid circles), noncompetitive when 1 (open circles), and uncompetitive (solid squares) tight binding inhibitors. (B) The effects of substrate concentration on the IC values of noncompetitive tight binding inhibitors when 1 (squares) and when 1 (circles).