

ARM cross development with Eclipse, version 2 (J.P. Lynch, 2005)
.pdfYou can easily change the value of a variable at any time. Assuming that the debugger has stopped, click on the variable you wish to change and right click. In the right-click menu, select “Change Value…” and enter the new value into the pop-up window as shown below. In this example, we change the variable “c” to 52.
Now the “Variables” view should show the new value for the variable “c”. Note that it has been colored red to indicate that it has been changed.

M.Watch Expressions
The “Expressions” view can display the results of expressions (any legal C Language expression). Since it can pick any local or global variable, it forms the basis of a customizable variable display; showing only the information you want.
For example, to display the 6th character of the name in the structured variable “Access”, bring up the right-click menu and select “Add Watch Expression…”.
Enter the fully qualified name of the 6th character of the name[] array.
Note that it now appears in the “Expressions” view.
You can type in very complicated expressions. Here we defined the expression (i + z)/h
N.Assembly Language Debugging
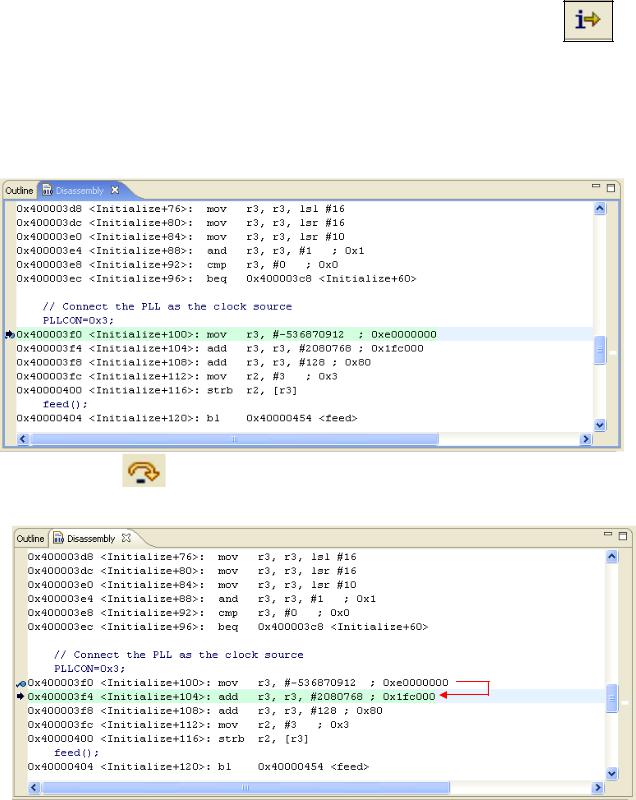
The Debug perspective includes an Assembly Language view.
If you click on the Instruction Stepping Mode toggle button in the Debug view,
the assembly language window becomes active and the single-step buttons apply to the assembler window. The single-step buttons will advance the program by a single assembler instruction. Note that the “Disassembly” tab lights up when the assembler view has control.
Note that the debugger is currently stopped at the assembler line at address 0x400003f0.
If we click the |
|
Step Over” button in the Debug view, the debugger will execute |
one assembler |
line. |
|
The “Step Into” and “Step Out Of” buttons work in the same was as for C code.
O.Inspecting Registers
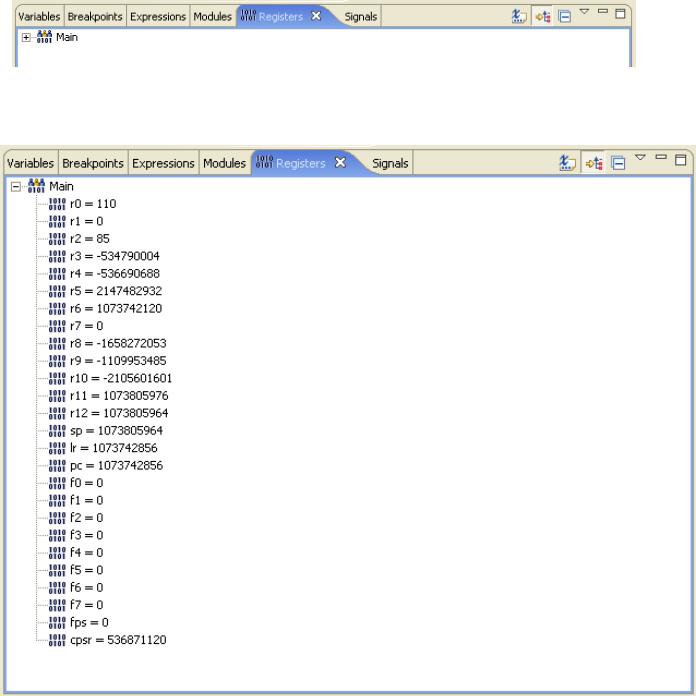
Unfortunately, parking the cursor over a register name (R3 e.g.) does not pop up its current value. For that, you can refer to the “Registers” view.
Click on the “+” symbol next to Main and the registers will appear. The Philips LPC2106 doesn’t have any floating point registers so registers F0 through FPS are not applicable.
If you don’t like a particular register’s numeric format, you can click to highlight it and then bring up the right-click menu.
The “Format” option permits you to change the numeric format to hexadecimal, for example.

Now the register display shows r4 in hexadecimal format.
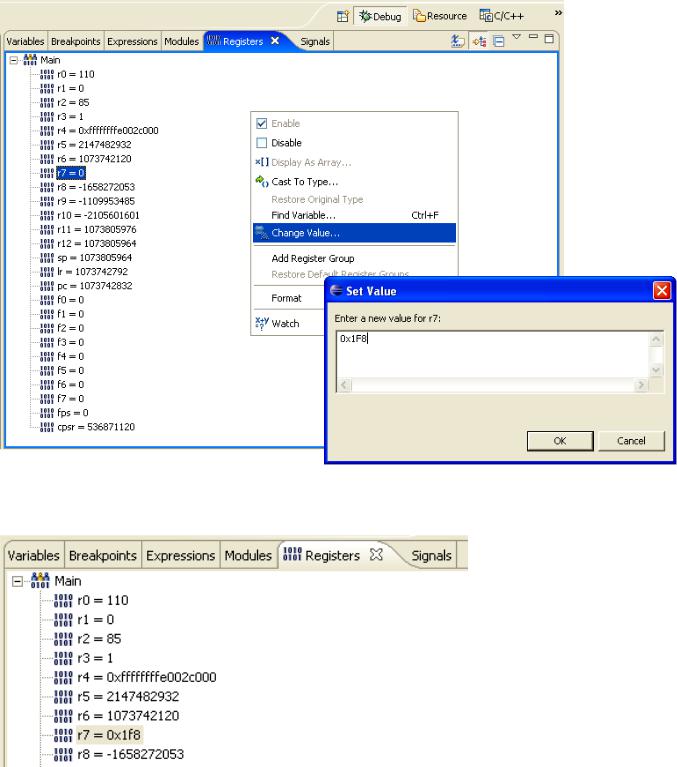
Of course, the right click menu lets you change the value of any register. For example, to change r7 from zero to 0x1F8, just select the register, right-click and select “Change Value…”
Now the value for r7 has been changed to 0x1F8.
It goes without saying that you had better use this feature with great care! Make sure you know what you are doing before tampering with the ARM registers.
P.Inspecting Memory
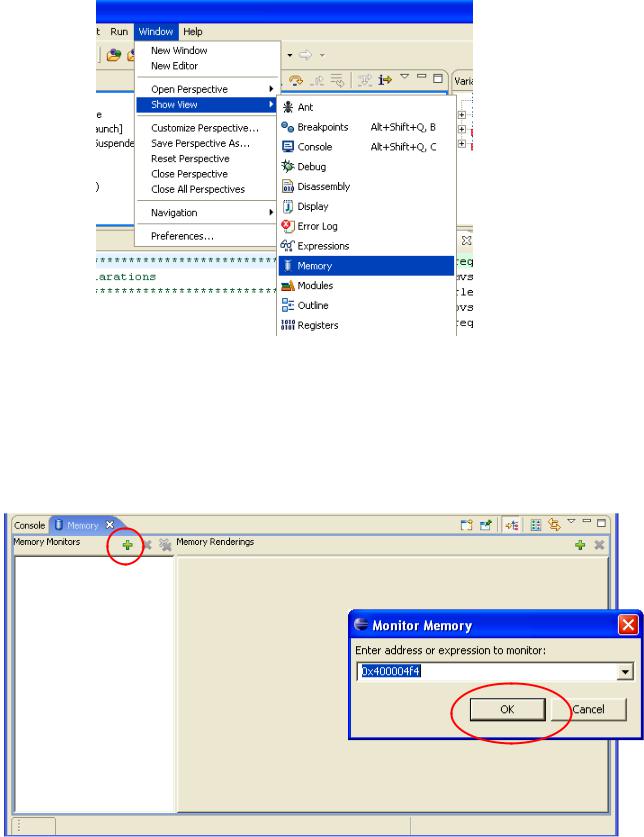
Viewing memory is a bit complex in Eclipse. First, the memory view is not part of the default debug launch configuration. You can add it by clicking “Window – Show View – Memory” as shown below.
The memory view appears in the “Console” view at the bottom of the Debug perspective. At this point, nothing has been defined. Memory is displayed as one or
more “memory monitors”. To create a memory monitor, click on the “+” symbol.
Enter the address 0x400004f4 (address of the string “The Rain in Spain”) in the dialog box.
The memory monitor is created, although it defaults to 4-byte display mode. The display of the address columns and the associated memory contents is called a “Rendering”.
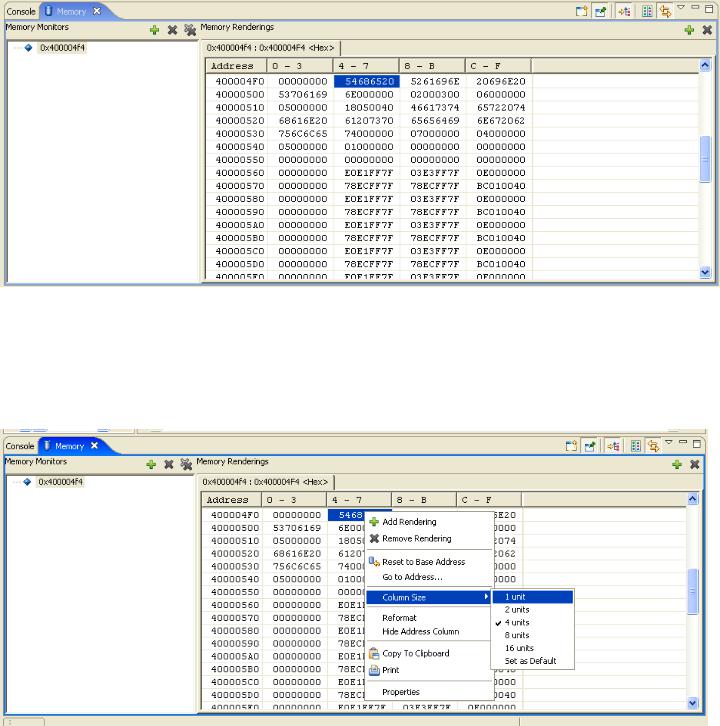
The address 0x400004F4 is called the Base Address; there’s a right-click menu option “Reset to Base Address” that will automatically return you to this address if you scroll the memory display.
There’s also a “Go to Address…” right-click menu option that will jump all over memory for you.
By right-clicking anywhere within the memory rendering (display area), you can select “Column Size – 1 unit”.
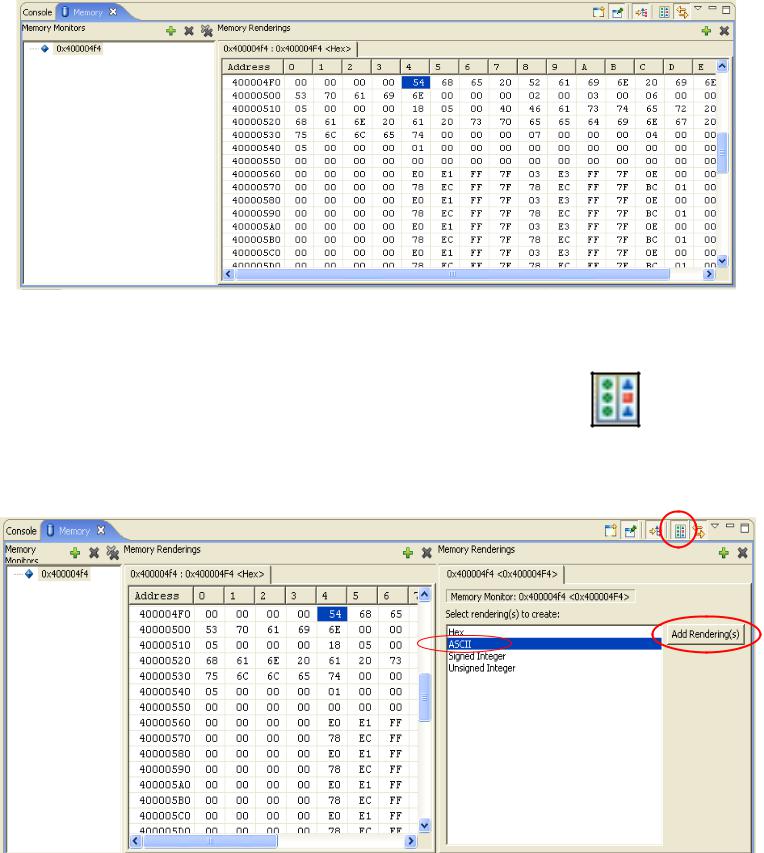
This will repaint the memory rendering in Byte format.
Now we will add a second rendering that will display the memory monitor in ASCII. Click on the “Toggle Split Pane” button to create a second rendering pane.
Pick “ASCII” display for the new rendering.
Click on the “Add Rendering(s)” button to create an additional ASCII memory display.
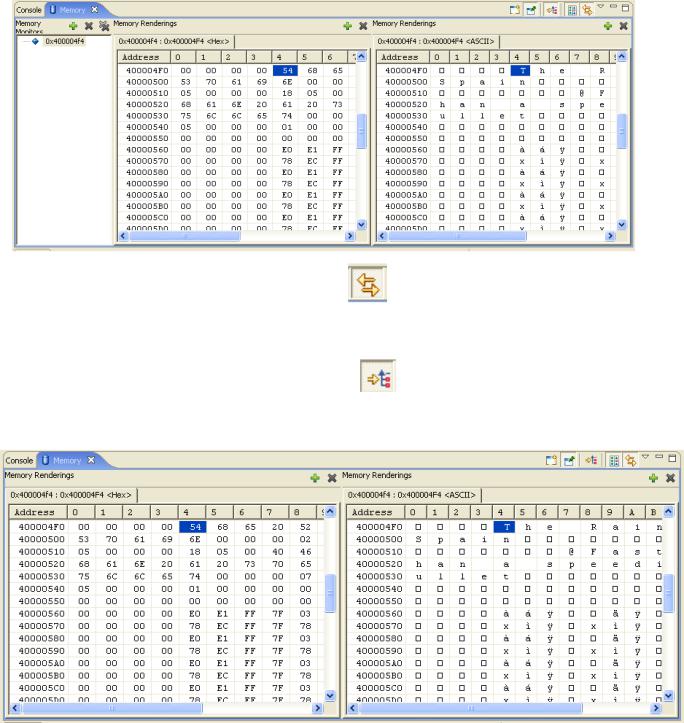
Click on the “Link Memory Rendering Panes” |
button. |
This means that scrolling one memory rendering will automatically scroll the other one in synchronism.
Click on the “Toggle Memory Monitors Pane” |
button. |
This will expand the display erasing the “memory monitors” list on the left.
Personally, I think this Eclipse memory display is a bit complex. However, it allows you to define many “memory monitors” and clicking on any one of them pops up the renderings instantly. It’s like so many things in life, once you learn how to do it; it seems easy!