

ARM cross development with Eclipse, version 2 (J.P. Lynch, 2005)
.pdfYou do NOT have to remove the BSL jumper. Click on the “Run from Address” button to execute the program.
Your application should blink, just like the Flash EPROM version did. Time for the
Bigfoot picture!
IT BLINKS!
22 Debug the RAM Project
The previous exercise, running the RAM project from the Flash Utility, was of academic interest but essentially of no practical value. Well, it is kind of cool that you can do that with a flash utility.
Eclipse/CDT interfaces seamlessly to the GDB debugger that is an integral part of the GNU tool chain. When you click on the “Debug” button, you will be able to watch the execution of your program graphically as it goes from breakpoint to breakpoint. You can park the cursor over a variable name and see its current value (assuming that execution has stopped, of course). You’ll be able to look at structured variables, see the ARM registers and have the ability to modify variables and registers. Unfortunately, the inability of the current Wiggler/OCDremote hardware to support hardware breakpoints and flash reprogramming limits the debugger to RAM-based applications.
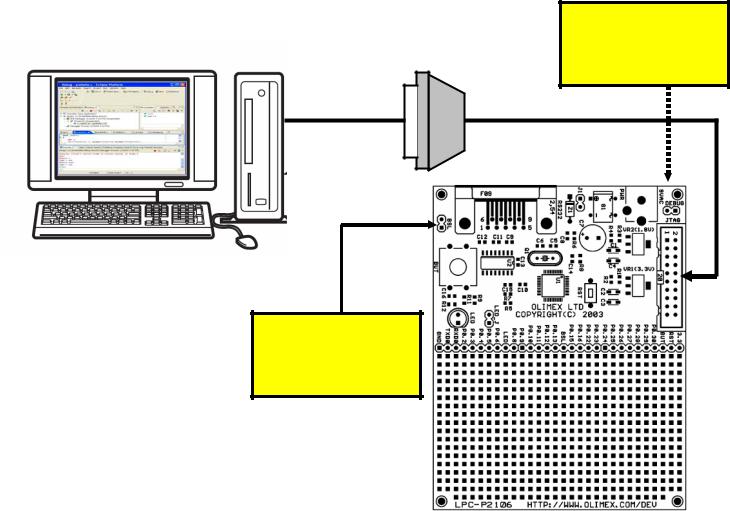
We will need the following hardware setup:
Install the Debug
JTAG jumper while
Olimex ARM JTAG Adapter running from RAM
LPT1
20-pin
JTAG
The BSL jumper Port generally doesn’t
matter while using
JTAG
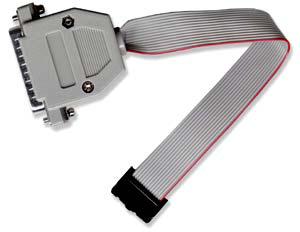
The Olimex ARM JTAG Adapter is a clone of the Macraigor Wiggler JTAG interface. It costs about $19.95 and all fits into a DB-25 shell. I bought a straight-through printer cable from my local computer retailer and fitted it from the LPT1 printer port to the ARM JTAG Wiggler. The Wiggler was then fitted to the 20-pin JTAG header on the Olimex LPC-P2106 board.
The red stripe on the ribbon cable is pin 1 and should be nearest the power plug.
The Debug JTAG jumper should be fitted. It doesn’t matter if the BSL jumper is installed or not. Make all these connections with the power off.
A.Blunt Talk About the Wiggler
Let’s talk bluntly about the Wiggler. The Wiggler is one of many products from the Canadian company Macraigor. It connects the parallel port of your PC to the 20-pin
JTAG header on the Olimex LPC-P2106 board. It is just a simple level shifter and a transistor. Macraigor charges $150 for it; the Olimex clone is about $19.
There are several schematic diagrams on the web for the Wiggler; notably Leon Heller has one on the LPC2000 message board on Yahoo. You could build your own but I doubt you’d save that much money after paying the shipping from Digikey and the gas to drive to Radio Shack. The Olimex version is a fair deal.
Obviously the Macraigor Company is not happy about all these clones running about, so recently they slipped an impediment into the works. The latest version of OCDremote; their free JTAG server for the Wiggler and other products, is expecting a connection
(short circuit) between pins 8 and 15 of the LPT1 printer port. This has made a lot of people fail.
Olimex has said that they would revise their design and modify their stock of Wigglers to make this connection, but there are large numbers of the device out there that don’t have this modification (like my Olimex Wiggler).
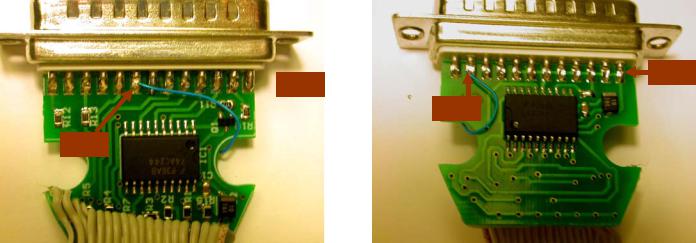
Use an ohmmeter on the 25-pin printer connector on the Wiggler to see if these two pins are connected. If not, you can easily disassemble the Olimex Wiggler and tacksolder a jumper to do the job. Again, you must connect pin 8 to pin 15.
Pin 25
 Pin 1
Pin 1
Pin 15
Pin 8
I used that 30 gauge Radio Shack blue Teflon coated hookup wire and a microscope to do the soldering above. If you have a good magnifier; the DB-25 pins on the wiggler have the pin numbers embossed in the white plastic above and below the rows of pins.
We’re not quite finished with our Wiggler suffering. There’s the final issue of the PC Printer port mode. Most modern PCs, like my new Dell, have the Printer Port defaulted to “ECP” mode.
The Wiggler will not work with the printer port configured for ECP mode.
The Macraigor web site has a FAQ with the following citation:
What mode must my parallel port be in?
As far as the parallel port is concerned, a Wiggler is a simple uni-directional device. It will work with the parallel port in any mode EXCEPT "ECP". It will NOT work in ECP mode at all.
The Raven works best with a parallel port in EPP mode. It may work in ECP mode. If the parallel port is in an older mode, such as uni-directional, AT, or compatible, the Raven will work but slower.
Remember, the mode is set in the CMOS bios of your computer.
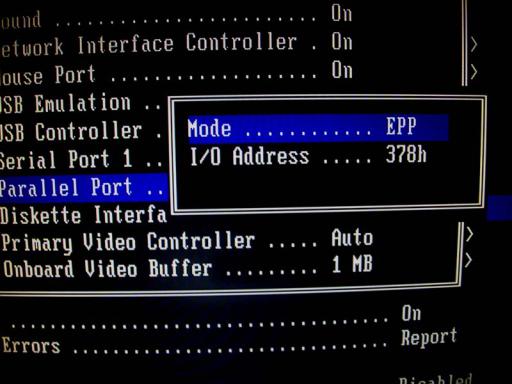
On my Dell Dimension Desktop PC, the CMOS setup can be entered if you hit the F2 key as the machine boots up. By maneuvering around the CMOS setup, you can find the Parallel Port setup and see what mode it is set up as. If it’s ECP mode, change it to EPP mode, as I did in the screen photograph below. Save the CMOS setup and exit.
My printer is a USB device, so this action didn’t effect my printer operation.
It’s disappointing to report that the Wiggler cannot set a breakpoint in FLASH. The OCDremote application cannot deal with GDB –z commands which refer to hardware breakpoints (the LPC2106 has two hardware breakpoints). This is the reason that debugging with this simple device is limited to applications configured to run from RAM exclusively. Obviously, the 64K limitation of the Philips LPC2106 limits the size of an application you can fit into RAM. However, it’s better than nothing.
Let’s review the hardware setup one more time.
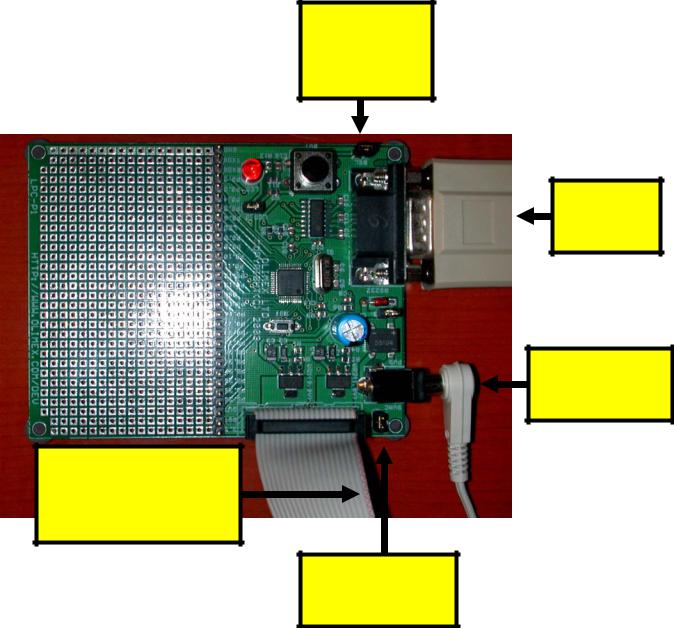
Doesn’t matter if the BSL jumper is installed or not.
No need to unplug the serial cable
Power plug from 9 volt wall wart power supply
Red stripe on ribbon cable must be next to Debug JTAG jumper and the power plug.
The Debug JTAG jumper MUST be installed
Power up the Olimex LPC-P2106 board and press the RST button for good luck!
B.Final Preparations Before Starting Eclipse Debugger
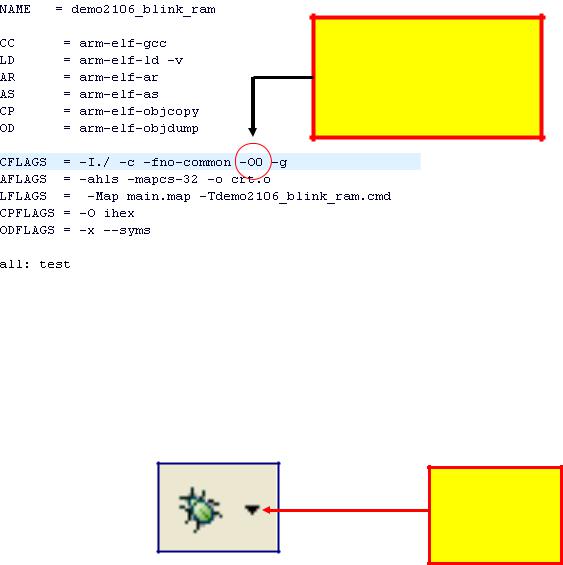
Before we start the Eclipse Graphical Debugger, I should mention that debuggers absolutely hate compiler optimization. This one is no different. We have been compiling with –O3 and you will find some strange things happening when you single-step at that optimization level.
Just to be sure, let’s turn off optimization. Go to the makefile and change the setting to –O0 and rebuild!
File: makefile.mak
Turn off compiler optimization by setting compiler flag to:
-O0 - no optimization
C.Create a Debug Launch Configuration
The first order of business is to set up a “debug launch configuration.” The quickest way to get to the “debug launch configuration” screen is to click on the “insect” button
(insect – bug – get it?). Specifically, click on the down arrowhead to bring up the debug pull-down menu.
Click on down arrowhead to get the pulldown menu
Note: Debugging is limited to applications targeted to RAM execution. I suspect that fairly soon an affordable USB/JTAG debug interface and software drivers will be available that will permit use of the two hardware breakpoints available in the ARM JTAG hardware. These two breakpoints will work in flash memory. In this situation, you could use the Philips Flash Utility to download the code into flash and then start the Eclipse debugger.
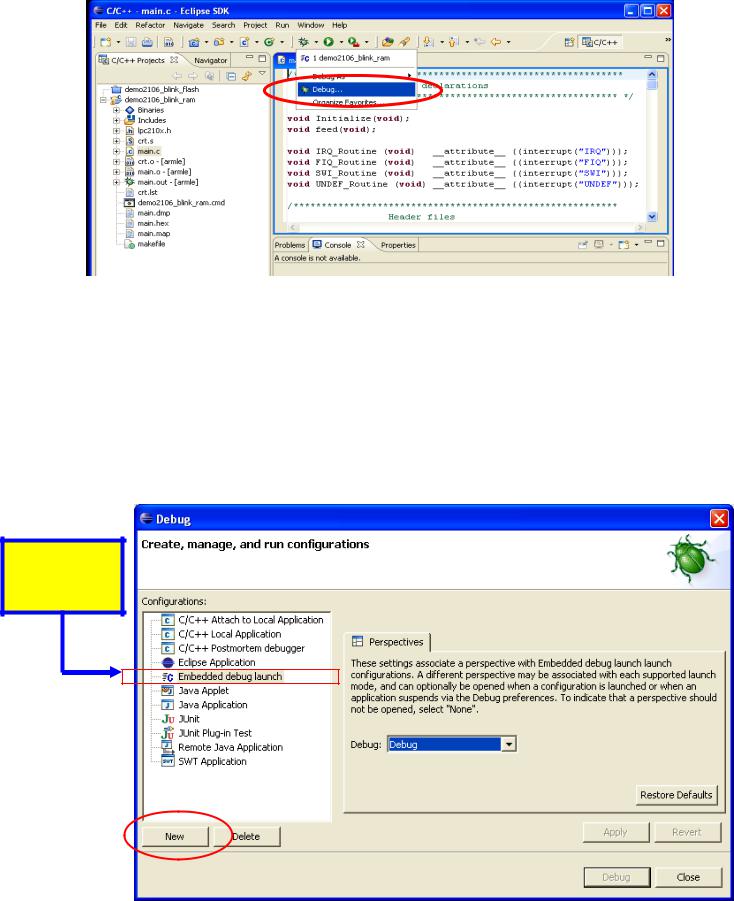
Click on the “Debug …” selection in the debug pull-down list to bring up the Debug configuration screen.
In the “Debug Launch Configuration” screen below, you can see the Zylin modification. Note that one of the possible debug configuration types is now “Embedded debug launch.”
You will tend to create a separate “Embedded debug launch” configuration for every project you create; it’s very convenient for people who have multiple projects going on at the same time.
Click on the Zylin “Embedded debug launch” configuration and then “New” to get started.
Zylin added this debug configuration
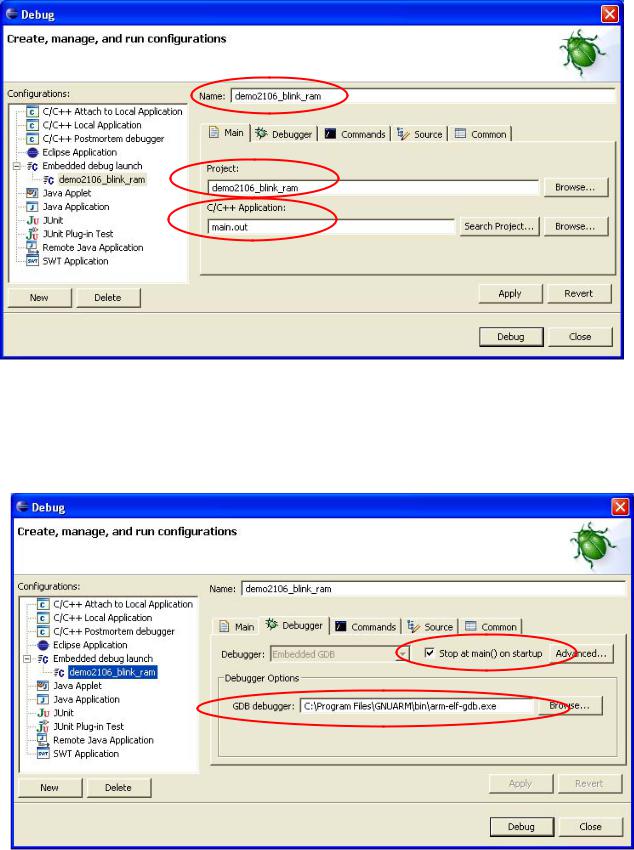
In the “Main” tab, set the name to anything you like and the project to “demo2106_blink_ram.” I was, of course, lazy and made the debug configuration name the same as the project. Set the C/C++ Application to “main.out.” Main.out is an arm-elf format file that has the executable and debug information within the file.
Under the “Debugger” tab, use the “browse” button to set the “GDB debugger” text window to “c:\program files\GNUARM\bin\arm-elf-gdb.exe” and check the box that instructs the debugger to stop at main() on startup.
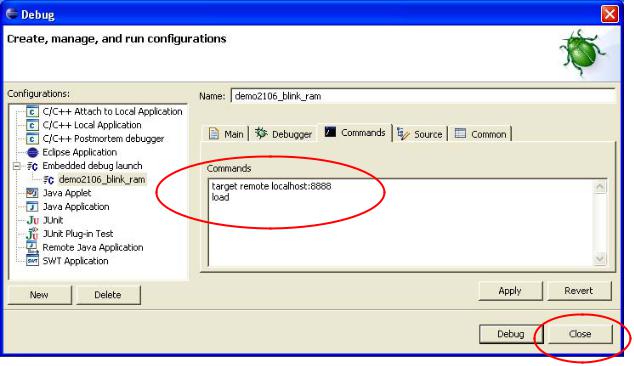
Under the “commands” tab, enter the following two GDB commands to run at startup:
target remote localhost:8888 load
The “target remote” command specifies that the protocol used to talk to the application is “GDB Remote Serial” protocol with the serial device being a internet socket called localhost:8888 (the default specification for the Macraigor OCDremote driver).
Target Remote supports the GDB “load” command; the specific download file (main.out) was specified above in the “main” tab.
The “source” tab can be left at its default settings.
Likewise, the “common” tab can be left at its default setting. Click on “apply” and then
“Close” to complete specification of the debug launch configuration.
D.Switch to Debug Perspective
What you see on the screen when using Eclipse is called a “perspective” and up to now, we have been using the “C/C++” perspective. Once the application has been built, we must switch to the “Debug” perspective to debug it.
One way is to change the perspective in the “Window” pull-down menu as shown below.