

Chapter 9- Applications of the DFT |
179 |
|
Time Domain |
Frequency Domain |
|
|
0.4 |
|
|
|
|
|
|
|
|
|
2.0 |
|
|
|
|
|
|
|
a. Impulse response |
|
|
|
|
|
|
|
ab. ImpulseFrequencyresponse |
|
|
|
|||
Amplitude |
0.2 |
|
|
|
|
|
|
|
|
Amplitude |
1.5 |
|
|
|
|
|
0 |
|
|
|
|
|
|
|
|
1.0 |
|
|
|
|
|
||
|
|
|
|
|
|
|
|
|
|
|
|
|
|
|
||
|
-0.2 |
|
|
|
|
|
|
|
|
|
0.5 |
|
|
|
|
|
|
-0.4 |
|
|
|
|
|
|
|
|
|
0.0 |
|
|
|
|
|
|
0 |
8 |
16 |
24 |
32 |
40 |
48 |
56 |
643 |
|
0 |
0.1 |
0.2 |
0.3 |
0.4 |
0.5 |
|
|
|
|
Sample number |
|
|
|
|
|
|
Frequency |
|
|
|||
|
0.4 |
|
|
|
|
|
|
|
|
|
2.0 |
|
|
|
|
|
|
|
|
|
ac. Impulse response |
padded with zeros |
|
|
|
|
|
d. Frequency response (high resolution) |
||
0.2 |
|
|
|
|
|
1.5 |
|
|
|
|
|
|
|
|
|
|
|
|
|
|
|
|
|
|
|
||
Amplitude |
0 |
Amplitude |
1.0 |
|
|
-0.2 |
|
|
|
|
|
|
|
|
|
|
|
|
|
|
|
|
|
|
|
|
|
|
|
|
|
0.5 |
|
|
|
|
|
|
|
|
|
|
|
|
|
|
|
|
|
|
|
|
|
|
|
|
|
|
|
-0.4 |
|
|
|
|
|
|
|
|
|
|
|
|
|
|
|
|
|
|
|
|
|
|
|
|
|
0.0 |
|
|
|
|
|
|
|
|
|
|
|
|
|
|
|
|
|
|
|
|
|
|
|
|
|
|
|
0 |
64 |
128 |
192 |
256 |
320 |
384 |
448 |
5112 |
0 |
0.1 |
0.2 |
0.3 |
0.4 |
0.5 |
|||||||||||||||||||||||||||||||||||||||
|
|
|
|
|
|
|
|
|
Sample number |
|
|
|
|
|
|
|
|
|
|
|
|
|
|
|
|
|
|
|
|
Frequency |
|
|
|
|
|
|
|
|
|
||||||||||||||
FIGURE 9-7
Finding the frequency response from the impulse response. By using the DFT, a system's impulse response, (a), can be transformed into the system's frequency response, (b). By padding the impulse response with zeros (c), higher resolution can be obtained in the frequency response, (d). Only the magnitude of the frequency response is shown in this example; discussion of the phase is postponed until the next chapter.
what the continuous curve looks like. Remember what the frequency response represents: amplitude and phase changes experienced by cosine waves as they pass through the system. Since the input signal can contain any frequency between 0 and 0.5, the system's frequency response must be a continuous curve over this range.
This can be better understood by bringing in another member of the Fourier transform family, the Discrete Time Fourier Transform (DTFT). Consider an N sample signal being run through an N point DFT, producing an N/2 % 1 sample frequency domain. Remember from the last chapter that the DFT considers the time domain signal to be infinitely long and periodic. That is, the N points are repeated over and over from negative to positive infinity. Now consider what happens when we start to pad the time domain signal with an ever increasing number of zeros, to obtain a finer and finer sampling in the frequency domain. Adding zeros makes the period of the time domain longer, while simultaneously making the frequency domain samples closer together.
180 |
The Scientist and Engineer's Guide to Digital Signal Processing |
Now we will take this to the extreme, by adding an infinite number of zeros to the time domain signal. This produces a different situation in two respects. First, the time domain signal now has an infinitely long period. In other words, it has turned into an aperiodic signal. Second, the frequency domain has achieved an infinitesimally small spacing between samples. That is, it has become a continuous signal. This is the DTFT, the procedure that changes a discrete aperiodic signal in the time domain into a frequency domain that is a continuous curve. In mathematical terms, a system's frequency response is found by taking the DTFT of its impulse response. Since this cannot be done in a computer, the DFT is used to calculate a sampling of the true frequency response. This is the difference between what you do in a computer (the DFT) and what you do with mathematical equations (the DTFT).
Convolution via the Frequency Domain
Suppose that you despise convolution. What are you going to do if given an input signal and impulse response, and need to find the resulting output signal? Figure 9-8 provides an answer: transform the two signals into the frequency domain, multiply them, and then transform the result back into the time domain. This replaces one convolution with two DFTs, a multiplication, and an Inverse DFT. Even though the intermediate steps are very different, the output is identical to the standard convolution algorithm.
Does anyone hate convolution enough to go to this trouble? The answer is yes. Convolution is avoided for two reasons. First, convolution is mathematically difficult to deal with. For instance, suppose you are given a system's impulse response, and its output signal. How do you calculate what the input signal is? This is called deconvolution, and is virtually impossible to understand in the time domain. However, deconvolution can be carried out in the frequency domain as a simple division, the inverse operation of multiplication. The frequency domain becomes attractive whenever the complexity of the Fourier Transform is less than the complexity of the convolution. This isn't a matter of which you like better; it is a matter of which you hate less.
The second reason for avoiding convolution is computation speed. For example, suppose you design a digital filter with a kernel (impulse response) containing 512 samples. Using a 200 MHz personal computer with floating point numbers, each sample in the output signal requires about one millisecond to calculate, using the standard convolution algorithm. In other words, the throughput of the system is only about 1,000 samples per second. This is 40 times too slow for high-fidelity audio, and 10,000 times too slow for television quality video!
The standard convolution algorithm is slow because of the large number of multiplications and additions that must be calculated. Unfortunately, simply bringing the problem into the frequency domain via the DFT doesn't help at all. Just as many calculations are required to calculate the DFTs, as are required to directly calculate the convolution. A breakthrough was made in the problem in the early 1960s when the Fast Fourier Transform (FFT) was developed.

Chapter 9- Applications of the DFT
Amplitude
2
a. x[n] |
1
0 


-1 


-2
0 |
128 |
256 |
384 |
5121 |
Sample number
t

Amplitude
2
d. h[n] |
1
0 


-1
0 |
128 |
256 |
384 |
5112 |
Sample number
= 


|
|
|
|
|
181 |
|
30 |
|
|
|
|
|
20 |
g. y[n] |
|
|
|
|
|
|
|
|
|
Amplitude |
10 |
|
|
|
|
0 |
|
|
|
|
|
-10 |
|
|
|
|
|
|
|
|
|
|
|
|
-20 |
|
|
|
|
|
-30 |
|
|
|
|
|
0 |
128 |
256 |
384 |
5121 |
Sample number
|
|
|
DFT |
|
TIME |
|
|
|
DFT |
|
|
|
|
|
IDFT |
|
|
|
|
|
|
FREQUENCY |
|
|
|
|
|
|
|
|
|||||
|
|
|
|
|
|
|
|
|
|
|
|
|
|
|
|||
|
60 |
|
|
|
|
|
60 |
|
|
|
|
|
2000 |
|
|
|
|
|
40 |
b. Re X[f] |
|
|
|
40 |
e. Re H[f] |
|
|
|
|
h. Re Y[f] |
|
|
|||
|
|
|
|
|
|
|
|
|
|
|
|
|
|
|
|
||
|
|
|
|
|
|
|
|
|
|
|
|
|
1000 |
|
|
|
|
Amplitude |
20 |
|
|
|
|
Amplitude |
20 |
|
|
|
|
Amplitude |
|
|
|
|
|
0 |
|
|
|
|
0 |
|
|
|
|
0 |
|
|
|
|
|||
|
|
|
|
|
|
|
|
|
|
|
|
|
|
|
|||
|
-20 |
|
|
|
|
|
-20 |
|
|
|
|
|
|
|
|
|
|
|
|
|
|
|
|
|
|
|
|
|
|
|
-1000 |
|
|
|
|
|
-40 |
|
|
|
|
|
-40 |
|
|
|
|
|
|
|
|
|
|
|
-60 |
|
|
|
|
|
-60 |
|
|
|
|
|
-2000 |
|
|
|
|
|
0 |
64 |
128 |
192 |
256 |
|
0 |
64 |
128 |
192 |
256 |
= |
0 |
64 |
128 |
192 |
256 |
|
|
|
Frequency |
|
x |
|
|
|
Frequency |
|
|
|
|
Frequency |
|
|
|
|
|
|
|
|
|
|
|
|
|
|
|
|
|
|
|||
|
60 |
|
|
|
|
|
60 |
|
|
|
|
|
2000 |
|
|
|
|
|
40 |
c. Im X[f] |
|
|
|
40 |
f. Im H[f] |
|
|
|
|
i. Im Y[f] |
|
|
|||
|
|
|
|
|
|
|
|
|
|
|
|
|
|
|
|
||
|
|
|
|
|
|
|
|
|
|
|
|
|
1000 |
|
|
|
|
Amplitude |
20 |
|
|
|
|
Amplitude |
20 |
|
|
|
|
Amplitude |
|
|
|
|
|
0 |
|
|
|
|
0 |
|
|
|
|
0 |
|
|
|
|
|||
|
|
|
|
|
|
|
|
|
|
|
|
|
|
|
|||
|
-20 |
|
|
|
|
|
-20 |
|
|
|
|
|
|
|
|
|
|
|
|
|
|
|
|
|
|
|
|
|
|
|
-1000 |
|
|
|
|
|
-40 |
|
|
|
|
|
-40 |
|
|
|
|
|
|
|
|
|
|
|
-60 |
|
|
|
|
|
-60 |
|
|
|
|
|
-2000 |
|
|
|
|
|
0 |
64 |
128 |
192 |
256 |
|
0 |
64 |
128 |
192 |
256 |
|
0 |
64 |
128 |
192 |
256 |
|
|
|
Frequency |
|
|
|
|
|
Frequency |
|
|
|
|
|
Frequency |
|
|
FIGURE 9-8
Frequency domain convolution. In the time domain, x[n] is convolved with h[n] resulting in y[n] , as is shown in Figs. (a), (d), and (g). This same procedure to be accomplished in the frequency domain. The DFT is used to find the frequency spectrum of the input signal, (b) & (c), and the system's frequency response, (e) & (f). Multiplying these two frequency domain signals results in the frequency spectrum of the output signal, (h) & (i). The Inverse DFT is then used to find the output signal, (g).
The FFT is a clever algorithm for rapidly calculating the DFT. Using the FFT, convolution by multiplication in the frequency domain can be hundreds of times faster than conventional convolution. Problems that take hours of calculation time are reduced to only minutes. This is why people get excited about the FFT, and processing signals in the frequency domain. The FFT will be presented in

182 The Scientist and Engineer's Guide to Digital Signal Processing
Chapter 12, and the method of FFT convolution in Chapter 18. For now, focus on how signals are convolved by frequency domain multiplication.
To start, we need to define how to multiply one frequency domain signal by another, i.e., what it means to write: X [f ] × H [ f ] ' Y [f ] . In polar form, the magnitudes are multiplied: Mag Y[ f ] ' Mag X [f ] × MagH [f ] , and the phases are added: Phase Y[ f ] ' PhaseX [f ] % Phase H [ f ]. To understand this, imagine a cosine wave entering a system with some amplitude and phase. Likewise, the output signal is also a cosine wave with some amplitude and phase. The polar form of the frequency response directly describes how the two amplitudes are related and how the two phases are related.
When frequency domain multiplication is carried out in rectangular form there are cross terms between the real and imaginary parts. For example, a sine wave entering the system can produce both cosine and sine waves in the output. To multiply frequency domain signals in rectangular notation:
EQUATION 9-1 Multiplication of frequency domain signals in rectangular form: Y [ f ] ' X [ f ] × H [ f ].
Re Y [ f ] ' Re X [ f ] Re H [ f ] & Im X [ f ] Im H [ f ]
Im Y [ f ] ' Im X [ f ] Re H [ f ] % Re X [ f ] Im H [ f ]
Focus on understanding multiplication using polar notation, and the idea of cosine waves passing through the system. Then simply accept that these more elaborate equations result when the same operations are carried out in rectangular form. For instance, let's look at the division of one frequency domain signal by another. In polar form, the division of frequency domain signals is achieved by the inverse operations we used for multiplication. To calculate: H [f ] ' Y [f ] / X [f ] , divide the magnitudes and subtract the phases, i.e., Mag H [ f ] ' Mag Y [f ] / MagX [f ] , Phase H [ f ] ' PhaseY [f ] & Phase X[ f ]. In rectangular form this becomes:
EQUATION 9-2
Division of frequency domain signals in rectangular form, where: H [ f ] ' Y[ f ] / X [ f ].
Re H [ f ] ' |
Re Y [ f ] Re X [ f ] % Im Y [ f ] Im X [ f ] |
||
Re X [ f ]2 |
% Im X [ f ]2 |
||
|
|||
Im H [ f ] ' |
Im Y [ f ] Re X [ f ] & Re Y [ f ] Im X [ f ] |
||
Re X [ f ]2 |
% Im X [ f ]2 |
||
|
|||
Now back to frequency domain convolution. You may have noticed that we cheated slightly in Fig. 9-8. Remember, the convolution of an N point signal with an M point impulse response results in an N% M& 1 point output signal. We cheated by making the last part of the input signal all zeros to allow this expansion to occur. Specifically, (a) contains 453 nonzero samples, and (b) contains 60 nonzero samples. This means the convolution of the two, shown in (c), can fit comfortably in the 512 points provided.
|
|
|
|
|
|
Chapter 9- Applications of the DFT |
|
|
|
|
|
|
183 |
|||||
|
2 |
|
|
|
|
|
2 |
|
|
|
|
|
20 |
|
|
|
|
|
|
|
a. Input signal |
|
|
|
|
b. Impulse response |
|
|
15 |
c. Convolution of (a) and (b) |
|
||||||
Amplitude |
1 |
|
|
|
|
Amplitude |
1 |
|
|
|
|
Amplitude |
10 |
|
|
|
|
|
|
|
|
|
|
|
|
|
|
= |
5 |
|
|
|
|
|
|||
|
|
|
|
|
|
t 0 |
|
|
|
|
|
|
|
|
|
|||
|
0 |
|
|
|
|
|
|
|
|
0 |
|
|
|
|
|
|||
|
|
|
|
|
|
|
|
|
|
|
|
|
-5 |
|
|
|
|
|
|
-1 |
|
|
|
|
|
-1 |
|
|
|
|
|
-10 |
|
|
|
|
|
|
|
|
|
|
|
|
|
|
|
|
|
|
-15 |
|
|
|
|
|
|
-2 |
|
|
|
|
|
-2 |
|
|
|
|
|
-20 |
|
|
|
|
|
|
0 |
64 |
128 |
192 |
2565 |
|
0 |
64 |
128 |
192 |
2565 |
|
0 |
64 |
128 |
192 |
2565 |
305 |
Sample number |
Sample number |
Sample number |
|
20 |
|
|
|
|
15 |
d. Overlap of adjecent periods |
|
|
|
10 |
|
|
|
Amplitude |
5 |
|
|
|
0 |
|
|
|
|
-5 |
|
|
|
|
|
-10 |
|
|
|
|
-15 |
|
|
|
|
-20 |
|
|
|
|
0 |
256 |
512 |
7678 |
Sample number
|
20 |
|
|
|
|
|
15 |
e. Circular convolution |
|
||
|
10 |
|
|
|
|
Amplitude |
5 |
|
|
|
|
0 |
|
|
|
|
|
-5 |
overlap |
|
|
||
|
-10 |
|
|
||
|
|
|
|
|
|
|
-15 |
|
|
|
|
|
-20 |
|
|
|
|
|
0 |
64 |
128 |
192 |
2556 |
Sample number
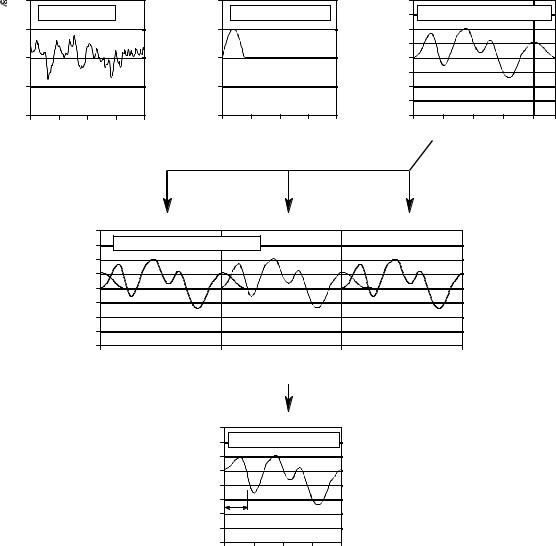
FIGURE 9-9
Circular convolution. A 256 sample signal, (a), convolved with a 51 sample impulse response, (b), results in a 306 sample signal, (c). If this convolution is performed in the frequency domain using 256 point DFTs, the 306 points in the correct convolution cannot fit into the 256 samples provided. As shown in (d), samples 256 through 305 of the output signal are pushed into the next period to the right, where they add to the beginning of the next period's signal. Figure (e) is a single period of the resulting signal.
Now consider the more general case in Fig. 9-9. The input signal, (a), is 256 points long, while the impulse response, (b), contains 51 nonzero points. This makes the convolution of the two signals 306 samples long, as shown in (c). The problem is, if we use frequency domain multiplication to perform the convolution, there are only 256 samples allowed in the output signal. In other words, 256 point DFTs are used to move (a) and (b) into the frequency
184 |
The Scientist and Engineer's Guide to Digital Signal Processing |
domain. After the multiplication, a 256 point Inverse DFT is used to find the output signal. How do you squeeze 306 values of the correct signal into the 256 points provided by the frequency domain algorithm? The answer is, you can't! The 256 points end up being a distorted version of the correct signal. This process is called circular convolution. It is important because you want to avoid it.
To understand circular convolution, remember that an N point DFT views the time domain as being an infinitely long periodic signal, with N samples per period. Figure (d) shows three periods of how the DFT views the output signal in this example. Since N ' 256 , each period consists of 256 points: 0-255, 256-511, and 512-767. Frequency domain convolution tries to place the 306 point correct output signal, shown in (c), into each of these 256 point periods. This results in 49 of the samples being pushed into the neighboring period to the right, where they overlap with the samples that are legitimately there. These overlapping sections add, resulting in each of the periods appearing as shown in (e), the circular convolution.
Once the nature of circular convolution is understood, it is quite easy to avoid. Simply pad each of the signals being convolved with enough zerosto allow the output signal room to handle the N% M& 1 points in the correct convolution. For example, the signals in (a) and (b) could be padded with zeros to make them 512 points long, allowing the use of 512 point DFTs. After the frequency domain convolution, the output signal would consist of 306 nonzero samples, plus 206 samples with a value of zero. Chapter 18 explains this procedure in detail.
Why is it called circular convolution? Look back at Fig. 9-9d and examine the center period, samples 256 to 511. Since all of the periods are the same, the portion of the signal that flows out of this period to the right, is the same that flows into this period from the left. If you only consider a single period, such as in (e), it appears that the right side of the signal is somehow connected to the left side. Imagine a snake biting its own tail; sample 255 is located next to sample 0, just as sample 100 is located next to sample 101. When a portion of the signal exits to the right, it magically reappears on the left. In other words, the N point time domain behaves as if it were circular.
In the last chapter we posed the question: does it really matter if the DFT's time domain is viewed as being N points, rather than an infinitely long periodic signal of period N? Circular convolution is an example where it does matter. If the time domain signal is understood to be periodic, the distortion encountered in circular convolution can be simply explained as the signal expanding from one period to the next. In comparison, a rather bizarre conclusion is reached if only N points of the time domain are considered. That is, frequency domain convolution acts as if the time domain is somehow wrapping into a circular ring with sample 0 being positioned next to sample N-1.