

BALANCE TABLE
The OECD
2001
|
|
|
|
|
|
|
|
|
(Mtoe) |
SUPPLY AND |
Coal |
Crude |
Petroleum |
Gas |
Nuclear |
Hydro |
Combustible |
Other* |
Total |
CONSUMPTION |
|
Oil |
Products |
|
|
|
Renewables |
|
|
|
|
|
|
|
|
|
& Waste |
|
|
Indigenous Prod. |
1014.97 |
1030.68 |
– |
927.83 |
596.80 |
105.71 |
172.98 |
35.85 |
3884.83 |
Imports |
318.08 |
1589.70 |
447.48 |
430.84 |
– |
– |
0.55 |
29.34 |
2815.99 |
Exports |
–217.22 |
–461.91 |
–339.79 |
–205.29 |
– |
– |
–0.21 |
–28.31 |
–1252.72 |
Intl. Marine Bunkers |
– |
– |
–78.01 |
– |
– |
– |
– |
– |
–78.01 |
Stock Changes |
–8.57 |
–5.83 |
–4.86 |
–18.02 |
– |
– |
–0.00 |
– |
–37.28 |
TPES |
1107.25 |
2152.65 |
24.82 |
1135.36 |
596.80 |
105.71 |
173.33 |
36.89 |
5332.81 |
Transfers |
– |
–35.28 |
40.62 |
– |
– |
– |
–0.02 |
– |
5.32 |
Statistical Diff. |
0.12 |
–6.56 |
0.23 |
–3.29 |
– |
– |
– |
– |
–9.50 |
Electricity Plants |
–803.36 |
–4.92 |
–104.28 |
–230.30 |
–588.58 |
–105.71 |
–20.70 |
708.17 |
–1149.67 |
CHP Plants |
–85.87 |
–0.72 |
–11.87 |
–81.15 |
–8.23 |
– |
–22.05 |
117.81 |
–92.07 |
Heat Plants |
–9.80 |
– |
–2.14 |
–11.72 |
– |
– |
–4.85 |
22.68 |
–5.84 |
Gas Works |
–2.53 |
– |
–0.53 |
0.37 |
– |
– |
– |
– |
–2.69 |
Pet. Refineries |
– |
–2130.78 |
2137.15 |
– |
– |
– |
–1.39 |
– |
4.99 |
Coal Transf. |
–66.13 |
0.04 |
–1.92 |
–0.19 |
– |
– |
–0.00 |
– |
–68.20 |
Liquefaction Plants |
– |
– |
– |
– |
– |
– |
– |
– |
– |
Other Transf. |
0.00 |
26.92 |
–27.19 |
–0.54 |
– |
– |
–0.16 |
– |
–0.96 |
Own Use |
–13.64 |
–0.33 |
–121.56 |
–89.99 |
– |
– |
–0.02 |
–70.33 |
–295.88 |
Distribution Losses |
–0.48 |
– |
–0.05 |
–3.22 |
– |
– |
–0.00 |
–57.60 |
–61.35 |
TFC |
125.57 |
1.02 |
1933.29 |
715.33 |
– |
– |
124.15 |
757.61 |
3656.97 |
Industry Sector |
107.27 |
1.02 |
337.37 |
299.44 |
– |
– |
66.28 |
287.53 |
1098.93 |
Transport Sector |
0.14 |
– |
1190.72 |
20.95 |
– |
– |
2.37 |
9.27 |
1223.46 |
Other Sectors |
17.47 |
– |
280.30 |
394.94 |
– |
– |
55.50 |
460.81 |
1209.01 |
Non–Energy Use |
0.68 |
– |
124.89 |
– |
– |
– |
– |
– |
125.57 |
*Other includes geothermal, solar, electricity and heat, wind, etc.
4 |
39

P |
|
|
|
|
R |
Crude Oil |
|||
I |
||||
C |
|
|
|
|
E |
Key Crude Oil Spot Prices |
|||
S |
||||
in US Dollars/barrel |
||||
|
||||
40 |
|
|
|
|
|
|
|
|
|
35 |
|
|
|
|
|
|
|
|
|
30 |
|
|
|
|
|
|
|
|
|
25 |
|
|
|
|
|
|
|
|
|
20 |
|
|
|
|
|
|
|
|
|
15 |
|
|
|
|
|
|
|
|
|
10 |
|
|
|
|
|
|
|
|
|
5 |
|
|
|
|
|
|
|
|
|
0 |
|
|
|
|
|
|
|
|
|
Jan-85 |
Jan-87 |
Jan-89 |
Jan-91 |
Jan-93 |
Jan-95 |
Jan-97 |
Jan-99 |
Jan-01 |
Jan-03 |
Monthly Averages
Dubai |
|
Brent |
|
WTI |
|
|
Petroleum Products
Rotterdam Oil Product Spot Prices
in US Dollars/barrel
55 |
|
|
|
|
|
|
|
|
|
50 |
|
|
|
|
|
|
|
|
|
45 |
|
|
|
|
|
|
|
|
|
40 |
|
|
|
|
|
|
|
|
|
35 |
|
|
|
|
|
|
|
|
|
30 |
|
|
|
|
|
|
|
|
|
25 |
|
|
|
|
|
|
|
|
|
20 |
|
|
|
|
|
|
|
|
|
15 |
|
|
|
|
|
|
|
|
|
10 |
|
|
|
|
|
|
|
|
|
5 |
|
|
|
|
|
|
|
|
|
0 |
|
|
|
|
|
|
|
|
|
Jan-85 |
Jan-87 |
Jan-89 |
Jan-91 |
Jan-93 |
Jan-95 |
Jan-97 |
Jan-99 |
Jan-01 |
Jan-03 |
Monthly Averages
Premium |
Gasoil |
HFO |
40 |
|
|

Coal
Steam Coal Import Costs
in US Dollars/tonne
70 |
|
|
|
|
|
|
|
|
|
|
60 |
|
|
|
|
|
|
|
|
|
|
50 |
|
|
|
|
|
|
|
|
|
|
40 |
|
|
|
|
|
|
|
|
|
|
30 |
|
|
|
|
|
|
|
|
|
|
20 |
|
|
|
|
|
|
|
|
|
|
10 |
|
|
|
|
|
|
|
|
|
|
0 |
|
|
|
|
|
|
|
|
|
|
1Q-83 |
1Q-85 |
1Q-87 |
1Q-89 |
1Q-91 |
1Q-93 |
1Q-95 |
1Q-97 |
1Q-99 |
1Q-01 |
1Q-03 |
Quarterly Averages
EU |
|
Japan |
|
5 |
Natural Gas
Natural Gas Import Prices
in US Dollars/MBtu
6 |
|
|
|
|
|
|
|
|
|
5 |
|
|
|
|
|
|
|
|
|
4 |
|
|
|
|
|
|
|
|
|
3 |
|
|
|
|
|
|
|
|
|
2 |
|
|
|
|
|
|
|
|
|
1 |
|
|
|
|
|
|
|
|
|
0 |
|
|
|
|
|
|
|
|
|
1984 |
1986 |
1988 |
1990 |
1992 |
1994 |
1996 |
1998 |
2000 |
2002 |
|
|
|
|
Yearly Averages |
|
|
|
|
|
Japan** |
USA* |
Belgium* |
Germany* |
Spain* |
*Pipeline **LNG
41

P
R
I RETAIL PRICES(a)
C
E
S
|
Heavy Fuel Oil |
Light Fuel Oil |
Automotive |
Unleaded |
|
for Industry(b) |
for Households |
Diesel Oil(c) |
Premium(d) |
|
(tonne) |
(1000 litres) |
(litre) |
(litre) |
|
|
|
|
|
Australia |
.. L |
.. L |
0.333 L |
0.489 L |
Austria |
97.76 L |
396.12 L |
0.607 L |
0.888 L |
Belgium |
184.79 L |
300.60 L |
0.618 L |
0.984 L |
Canada |
202.80 L |
346.51 L |
0.431 L |
0.468 L |
Chinese Taipei |
228.84 L |
x L |
0.433 L |
0.569 L |
Czech Republic |
146.76 L |
306.19 L |
0.580 L |
0.811 L |
Denmark |
259.39 L |
768.89 L |
0.750 L |
1.109 L |
Finland |
243.37 L |
380.05 L |
0.648 L |
1.068 L |
France |
189.70 L |
390.25 L |
0.665 L |
1.033 L |
Germany |
200.03 L |
360.83 L |
0.733 L |
1.046 L |
Greece |
232.63 L |
569.41 L |
0.532 L |
0.731 L |
Hungary |
179.86 L |
300.35 L |
0.695 L |
0.962 L |
India |
309.58 L |
185.43 L |
0.416 L |
0.613 L |
Ireland |
271.60 L |
444.69 L |
0.649 L |
0.879 L |
Italy |
222.93 L |
850.29 L |
0.724 L |
1.056 L |
Japan |
219.42 L |
373.66 L |
0.518 L |
0.829 L |
Korea |
292.54 L |
497.34 L |
0.606 L |
.. L |
Luxembourg |
205.04 L |
314.89 L |
0.566 L |
0.779 L |
Mexico |
130.72 L |
.. L |
0.358 L |
0.584 L |
Netherlands |
244.22 L |
597.39 L |
0.677 L |
1.144 L |
New Zealand |
307.31 L |
.. L |
0.294 L |
0.512 L |
Norway |
497.88 L |
741.70 L |
0.878 L |
1.198 L |
Poland |
143.68 L |
379.06 L |
0.541 L |
0.820 L |
Portugal |
246.17 L |
x L |
0.641 L |
0.957 L |
Slovak Republic |
153.28 L |
296.93 L |
0.549 L |
0.707 L |
South Africa |
184.01 L |
.. L |
0.381 L |
0.419 L |
Spain |
213.28 L |
385.91 L |
0.597 L |
0.815 L |
Sweden |
x L |
710.75 L |
0.720 L |
1.020 L |
Switzerland |
212.14 L |
288.61 L |
0.767 L |
0.892 L |
Turkey |
278.47 L |
752.29 L |
0.763 L |
1.003 L |
United Kingdom |
219.53 L |
265.52 L |
1.011 L |
1.165 L |
United States |
174.48 L |
335.77 L |
0.380 L |
0.381 L |
|
(a) Prices are for 4th Quarter 2002, or latest available (L). (b) Low Sulphur Fuel Oil for Belgium, Chinese Taipei, Denmark, |
42 |
Finland, France, Germany, Greece, Luxembourg, Netherlands, Norway, Slovak Republic and Switzerland; High Sulphur Fuel Oil |
for all other countries. (c) For commercial purposes. (d) Unleaded Regular for Australia, Canada, Japan, Mexico, New Zealand |
|
|
|

IN SELECTED COUNTRIES in US Dollars/Unit
Nat Gas for |
|
Nat Gas for |
Steam Coal |
Electricity for |
Electricity for |
|
Industry(e) |
|
Households(e) |
for Industry(f) |
Industry(g) |
Households(g) |
|
(107 kcal GCV*) |
(107 kcal GCV*) |
(tonne) |
(kWh) |
(kWh) |
|
|
135.76 L |
|
332.34 L |
.. L |
0.0357 L |
0.0619 L |
Australia |
154.92 L |
|
391.83 L |
67.46 L |
0.0921 L |
0.1357 L |
Austria |
111.65 L |
|
419.41 L |
.. L |
0.0477 L |
0.1323 L |
Belgium |
142.93 L |
|
232.52 L |
.. L |
0.0386 L |
0.0601 L |
Canada |
275.93 L |
|
356.87 L |
74.16 L |
0.0535 L |
0.0746 L |
Chinese Taipei |
165.10 L |
|
268.66 L |
19.67 L |
0.0554 L |
0.0807 L |
Czech Republic |
c L |
|
794.34 L |
78.75 L |
0.0739 L |
0.2217 L |
Denmark |
137.81 L |
|
218.35 L |
85.90 L |
0.0460 L |
0.0908 L |
Finland |
187.27 L |
|
461.64 L |
67.85 L |
0.0368 L |
0.1045 L |
France |
187.93 L |
|
373.41 L |
227.01 L |
0.079 L |
0.1666 L |
Germany |
199.82 L |
|
302.89 L |
.. L |
0.0493 L |
0.0832 L |
Greece |
204.73 L |
|
231.47 L |
45.58 L |
0.0641 L |
0.0857 L |
Hungary |
.. L |
|
.. L |
19.36 L |
0.0801 L |
0.0388 L |
India |
199.10 L |
|
351.34 L |
.. L |
0.0770 L |
0.1110 L |
Ireland |
141.56 L |
|
639.03 L |
37.13 L |
0.093 L |
0.1342 L |
Italy |
406.4 L |
|
1168.18 L |
36.69 L |
0.1426 L |
0.2144 L |
Japan |
.. L |
|
.. L |
50.99 L |
0.0656 L |
0.0853 L |
Korea |
.. |
|
272.69 L |
.. L |
.. L |
0.1117 L |
Luxembourg |
113.24 L |
|
.. L |
x L |
0.0584 L |
0.0906 L |
Mexico |
208.35 L |
|
488.55 L |
.. L |
0.0575 L |
0.1674 L |
Netherlands |
200.74 L |
|
365.92 L |
c L |
0.0354 L |
0.0705 L |
New Zealand |
x L |
|
x L |
55.51 L |
0.0349 L |
0.0863 L |
Norway |
175.24 L |
|
320.20 L |
41.75 L |
0.0525 L |
0.0900 L |
Poland |
250.74 L |
|
712.87 L |
35.76 L |
0.0726 L |
0.1346 L |
Portugal |
150.49 L |
|
137.06 L |
25.25 L |
0.0526 L |
0.0730 L |
Slovak Republic |
233.37 L |
|
x L |
12.25 L |
0.0122 L |
0.0317 L |
South Africa |
189.64 L |
|
540.24 L |
.. L |
0.0411 L |
0.1086 L |
Spain |
.. L |
|
.. L |
102.44 L |
0.0342 L |
0.1026 L |
Sweden |
290.38 L |
|
514.80 L |
53.21 L |
0.0777 L |
0.1235 L |
Switzerland |
212.75 L |
|
257.23 L |
39.96 L |
0.0937 L |
0.0909 L |
Turkey |
154.73 L |
|
333.49 L |
64.50 L |
0.0542 L |
0.1105 L |
United Kingdom |
176.27 L |
|
311.01 L |
36.88 L |
0.0470 L |
0.0830 L |
United States |
|
|
|
|
|
|
|
and the United States; Leaded Regular for India. (e) Gross calorific value. (f) Brown coal for the Czech Republic and Turkey. |
||||||
(g) Price excluding tax for Australia and the United States. (L) Latest data available. |
|
|
||||
.. not available |
x not applicable c confidential |
|
|
|
||
5 |
43

E |
|
|
|
|
|
|
|
|
|
|
|
|
|
|
|
|
M |
|
|
CO2 Emissions by Fuel |
|
|
|
||||||||||
I |
|
|
|
|
|
|||||||||||
S |
|
|
|
|
|
|
|
|
|
|
|
|
|
|
|
|
S |
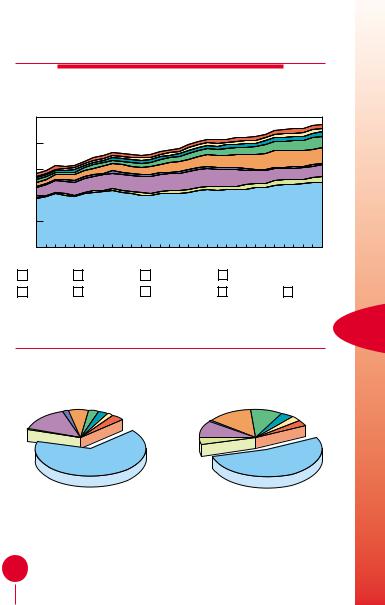
Evolution from 1971 to 2001 of World CO2 Emissions* |
|
||||||||||||||
I |
|
|||||||||||||||
|
|
|
|
|
by Fuel (Mt of CO2) |
|
|
|
|
|
|
|||||
O |
|
|
|
|
|
|
|
|
|
|
|
|||||
|
|
|
|
|
|
|
|
|
|
|
|
|
|
|
|
|
N |
25000 |
|
|
|
|
|
|
|
|
|
|
|
|
|
|
|
S |
20000 |
|
|
|
|
|
|
|
|
|
|
|
|
|
|
|
|
|
|
|
|
|
|
|
|
|
|
|
|
|
|
|
|
|
15000 |
|
|
|
|
|
|
|
|
|
|
|
|
|
|
|
|
10000 |
|
|
|
|
|
|
|
|
|
|
|
|
|
|
|
|
5000 |
|
|
|
|
|
|
|
|
|
|
|
|
|
|
|
|
0 |
|
|
|
|
|
|
|
|
|
|
|
|
|
|
|
|
1971 |
1973 |
1975 |
1977 |
1979 |
1981 |
1983 |
1985 |
1987 |
1989 |
1991 |
1993 |
1995 |
1997 |
1999 |
2001 |
|
|
Coal |
|
|
Oil |
|
Gas |
1973 and 2001 Fuel Shares of |
|||||||
|
|
|
CO2 Emissions* |
|
|||
1973 |
|
|
|
|
2001 |
||
Gas |
Coal |
|
Gas |
Coal |
|||
14.4% |
|
|
34.9% |
20.0% |
38.0% |
||
50.7% |
|
42.0% |
|
|
|
|
|
|
15 671 Mt of CO2 |
|
23 683 Mt of CO2 |
|
Revised 1996 IPCC Guidelines. |
|
|
44 |
only. |
|
|
|
|
CO2 Emissions by Region
Evolution from 1971 to 2001 of World CO2 Emissions* by Region (Mt of CO2)
1973 |
1975 |
1977 |
1979 |
1981 |
1983 |
1985 |
1987 |
1989 |
1991 |
1993 |
1995 |
1997 |
1999 |
2001 |
|
OECD |
|
Middle East |
|
Former USSR |
|
Non-OECD Europe |
||
|
|
|
|
||||||
|
China |
|
Asia** |
|
Latin America |
|
Africa |
|
Bunkers |
|
|
|
|
|
|||||
|
|
|
|
|
|||||
1973 and 2001 Regional Shares of
CO2 Emissions*
6 |
|
1973 |
|
|
|
2001 |
||
-OECD |
China |
Asia** |
Latin America |
|
China |
Asia** |
Latin America |
Europe |
5.7% |
3.0% |
2.7% |
Non- |
9.2% |
3.6% |
|
1.7% |
|
|
Africa 1.9% |
OECD |
13.1% |
|
Africa 3.0% |
|
|
|
Bunkers 3.6% |
Europe |
|
|
Bunkers 3.3% |
|
|
|
|
1.1% |
|
|
|
|
|
|
|
Former |
|
|
|
|
|
|
|
USSR |
|
|
|
|
|
|
|
9.5% |
|
|
|
|
OECD |
Middle East |
|
OECD |
|
|
4.4% |
|
|
||
65.9% |
|
|
52.8% |
||
|
|
|
|
|
|
15 671 Mt of CO2 |
|
|
|
23 683 Mt of CO2 |
|
using IEA’s Energy Balance Tables and the Revised 1996 IPCC Guidelines. 2 emissions are from fuel combustion only. ** Asia excludes China.
45

O U T L O O K
O U T L O O K F O R W O R L D T P E S
TPES* Outlook by Fuel
(Mtoe)
18000
16000
14000
12000
10000
8000
6000
4000
2000
0
1971
2000 |
2010 |
2020 |
2030 |
|
Coal |
|
Oil* |
|
Gas |
|
|
Nuclear |
|
Hydro |
|
|
Other** |
|
|
|
|
|||
|
|
|
|
|||
Fuel Shares of TPES* in 2010 and 2030
|
2010 |
2030 |
||
Nuclear |
Hydro |
Other** |
Hydro |
Other** |
2.3% |
10.9% Coal |
Nuclear 2.2% |
10.1% Coal |
|
6.2% |
|
22.3% |
4.3% |
22.1% |
Gas |
|
Gas |
||
|
|
|
||
23.1% |
|
|
25.8% |
|
|
|
Oil* |
|
Oil* |
|
|
35.3% |
|
35.4% |
|
12 100 Mtoe |
16 300 Mtoe |
||
* Includes bunkers.
46 |
** Other includes combustible renewables & waste, geothermal, solar, wind, tide, etc. |
|

T O 2 0 3 0
TPES Outlook by Region
(Mtoe)
18000
16000
14000
12000
10000
8000
6000
4000
2000
0
1971
2000 |
2010 |
2020 |
2030 |
|
OECD |
|
Middle East |
|
Transition Economies* |
|
China |
|
Asia** |
|
Latin America |
|
Africa |
|
Bunkers |
|
|
|
|
||||
|
|
|
|
Regional Shares of TPES in 2010 and 2030
|
2010 |
|
|
|
2030 |
|
|
|
Asia** |
Latin |
|
|
|
Latin |
|
|
America |
Africa |
|
Asia** |
America |
Africa |
|
China |
12.4% |
5.0% |
5.2% |
|
14.7% |
6.3% |
6.2% |
|
|
Bunkers |
China |
|
Bunkers |
||
12.5% |
|
|
|
||||
|
|
1.2% |
|
|
1.1% |
||
|
|
|
|
14.3% |
|
||
|
|
|
|
|
|
|
|
Transition |
|
|
|
|
Transition |
|
|
Economies* |
|
|
|
Economies* |
|
|
|
10.2% |
|
|
|
|
9.2% |
|
|
Middle |
|
|
|
|
Middle East |
|
|
East |
|
|
|
|
|
|
|
|
|
|
|
4.6% |
|
|
|
4.0% |
|
|
49.5% |
|
|
43.7% |
|
|
|
|
|
|
|||
|
12 100 Mtoe |
|
|
16 300 Mtoe |
|
||
|
|
*Includes Former USSR and Non-OECD Europe. |
|
||||
|
|
|
** Asia excludes China. |
|
|
||
7 |
47

E |
|
|
|
|
|
|
|
|
|
|
|
|
N |
|
Selected Energy Indicators for 2001 |
||||||||||
E |
|
|||||||||||
R |
|
|
|
|
|
|
|
|
|
|
|
|
|
|
|
|
|
|
|
|
|
|
|
|
|
|
|
|
|
|
|
|
|
|
|
|
|
|
G |
|
|
|
|
|
|
|
|
|
|
|
|
Y |
|
Region/ |
Popul- |
|
GDP |
GDP |
Energy |
Net |
|
TPES |
Elec. |
CO2** |
|
|
|
|
|||||||||
I |
|
Country |
ation |
|
|
(PPP) |
Prod. |
Imports |
|
|
Cons.* |
Emissions |
|
|
(million) |
(billion |
(billion |
(Mtoe) |
(Mtoe) |
|
(Mtoe) |
(TWh) |
(Mt |
||
N |
|
|
|
95 US$) |
95 US$) |
|
|
|
|
|
of CO2) |
|
D |
|
World |
6102.56 |
34399.76 |
42374.34 |
10209.14 |
– |
10029.10 |
14196.98 |
23683.25 |
||
I |
|
|||||||||||
|
OECD |
1138.52 |
27880.92 |
24803.26 |
3884.83 |
1563.27 |
5332.81 |
8970.06 |
12511.02 |
|||
C |
|
|||||||||||
|
Middle East |
168.85 |
588.24 |
1005.48 |
1293.55 |
–895.95 |
389.65 |
446.03 |
1044.57 |
|||
A |
|
|||||||||||
|
Former USSR |
289.09 |
526.97 |
1489.34 |
1305.93 |
–363.14 |
935.34 |
1110.66 |
2239.29 |
|||
T |
|
|||||||||||
|
|
|
|
|
|
|
|
|
|
|
|
|
O |
|
Non–OECD Europe |
57.90 |
138.58 |
348.14 |
61.77 |
38.70 |
99.16 |
154.05 |
253.52 |
||
R |
|
China |
1278.58 |
1282.03 |
4863.13 |
1138.67 |
22.84 |
1155.65 |
1397.26 |
3112.64 |
||
S |
|
Asia |
1935.20 |
1765.51 |
5530.79 |
1009.83 |
164.82 |
1152.25 |
1062.92 |
2179.32 |
||
|
|
Latin America |
421.91 |
1605.23 |
2636.04 |
616.90 |
–153.84 |
449.92 |
637.53 |
841.82 |
||
|
|
Africa |
812.51 |
612.29 |
1698.16 |
897.68 |
–372.09 |
514.33 |
418.47 |
720.23 |
||
|
|
|
|
|
|
|
|
|
|
|
|
|
|
|
|
|
|
|
|
|
|
|
|
|
|
|
|
Albania |
3.16 |
3.27 |
10.84 |
0.67 |
1.04 |
1.71 |
3.55 |
3.34 |
||
|
|
Algeria |
30.84 |
49.84 |
176.97 |
144.33 |
–115.50 |
29.44 |
22.30 |
68.22 |
||
|
|
|
|
|
|
|
|
|
|
|
|
|
|
|
Angola |
13.51 |
7.10 |
28.78 |
43.56 |
–34.98 |
8.45 |
1.36 |
5.70 |
||
|
|
Argentina |
37.49 |
279.98 |
385.96 |
82.86 |
–24.70 |
57.60 |
79.68 |
117.66 |
||
|
|
|
|
|
|
|
|
|
|
|
|
|
|
|
Armenia |
3.81 |
4.07 |
9.60 |
0.60 |
1.70 |
2.30 |
3.87 |
4.23 |
||
|
|
Australia |
19.47 |
468.04 |
490.57 |
250.44 |
–134.09 |
115.63 |
201.23 |
369.64 |
||
|
|
|
|
|
|
|
|
|
|
|
|
|
|
|
Austria |
8.13 |
271.17 |
199.07 |
9.72 |
20.00 |
30.72 |
60.97 |
66.63 |
||
|
|
Azerbaijan |
8.12 |
3.74 |
21.74 |
19.58 |
–7.89 |
11.58 |
17.09 |
26.17 |
||
|
|
|
|
|
|
|
|
|
|
|
|
|
|
|
Bahrain |
0.65 |
7.21 |
9.32 |
7.49 |
–1.55 |
6.46 |
6.19 |
14.78 |
||
|
|
Bangladesh |
133.35 |
51.49 |
196.23 |
16.20 |
4.28 |
20.41 |
13.26 |
31.00 |
||
|
|
|
|
|
|
|
|
|
|
|
|
|
|
|
Belarus |
9.97 |
14.89 |
70.07 |
3.53 |
20.86 |
24.42 |
29.86 |
56.38 |
||
|
|
Belgium |
10.28 |
319.13 |
256.05 |
13.08 |
52.06 |
59.00 |
85.04 |
119.60 |
||
|
|
|
|
|
|
|
|
|
|
|
|
|
|
|
Benin |
6.44 |
2.73 |
5.89 |
1.48 |
0.55 |
2.03 |
0.42 |
1.59 |
||
|
|
Bolivia |
8.52 |
8.04 |
18.13 |
6.94 |
–2.67 |
4.27 |
3.50 |
8.31 |
||
|
|
|
|
|
|
|
|
|
|
|
|
|
|
|
Bosnia and Herzegovina |
4.06 |
6.43 |
26.86 |
3.28 |
1.08 |
4.36 |
7.62 |
15.37 |
||
|
|
Brazil |
172.39 |
798.75 |
1140.30 |
145.93 |
41.06 |
185.08 |
309.18 |
311.87 |
||
|
|
|
|
|
|
|
|
|
|
|
|
|
48 ** Gross production + imports – exports – transmission/distribution losses.