

B Y F U E L
The OECD
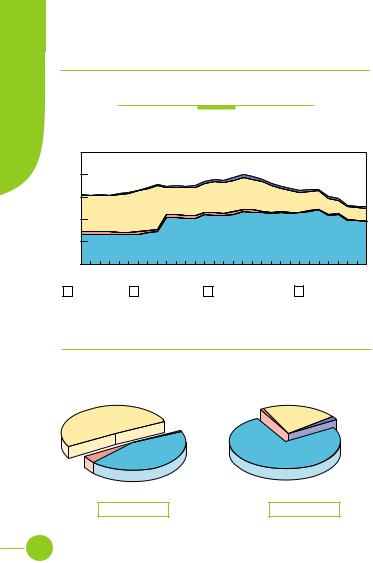
Evolution from 1971 to 2001 of OECD Total Final Consumption by Fuel (Mtoe)
4000 |
|
|
|
|
|
|
|
|
|
|
|
|
|
|
|
3500 |
|
|
|
|
|
|
|
|
|
|
|
|
|
|
|
3000 |
|
|
|
|
|
|
|
|
|
|
|
|
|
|
|
2500 |
|
|
|
|
|
|
|
|
|
|
|
|
|
|
|
2000 |
|
|
|
|
|
|
|
|
|
|
|
|
|
|
|
1500 |
|
|
|
|
|
|
|
|
|
|
|
|
|
|
|
1000 |
|
|
|
|
|
|
|
|
|
|
|
|
|
|
|
500 |
|
|
|
|
|
|
|
|
|
|
|
|
|
|
|
0 |
|
|
|
|
|
|
|
|
|
|
|
|
|
|
|
1971 |
1973 |
1975 |
1977 |
1979 |
1981 |
1983 |
1985 |
1987 |
1989 |
1991 |
1993 |
1995 |
1997 |
1999 |
2001 |
|
Coal |
|
Oil |
|
Gas |
|
Combustible Renewables & Waste |
|
Electricity |
|
Other* |
|
|
|
|||
|
|
|
|
|
|
1973 and 2001 Fuel Shares of
Total Final Consumption
|
1973 |
|
|
2001 |
|
Combustible |
Electricity |
Other* |
Electricity |
Other* |
Coal |
Renewables |
11.4% |
0.7% Coal |
Combustible 19.1% |
1.6% |
3.4% |
& Waste |
|
10.1% |
Renewables |
|
|
2.7% |
|
|
& Waste |
|
|
|
|
|
3.4% |
|
|
Gas |
|
|
Gas |
|
|
18.2% |
|
|
|
|
|
|
|
Oil |
19.6% |
|
Oil |
|
|
56.8% |
|
|
52.9% |
|
2 836 Mtoe |
3 657 Mtoe |
|||
*Other includes geothermal, solar, wind, heat, etc.
29
3 |

C |
|
|
|
|
|
|
|
|
|
|
|
|
|
|
|
|
|
O |
T O T A L F I N A L C O N S U M P T I O N |
||||||||||||||||
N |
|||||||||||||||||
S |
|||||||||||||||||
U |
|
|
|
|
|
The World |
|
|
|
|
|
|
|||||
M |
|
|
|
|
|
|
|
|
|
|
|
||||||
P |
|
|
|
|
|
|
|
|
|
|
|
|
|
|
|
|
|
T |
Evolution from 1971 to 2001 of World Total Final Consumption* |
||||||||||||||||
I |
|||||||||||||||||
|
|
|
|
|
by Region (Mtoe) |
|
|
|
|
|
|
||||||
O |
|
|
|
|
|
|
|
|
|
|
|
||||||
8000 |
|
|
|
|
|
|
|
|
|
|
|
|
|
|
|
||
N |
|
|
|
|
|
|
|
|
|
|
|
|
|
|
|
||
7000 |
|
|
|
|
|
|
|
|
|
|
|
|
|
|
|
||
|
|
|
|
|
|
|
|
|
|
|
|
|
|
|
|
||
|
6000 |
|
|
|
|
|
|
|
|
|
|
|
|
|
|
|
|
|
5000 |
|
|
|
|
|
|
|
|
|
|
|
|
|
|
|
|
|
4000 |
|
|
|
|
|
|
|
|
|
|
|
|
|
|
|
|
|
3000 |
|
|
|
|
|
|
|
|
|
|
|
|
|
|
|
|
|
2000 |
|
|
|
|
|
|
|
|
|
|
|
|
|
|
|
|
|
1000 |
|
|
|
|
|
|
|
|
|
|
|
|
|
|
|
|
|
0 |
|
|
|
|
|
|
|
|
|
|
|
|
|
|
|
|
|
1971 |
1973 |
1975 |
1977 |
1979 |
1981 |
1983 |
1985 |
1987 |
1989 |
1991 |
1993 |
1995 |
1997 |
1999 |
2001 |
|
|
OECD |
|
Middle East |
|
Former USSR |
|
Non-OECD Europe |
|
|
|
|
||||
|
China |
|
Asia** |
|
Latin America |
|
Africa |
|
|
|
|
1973 and 2001 Regional Shares of
Total Final Consumption*
|
Non- |
1973 |
|
|
|
2001 |
||
|
|
Asia** |
Latin |
|
|
|
Latin |
|
|
OECD |
China |
Non- |
China |
Asia** |
|||
Former |
Europe |
5.8% |
5.1% |
America |
11.8% |
America |
||
2.7% |
|
5.0% |
OECD |
11.4% |
5.1% Africa |
|||
USSR |
|
|
|
|||||
|
|
|
Africa |
Europe |
|
|
5.5% |
|
14.1% |
|
|
|
|
|
|||
|
|
|
2.8% |
0.9% |
|
|
|
|
Middle |
|
|
|
|
Former |
|
|
|
|
|
|
|
USSR |
|
|
|
|
East |
|
|
|
|
|
|
|
|
|
|
|
|
9.0% |
|
|
|
|
2.1% |
|
|
|
|
|
|
|
|
|
|
|
|
Middle |
|
|
|
|
|
|
|
|
|
|
|
|
|
|
|
|
|
62.4% |
East |
|
|
|
|
|
|
|
4.0% |
|
|
52.3% |
|
|
4 548 Mtoe |
|
|
|
6 995 Mtoe |
|||
* Prior to 1994 Combustible Renewables & Waste final consumption has been estimated
based on TPES. **Asia excludes China.
30

B Y R E G I O N
The OECD
Evolution from 1971 to 2001 of OECD Total Final Consumption by Region (Mtoe)
4000 |
|
|
|
|
|
|
|
|
|
|
|
|
|
|
|
3500 |
|
|
|
|
|
|
|
|
|
|
|
|
|
|
|
3000 |
|
|
|
|
|
|
|
|
|
|
|
|
|
|
|
2500 |
|
|
|
|
|
|
|
|
|
|
|
|
|
|
|
2000 |
|
|
|
|
|
|
|
|
|
|
|
|
|
|
|
1500 |
|
|
|
|
|
|
|
|
|
|
|
|
|
|
|
1000 |
|
|
|
|
|
|
|
|
|
|
|
|
|
|
|
500 |
|
|
|
|
|
|
|
|
|
|
|
|
|
|
|
0 |
|
|
|
|
|
|
|
|
|
|
|
|
|
|
|
1971 |
1973 |
1975 |
1977 |
1979 |
1981 |
1983 |
1985 |
1987 |
1989 |
1991 |
1993 |
1995 |
1997 |
1999 |
2001 |
|
OECD North America |
|
OECD Pacific |
|
OECD Europe |
1973 and 2001 Regional Shares of
Total Final Consumption
1973 |
2001 |
OECD Europe |
OECD Europe |
36.7% |
35.0% |
OECD |
OECD |
Pacific |
Pacific |
10.5% |
15.3% |
OECD North America |
OECD North America |
52.8% |
49.7% |
2 836 Mtoe |
3 657 Mtoe |
3 |
31
C |
|
|
|
|
|
|
|
|
|
|
|
|
|
|
|
|
O |
T O T A L F I N A L C O N S U M P T I O N |
|||||||||||||||
N |
||||||||||||||||
S |
||||||||||||||||
U |
|
|
|
|
|
|
Coal |
|
|
|
|
|
|
|
||
M |
|
|
|
|
|
|
|
|
|
|
|
|
|
|||
P |
|
|
|
|
|
|
|
|
|
|
|
|
|
|
|
|
T |
Evolution from 1971 to 2001 of Total Final Consumption |
|
||||||||||||||
I |
|
|||||||||||||||
|
|
|
|
|
by Sector (Mtoe) |
|
|
|
|
|
|
|||||
O |
|
|
|
|
|
|
|
|
|
|
|
|||||
1000 |
|
|
|
|
|
|
|
|
|
|
|
|
|
|
|
|
N |
|
|
|
|
|
|
|
|
|
|
|
|
|
|
|
|
|
|
|
|
|
|
|
|
|
|
|
|
|
|
|
|
|
|
800 |
|
|
|
|
|
|
|
|
|
|
|
|
|
|
|
|
600 |
|
|
|
|
|
|
|
|
|
|
|
|
|
|
|
|
400 |
|
|
|
|
|
|
|
|
|
|
|
|
|
|
|
|
200 |
|
|
|
|
|
|
|
|
|
|
|
|
|
|
|
|
0 |
|
|
|
|
|
|
|
|
|
|
|
|
|
|
|
|
1971 |
1973 |
1975 |
1977 |
1979 |
1981 |
1983 |
1985 |
1987 |
1989 |
1991 |
1993 |
1995 |
1997 |
1999 |
2001 |
|
Industry |
|
Transport |
|
Other sectors* |
|
Non-energy use |
|
|
|
|
1973 and 2001 Shares of
World Coal Consumption
|
1973 |
|
2001 |
|
Other sectors* |
Non-energy |
Transport |
Other sectors* |
|
50.9% |
21.8% |
Non-energy |
||
|
use |
1.1% |
|
use |
|
0.8% |
|
|
|
|
|
|
2.1% |
|
|
|
|
|
|
Transport |
Industry** 44.1% |
Industry 75.0% |
|
|
4.2% |
|
|
||
|
|
|
||
|
623 Mtoe |
|
515 Mtoe |
|
*Other sectors (agriculture, commercial & public service, residential and non-specified) includes industry for China prior to 1980.
**1973 share for industry should be much higher due to the reason explained in the above note.
32

B Y S E C T O R
Oil
Evolution from 1971 to 2001 of Total Final Consumption by Sector (Mtoe)
3500 |
|
|
|
|
|
|
|
|
|
|
|
|
|
|
|
3000 |
|
|
|
|
|
|
|
|
|
|
|
|
|
|
|
2500 |
|
|
|
|
|
|
|
|
|
|
|
|
|
|
|
2000 |
|
|
|
|
|
|
|
|
|
|
|
|
|
|
|
1500 |
|
|
|
|
|
|
|
|
|
|
|
|
|
|
|
1000 |
|
|
|
|
|
|
|
|
|
|
|
|
|
|
|
500 |
|
|
|
|
|
|
|
|
|
|
|
|
|
|
|
0 |
|
|
|
|
|
|
|
|
|
|
|
|
|
|
|
1971 |
1973 |
1975 |
1977 |
1979 |
1981 |
1983 |
1985 |
1987 |
1989 |
1991 |
1993 |
1995 |
1997 |
1999 |
2001 |
|
Industry |
|
Transport |
|
Other sectors* |
|
Non-energy use |
|
|
|
|
1973 and 2001 Shares of
World Oil Consumption
1973 |
|
2001 |
|
|
Other sectors* |
Non-energy |
Other sectors* |
Non-energy |
|
use |
use |
|||
25.2% |
17.1% |
|||
6.4% |
6.2% |
|||
|
|
|||
|
Industry |
|
Industry |
|
|
|
19.7% |
||
|
26.2% |
|
||
Transport 42.2% |
Transport 57.0% |
|
||
|
|
|||
2 142 Mtoe |
3 008 Mtoe |
|||
*Other sectors comprises agriculture, commercial & public service, residential and non-specified.
33
3 |

C |
|
|
|
|
|
|
|
|
|
|
|
|
|
|
|
|
O |
T O T A L F I N A L C O N S U M P T I O N |
|||||||||||||||
N |
||||||||||||||||
S |
||||||||||||||||
U |
|
|
|
|
|
|
Gas |
|
|
|
|
|
|
|
||
M |
|
|
|
|
|
|
|
|
|
|
|
|
|
|||
P |
|
|
|
|
|
|
|
|
|
|
|
|
|
|
|
|
T |
Evolution from 1971 to 2001 of Total Final Consumption |
|
||||||||||||||
I |
|
|||||||||||||||
O |
1200 |
|
|
|
|
by Sector (Mtoe) |
|
|
|
|
|
|
||||
N |
|
|
|
|
|
|
|
|
|
|
|
|
|
|
|
|
|
|
|
|
|
|
|
|
|
|
|
|
|
|
|
|
|
|
1000 |
|
|
|
|
|
|
|
|
|
|
|
|
|
|
|
|
800 |
|
|
|
|
|
|
|
|
|
|
|
|
|
|
|
|
600 |
|
|
|
|
|
|
|
|
|
|
|
|
|
|
|
|
400 |
|
|
|
|
|
|
|
|
|
|
|
|
|
|
|
|
200 |
|
|
|
|
|
|
|
|
|
|
|
|
|
|
|
|
0 |
|
|
|
|
|
|
|
|
|
|
|
|
|
|
|
|
1971 |
1973 |
1975 |
1977 |
1979 |
1981 |
1983 |
1985 |
1987 |
1989 |
1991 |
1993 |
1995 |
1997 |
1999 |
2001 |
|
Industry |
|
Transport |
|
Other sectors* |
|
|
|
1973 and 2001 Shares of
World Gas Consumption
1973 |
2001 |
Other sectors* |
Other sectors* |
41.0% |
50.4% |
Transport
2.6%
|
|
Transport |
|
|
|
Industry 56.4% |
4.8% |
|
Industry 44.8% |
||
|
|
|
|
|
|
672 Mtoe |
|
|
|
1 137 Mtoe |
|
*Other sectors comprises agriculture, commercial & public service, residential
and non-specified.
34

B Y S E C T O R
Electricity
Evolution from 1971 to 2001 of Total Final Consumption by Sector (Mtoe)
1200 |
|
|
|
|
|
|
|
|
|
|
|
|
|
|
|
1000 |
|
|
|
|
|
|
|
|
|
|
|
|
|
|
|
800 |
|
|
|
|
|
|
|
|
|
|
|
|
|
|
|
600 |
|
|
|
|
|
|
|
|
|
|
|
|
|
|
|
400 |
|
|
|
|
|
|
|
|
|
|
|
|
|
|
|
200 |
|
|
|
|
|
|
|
|
|
|
|
|
|
|
|
0 |
|
|
|
|
|
|
|
|
|
|
|
|
|
|
|
1971 |
1973 |
1975 |
1977 |
1979 |
1981 |
1983 |
1985 |
1987 |
1989 |
1991 |
1993 |
1995 |
1997 |
1999 |
2001 |
|
Industry |
|
Transport |
|
Other sectors* |
|
|
|
1973 and 2001 Shares of
World Electricity Consumption
1973 |
2001 |
Other sectors* |
Other sectors* |
46.3% |
56.5% |
Transport |
|
|
2.4% |
Transport |
Industry 41.7% |
Industry 51.3% |
1.8% |
|
439 Mtoe |
|
1 092 Mtoe |
*Other sectors comprises agriculture, commercial & public service, residential and non-specified.
35
3 |

E |
|
|
|
|
|
|
|
|
|
|
|
|
|
|
|
|
|
|
|
|
|
N |
|
|
|
|
|
|
SIMPLIFIED ENERGY |
||||||||||||||
E |
|
|
|
|
|
|
|||||||||||||||
R |
|
|
|
|
|
|
|||||||||||||||
G |
|
|
|
|
|
|
|
|
|
|
|
|
|
|
|
|
|
|
|
|
|
Y |
|
|
|
|
|
|
The World |
|
|
|
|
|
|
|
|
||||||
B |
|
|
|
|
|
|
|
|
1973 |
|
|
|
|
|
|
|
|
|
|
||
A |
|
|
|
|
|
|
|
|
|
|
|
|
|
|
|
|
|
(Mtoe) |
|||
|
|
|
|
|
|
|
|
|
|
|
|
|
|
|
|
|
|
|
|
||
L |
|
|
|
|
|
|
|
|
|
|
|
|
|
|
|
|
|
|
|
|
|
|
|
|
|
|
|
|
|
|
|
|
|
|
|
|
|
|
|
|
|
|
|
|
|
|
|
|
|
|
|
|
|
|
|
|
|
|
|
|
|
|
|
|
|
|
|
SUPPLY AND |
|
Coal |
|
Crude |
|
Petroleum |
|
|
|
Nuclear |
|
Hydro |
|
Combustible |
|
Other** |
|
|
|
A |
|
|
|
|
Gas |
|
|
|
|
|
|
Total |
|||||||||
N |
|
CONSUMPTION |
|
|
|
Oil |
|
Products |
|
|
|
|
|
|
|
Renewables |
|
|
|
|
|
|
|
|
|
|
|
|
|
|
|
|
|
|
|
|
& Waste* |
|
|
|
|
|
|
C |
|
|
|
|
|
|
|
|
|
|
|
|
|
|
|
|
|
|
|
|
|
|
|
|
|
|
|
|
|
|
|
|
|
|
|
|
|
|
|
|
|
|
|
E |
|
Indigenous Prod. |
|
1477.41 |
|
2929.03 |
|
– |
|
993.94 |
|
53.05 |
|
110.23 |
|
669.70 |
|
6.13 |
|
6239.49 |
|
|
|
Imports |
|
140.01 |
|
1583.20 |
|
|
|
73.41 |
|
– |
|
– |
|
0.11 |
|
8.15 |
|
2214.82 |
|
S |
|
|
|
409.94 |
|
|
|
|
|
|
|||||||||||
|
|
Exports |
|
–130.35 |
|
–1611.07 |
|
–440.28 |
|
–72.80 |
|
– |
|
– |
|
–0.19 |
|
|
–8.27 |
|
–2262.96 |
|
|
Stock Changes |
|
13.30 |
|
–21.83 |
|
–16.33 |
|
|
|
– |
|
– |
|
–0.23 |
|
|
|
|
|
|
|
|
|
|
–15.00 |
|
|
|
|
|
– |
|
–40.08 |
||||||||
|
|
|
|
|
|
|
|
|
|
|
|
|
|
|
|
|
|
|
|
|
|
|
|
TPES |
|
1500.37 |
|
|
|
|
|
|
|
|
|
|
|
|
|
|
|
|
|
|
|
|
|
|
|
|
979.55 |
|
53.05 |
|
110.23 |
|
|
|
6.00 |
|
6151.27 |
||||
|
|
|
2879.34 |
|
–46.66 |
|
|
|
|
|
669.39 |
|
|||||||||
|
|
|
|
|
|
|
|
|
|
|
|
|
|
|
|
|
|
|
|
|
|
|
|
Intl. Marine Bunkers |
|
|
|
|
|
|
|
|
|
– |
|
– |
|
– |
|
|
|
|
|
|
|
– |
|
– |
|
–117.62 |
|
– |
|
|
|
|
|
|
|
–117.62 |
|||||
|
|
|
|
|
|
|
|
|
|
|
|
– |
|
||||||||
|
|
Transfers |
|
– |
|
–42.20 |
|
|
|
– |
|
– |
|
– |
|
|
|
|
– |
|
|
|
|
|
|
47.91 |
|
|
|
|
– |
|
|
|
5.72 |
||||||||
|
|
Statistical Diff. |
|
|
|
13.30 |
|
|
|
|
|
– |
|
– |
|
|
|
|
|
|
|
|
|
–1.13 |
|
|
–8.78 |
|
4.75 |
|
|
|
–62.57 |
|
|
–0.16 |
|
–54.59 |
|||||
|
|
Electricity Plants |
|
|
|
–22.65 |
|
–316.85 |
|
–159.43 |
|
–52.95 |
|
|
|
–2.53 |
|
502.76 |
|
–719.61 |
|
|
|
–557.73 |
|
||||||||||||||||||
|
|
|
|
|
|
|
–110.23 |
|
|
|
|||||||||||
|
|
CHP Plants |
|
–87.77 |
|
|
|
|
|
–50.85 |
|
–0.10 |
|
|
|
|
|
|
|
–66.98 |
|
|
|
|
– |
|
–28.39 |
|
|
|
– |
|
–0.63 |
|
100.76 |
|
|||||||
|
|
Heat Plants |
|
|
|
– |
|
|
|
–0.69 |
|
– |
|
|
|
–0.24 |
|
6.85 |
|
–3.46 |
|
|
|
–8.46 |
|
|
–0.91 |
|
|
|
– |
|
|
||||||||||
|
|
Gas Works |
|
–8.96 |
|
|
|
|
|
13.52 |
|
– |
|
– |
|
|
|
|
– |
|
–5.33 |
|
|
|
–0.60 |
|
–9.29 |
|
|
|
|
– |
|
|
|
||||||||
|
|
Pet. Refineries |
|
|
|
–2802.15 |
|
2772.49 |
|
– |
|
– |
|
– |
|
|
|
|
|
|
–29.67 |
|
|
– |
|
|
|
|
|
|
– |
|
|
– |
|
||||||||
|
|
|
|
|
|
|
|
|
|
|
|
|
|
|
|
|
|
|
|
|
|
|
|
Coal Transf. |
|
–169.72 |
|
1.48 |
|
–3.38 |
|
–0.19 |
|
– |
|
– |
|
–0.08 |
|
|
– |
|
–171.89 |
|
|
Liquefaction Plants |
|
–1.60 |
|
0.21 |
|
– |
|
–0.08 |
|
– |
|
|
|
– |
|
|
|
|
–1.47 |
|
|
|
|
|
|
|
|
|
– |
|
|
|
– |
|
|||||||
|
|
Other Transf. |
|
– |
|
|
|
–5.27 |
|
–0.03 |
|
– |
|
|
|
–7.61 |
|
|
– |
|
–9.24 |
|
|
|
3.67 |
|
|
|
|
– |
|
|
|
|
|||||||||
|
|
Own Use |
|
|
|
–2.62 |
|
|
|
|
|
|
|
|
|
|
|
|
|
|
|
|
|
|
|
|
|
|
|
–107.57 |
|
– |
|
– |
|
|
|
|
–57.73 |
|
–363.45 |
||
|
|
–34.16 |
|
|
–161.30 |
|
|
|
|
|
–0.07 |
|
|
|
|
|
|||||
|
|
|
|
|
|
|
|
|
|
|
|
|
|
|
|
|
|
|
|
|
|
|
|
Distribution Losses |
|
–7.41 |
|
–7.07 |
|
–0.27 |
|
–7.49 |
|
– |
|
– |
|
– |
|
|
–43.04 |
|
–65.29 |
|
|
|
|
|
|
|
|
|
|
|
|
|
|
|
|
|
|
|
|
|
|
|
|
|
|
|
|
|
|
|
|
|
|
|
|
|
|
|
|
|
|
|
|
|
|
TFC |
|
623.43 |
|
20.70 |
|
2121.66 |
|
671.50 |
|
– |
|
– |
|
595.66 |
|
515.44 |
|
4548.39 |
|
|
|
|
|
|
|
|
|
|
|
|
|
|
|
|
|
|
|
|
|
|
|
|
|
Industry Sector |
|
|
|
|
|
544.76 |
|
|
|
– |
|
|
|
– |
|
277.12 |
|
|
|
|
|
274.30 |
|
16.38 |
|
|
378.35 |
|
|
– |
|
|
|
1490.90 |
|||||||
|
|
Transport Sector |
|
26.40 |
|
– |
|
|
|
|
|
|
|
– |
|
|
|
10.47 |
|
|
|
|
|
|
|
903.54 |
|
17.70 |
|
– |
|
|
– |
|
|
958.10 |
|||||||
|
|
Other Sectors |
|
|
|
|
|
541.53 |
|
|
|
– |
|
– |
|
– |
|
227.85 |
|
1362.33 |
|
|
|
317.49 |
|
– |
|
|
275.45 |
|
|
|
|
||||||||||
|
|
|
|
|
|
|
|
|
|
|
|
|
|
|
|
|
|
|
|
|
|
|
|
Non–Energy Use |
|
5.24 |
|
4.32 |
|
131.84 |
|
– |
|
– |
|
– |
|
– |
|
|
– |
|
141.40 |
|
|
|
|
|
|
|
|
|
|
|
|
|
|
|
|
|
|
|
|
|
|
|
|
|
|
|
|
|
|
|
|
|
|
|
|
|
|
|
|
|
|
|
|
*Combustible Renewables & Waste final consumption has been estimated based on TPES. 36 **Other includes geothermal, solar, electricity and heat, wind, etc.

BALANCE TABLE
The World
2001
|
|
|
|
|
|
|
|
|
(Mtoe) |
SUPPLY AND |
Coal |
Crude |
Petroleum |
Gas |
Nuclear |
Hydro |
Combustible |
Other* |
Total |
CONSUMPTION |
|
Oil |
Products |
|
|
|
Renewables |
|
|
|
|
|
|
|
|
|
& Waste |
|
|
Indigenous Prod. |
2360.82 |
3651.33 |
– |
2139.12 |
691.90 |
221.50 |
1093.62 |
50.86 |
10209.14 |
Imports |
435.81 |
2089.71 |
715.22 |
549.84 |
– |
– |
0.76 |
42.58 |
3833.91 |
Exports |
–445.34 |
–1999.25 |
–793.98 |
–547.69 |
– |
– |
–1.12 |
–41.92 |
–3829.30 |
Stock Changes |
–9.65 |
–9.40 |
–10.67 |
–19.25 |
– |
– |
0.25 |
– |
–48.72 |
TPES |
2341.64 |
3732.38 |
–89.43 |
2122.02 |
691.90 |
221.50 |
1093.50 |
51.53 |
10165.03 |
Intl. Marine Bunkers |
– |
– |
–135.93 |
– |
– |
– |
– |
– |
–135.93 |
Transfers |
– |
–80.68 |
91.68 |
– |
– |
– |
–0.02 |
– |
10.98 |
Statistical Diff. |
17.25 |
–4.64 |
6.77 |
–2.89 |
– |
– |
0.13 |
0.54 |
17.16 |
Electricity Plants |
–1367.50 |
–22.10 |
–216.47 |
–418.09 |
–680.30 |
–221.50 |
–25.30 |
1137.51 |
–1813.75 |
CHP Plants |
–179.66 |
–0.74 |
–29.29 |
–240.17 |
–11.59 |
– |
–25.33 |
283.63 |
–203.14 |
Heat Plants |
–64.54 |
–1.15 |
–18.09 |
–85.97 |
– |
– |
–8.14 |
152.38 |
–25.52 |
Gas Works |
–11.11 |
– |
–2.03 |
5.57 |
– |
– |
– |
– |
–7.57 |
Pet. Refineries |
– |
–3638.92 |
3605.51 |
– |
– |
– |
–1.39 |
– |
–34.81 |
Coal Transf. |
–157.81 |
0.04 |
–2.54 |
–0.19 |
– |
– |
– |
– |
–160.50 |
Liquefaction Plants |
–15.64 |
11.85 |
13.61 |
–28.58 |
– |
– |
– |
– |
–18.76 |
Other Transf. |
– |
27.63 |
–27.19 |
–0.56 |
– |
– |
–39.76 |
– |
–39.88 |
Own Use |
–46.11 |
–9.07 |
–198.64 |
–194.94 |
– |
– |
–0.23 |
–148.68 |
–597.67 |
Distribution Losses |
–1.67 |
–4.05 |
–0.39 |
–19.13 |
– |
– |
–0.01 |
–135.78 |
–161.03 |
TFC |
514.85 |
10.55 |
2997.57 |
1137.07 |
– |
– |
993.45 |
1341.12 |
6994.61 |
Industry Sector |
386.37 |
9.59 |
579.96 |
509.87 |
– |
– |
160.33 |
554.75 |
2200.87 |
Transport Sector |
5.44 |
0.01 |
1715.71 |
54.16 |
– |
– |
7.78 |
19.34 |
1802.45 |
Other Sectors |
112.43 |
0.96 |
514.04 |
573.05 |
– |
– |
825.34 |
767.02 |
2792.83 |
Non–Energy Use |
10.61 |
– |
187.85 |
– |
– |
– |
– |
– |
198.46 |
* Other includes geothermal, solar, electricity and heat, wind, etc.
4 |
37

E |
|
|
|
|
|
|
|
|
|
|
|
|
|
|
|
|
|
|
N |
|
|
|
|
|
SIMPLIFIED ENERGY |
||||||||||||
E |
|
|
|
|
|
|||||||||||||
R |
|
|
|
|
|
|||||||||||||
G |
|
|
|
|
|
|
|
|
|
|
|
|
|
|
|
|
|
|
Y |
|
|
|
|
|
The OECD |
|
|
|
|
|
|
|
|||||
B |
|
|
|
|
|
|
1973 |
|
|
|
|
|
|
|
|
|
||
A |
|
|
|
|
|
|
|
|
|
|
|
|
|
(Mtoe) |
||||
|
|
|
|
|
|
|
|
|
|
|
|
|
|
|
|
|||
L |
|
|
|
|
|
|
|
|
|
|
|
|
|
|
|
|
||
|
|
|
|
|
|
|
|
|
|
|
|
|
|
|
|
|
|
|
|
|
|
|
|
|
|
|
|
|
|
|
|
|
|
|
|
|
|
|
|
SUPPLY AND |
Coal |
Crude |
Petroleum |
|
|
|
Nuclear |
|
Hydro |
|
Combustible |
|
Other* |
|
|
|
A |
|
Gas |
|
|
|
|
|
|
Total |
|||||||||
N |
|
CONSUMPTION |
|
Oil |
Products |
|
|
|
|
|
|
|
Renewables |
|
|
|
|
|
|
|
|
|
|
|
|
|
|
|
|
|
|
& Waste |
|
|
|
|
|
|
|
|
|
|
|
|
|
|
|
|
|
|
|
|
|
|
||
C |
|
|
|
|
|
|
|
|
|
|
|
|
|
|
|
|
|
|
|
|
Indigenous Prod. |
818.28 |
701.75 |
– |
|
705.65 |
|
|
|
78.46 |
|
79.86 |
6.13 |
|
2439.34 |
||
E |
|
|
49.22 |
|
|
|
||||||||||||
|
Imports |
|
1286.57 |
|
|
62.56 |
|
– |
|
– |
|
0.03 |
7.55 |
|
1815.85 |
|||
S |
|
121.72 |
337.43 |
|
|
|
|
|
||||||||||
|
|
|
|
|
|
|
|
|
|
|
|
|
|
|
|
|
|
|
|
|
Exports |
–111.07 |
–63.46 |
–173.84 |
|
–50.39 |
|
– |
|
– |
|
–0.01 |
|
–7.00 |
|
–405.78 |
|
|
|
Intl. Marine Bunkers |
|
– |
–71.62 |
|
– |
|
– |
|
|
|
– |
|
– |
|
–71.62 |
|
|
– |
|
|
|
– |
|
|
|
||||||||||
|
|
|
|
|
|
|
|
|
|
|
|
|
|
|
|
|
|
|
|
|
Stock Changes |
14.41 |
–11.04 |
–11.51 |
|
–11.98 |
|
– |
|
– |
|
0.06 |
|
– |
|
–20.07 |
|
|
|
|
|
|
|
|
|
|
|
|
|
|
|
|
|
|
|
|
|
|
|
|
|
|
|
|
|
|
|
|
|
|
|
|
|
|
|
|
|
TPES |
843.34 |
1913.81 |
|
|
705.83 |
|
49.22 |
|
78.46 |
|
|
|
|
|
3757.73 |
|
|
80.47 |
|
|
|
|
79.93 |
6.67 |
|
||||||||||
|
|
|
|
|
|
|
|
|
|
|
|
|
|
|
|
|
|
|
|
|
Transfers |
– |
–37.99 |
42.12 |
|
– |
|
– |
|
– |
|
– |
|
– |
|
4.13 |
|
|
|
Statistical Diff. |
|
13.22 |
|
|
|
|
– |
|
– |
|
|
|
|
|
|
|
|
3.89 |
2.28 |
|
–5.62 |
|
|
|
–0.00 |
|
– |
|
13.76 |
||||||
|
|
|
|
|
|
|
|
|
|
|
|
|
|
|
|
|
|
|
|
|
Electricity Plants |
–387.36 |
–20.67 |
–223.37 |
|
|
|
|
|
|
|
–1.35 |
363.19 |
|
|
||
|
|
–108.33 |
|
–49.12 |
|
–78.46 |
|
|
–505.46 |
|||||||||
|
|
|
|
|
|
|
|
|
|
|
|
|
|
|
|
|
|
|
|
|
CHP Plants |
|
– |
–7.93 |
|
|
|
–0.10 |
|
– |
|
–0.50 |
30.94 |
|
–42.75 |
||
|
–53.52 |
|
–11.65 |
|
|
|
|
|
||||||||||
|
|
Heat Plants |
–8.46 |
– |
|
|
–0.69 |
|
– |
|
– |
|
|
|
|
|
–3.46 |
|
|
–0.91 |
|
|
|
|
–0.24 |
6.85 |
|
||||||||||
|
|
|
|
|
|
|
|
|
|
|
|
|
|
|
|
|
|
|
|
|
Gas Works |
–7.49 |
–0.60 |
–8.81 |
|
13.02 |
|
– |
|
– |
|
– |
|
– |
|
–3.88 |
|
|
|
Pet. Refineries |
– |
–1871.71 |
1864.06 |
|
– |
|
– |
|
– |
|
– |
|
– |
|
–7.66 |
|
|
|
Coal Transf. |
|
1.48 |
|
|
–0.19 |
|
– |
|
|
|
|
|
– |
|
–78.52 |
|
|
–76.41 |
–3.38 |
|
|
|
– |
|
–0.02 |
|
|
||||||||
|
|
Liquefaction Plants |
–0.87 |
– |
|
|
– |
|
– |
|
|
|
|
|
– |
|
–0.87 |
|
|
– |
|
|
|
– |
|
– |
|
|
|||||||||
|
|
Other Transf. |
|
3.67 |
–5.27 |
|
–0.03 |
|
|
|
– |
|
|
|
|
|
–1.63 |
|
|
|
|
|
|
|
|
– |
|||||||||||
|
– |
|
|
– |
|
|
|
– |
|
|||||||||
|
|
|
|
|
|
|
|
|
|
|
|
|
|
|
|
|
|
|
|
|
Own Use |
–23.64 |
–1.00 |
–127.38 |
|
–72.86 |
|
– |
|
– |
|
–0.07 |
|
–33.37 |
|
–258.31 |
|
|
|
Distribution Losses |
|
– |
–0.24 |
|
–3.95 |
|
|
|
|
|
– |
|
|
|
–36.83 |
|
|
–2.32 |
|
|
– |
|
– |
|
|
–30.33 |
|
||||||||
|
|
|
|
|
|
|
|
|
|
|
|
|
|
|
|
|
|
|
|
|
TFC |
287.16 |
0.21 |
|
|
515.54 |
|
– |
|
– |
|
|
|
|
|
2836.24 |
|
|
1611.62 |
|
|
|
|
77.76 |
343.95 |
|
||||||||||
|
|
|
|
|
|
|
|
|
|
|
|
|
|
|
|
|
|
|
|
|
Industry Sector |
|
0.21 |
426.97 |
|
259.26 |
|
– |
|
– |
|
40.92 |
168.80 |
|
1076.07 |
||
|
179.92 |
|
|
|
|
|
||||||||||||
|
|
|
|
|
|
|
|
|
|
|
|
|
|
|
|
|
|
|
|
|
Transport Sector |
7.23 |
– |
692.29 |
|
17.00 |
|
– |
|
– |
|
0.00 |
5.29 |
|
721.80 |
||
|
|
|
|
|
|
|
|
|
|
|
|
|
|
|
|
|
|
|
|
|
Other Sectors |
96.91 |
– |
396.27 |
|
239.28 |
|
– |
|
– |
|
36.84 |
169.87 |
|
939.17 |
||
|
|
Non–Energy Use |
3.10 |
– |
96.11 |
|
|
|
– |
|
– |
|
|
|
|
|
99.20 |
|
|
|
– |
|
|
|
– |
|
– |
|
|||||||||
|
|
|
|
|
|
|
|
|
|
|
|
|
|
|
|
|
|
|
|
|
|
|
|
|
|
|
|
|
|
|
|
|
|
|
|
|
|
*Other includes geothermal, solar, electricity and heat, wind, etc.
38