

BALANCE TABLE |
|
|
|
|
|
|
||||
|
|
|
The OECD |
|
|
|
|
|
||
|
|
|
2004 |
|
|
|
|
(Mtoe) |
|
|
|
|
|
|
|
|
|
|
|
|
|
SUPPLY AND |
Coal |
Crude |
Petroleum |
Gas |
Nuclear |
Hydro |
Combustible |
Other* |
Total |
|
CONSUMPTION |
|
Oil |
Products |
|
|
|
Renewables |
|
|
|
|
|
|
|
|
|
|
& Waste |
|
|
|
Indigenous Prod. |
981.21 |
1014.82 |
– |
925.81 |
604.33 |
108.99 |
186.20 |
38.18 |
3859.54 |
|
Imports |
363.57 |
1660.74 |
489.98 |
515.07 |
– |
– |
2.02 |
31.25 |
3062.63 |
|
Exports |
–220.58 |
–445.39 |
–382.41 |
–241.65 |
– |
– |
–0.59 |
–29.78 |
–1320.40 |
4 |
Intl. Marine Bunkers |
– |
– |
–88.98 |
– |
– |
– |
– |
– |
–88.98 |
|
Stock Changes |
4.37 |
–6.86 |
–0.36 |
–2.00 |
– |
– |
–0.04 |
– |
–4.88 |
|
TPES |
1128.56 |
2223.31 |
18.23 |
1197.23 |
604.33 |
108.99 |
187.60 |
39.66 |
5507.90 |
|
Transfers |
– |
–42.13 |
49.37 |
– |
– |
– |
– |
– |
7.24 |
|
Statistical Diff. |
–9.65 |
–12.31 |
0.37 |
5.11 |
– |
– |
–0.02 |
0.28 |
–16.23 |
|
Electricity Plants |
–808.36 |
–6.30 |
–89.71 |
–244.36 |
–596.69 |
–108.99 |
–26.14 |
746.62 |
–1133.92 |
|
CHP Plants |
–92.72 |
–0.00 |
–17.78 |
–120.42 |
–7.64 |
– |
–31.57 |
145.66 |
–124.47 |
|
Heat Plants |
–5.37 |
– |
–1.64 |
–5.94 |
– |
– |
–3.07 |
12.37 |
–3.64 |
|
Gas Works |
–2.28 |
– |
–2.14 |
3.47 |
– |
– |
– |
– |
–0.95 |
|
Pet. Refineries |
– |
–2184.26 |
2191.79 |
–0.68 |
– |
– |
– |
– |
6.84 |
|
Coal Transf. |
–62.54 |
0.04 |
–2.60 |
–0.26 |
– |
– |
– |
– |
–65.36 |
|
Liquefaction Plants |
–0.04 |
0.04 |
– |
– |
– |
– |
– |
– |
– |
|
Other Transf. |
0.00 |
23.10 |
–23.72 |
–0.00 |
– |
– |
–0.11 |
– |
–0.74 |
|
Own Use |
–13.30 |
–0.02 |
–122.19 |
–84.30 |
– |
– |
–0.10 |
–64.94 |
–284.85 |
|
Distribution Losses |
–0.83 |
– |
– |
–2.98 |
– |
– |
–0.01 |
–60.46 |
–64.29 |
|
TFC |
133.47 |
1.46 |
1999.97 |
746.87 |
– |
– |
126.57 |
819.18 |
3827.52 |
|
Industry Sector |
114.30 |
0.04 |
140.43 |
273.69 |
– |
– |
63.58 |
286.86 |
878.91 |
|
Transport Sector |
0.07 |
– |
1245.33 |
20.23 |
– |
– |
9.00 |
9.72 |
1284.36 |
|
Other Sectors |
17.26 |
– |
263.84 |
416.50 |
– |
– |
53.99 |
522.60 |
1274.19 |
|
Non–Energy Use** |
1.84 |
1.41 |
350.36 |
36.45 |
– |
– |
– |
– |
390.07 |
|
*Includes geothermal, solar, electricity and heat, wind, etc. ** Includes petrochemical feedstocks.
39
P |
|
|
R |
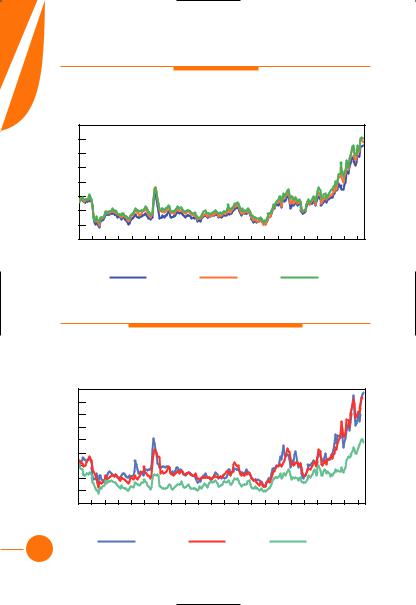
Crude Oil |
|
I |
||
C |
|
|
E |
Key Crude Oil Spot Prices |
|
S |
||
in US Dollars/barrel |
||
|
80 |
|
|
|
|
|
|
|
|
|
|
70 |
|
|
|
|
|
|
|
|
|
|
60 |
|
|
|
|
|
|
|
|
|
|
50 |
|
|
|
|
|
|
|
|
|
|
40 |
|
|
|
|
|
|
|
|
|
|
30 |
|
|
|
|
|
|
|
|
|
|
20 |
|
|
|
|
|
|
|
|
|
|
10 |
|
|
|
|
|
|
|
|
|
|
0 |
|
|
|
|
|
|
|
|
|
|
Jan-86 |
Jan-88 |
Jan-90 |
Jan-92 |
Jan-94 |
Jan-96 |
Jan-98 |
Jan-00 |
Jan-02 |
Jan-04 |
Jan-06 |
Monthly Averages
Dubai |
Brent |
WTI |
Petroleum Products
Rotterdam Oil Product Spot Prices
in US Dollars/barrel
90 |
|
|
|
|
|
|
|
|
|
|
80 |
|
|
|
|
|
|
|
|
|
|
70 |
|
|
|
|
|
|
|
|
|
|
60 |
|
|
|
|
|
|
|
|
|
|
50 |
|
|
|
|
|
|
|
|
|
|
40 |
|
|
|
|
|
|
|
|
|
|
30 |
|
|
|
|
|
|
|
|
|
|
20 |
|
|
|
|
|
|
|
|
|
|
10 |
|
|
|
|
|
|
|
|
|
|
0 |
Jan-88 |
Jan-90 |
Jan-92 |
Jan-94 |
Jan-96 |
Jan-98 |
Jan-00 |
Jan-02 |
Jan-04 |
Jan-06 |
Jan-86 |
Monthly Averages
Gasoline |
Gasoil |
HFO |
40
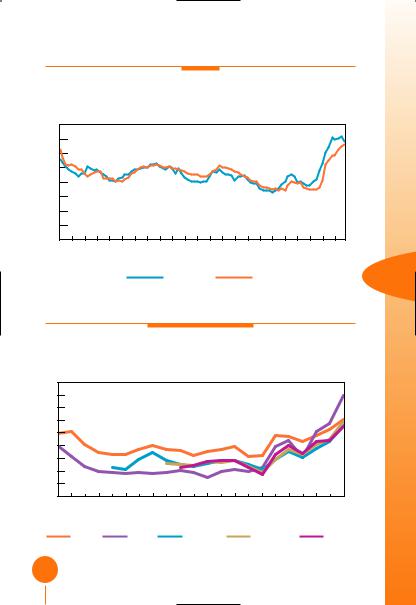
Coal
Steam Coal Import Costs
in US Dollars/tonne
80 |
70 |
60 |
50 |
40 |
30 |
20 |
10 |
0 |
4Q1983 4Q1985 4Q1987 4Q1989 4Q1991 4Q1993 4Q1995 4Q1997 4Q1999 4Q2001 4Q2003 4Q2005 |
Quarterly Averages
EU |
Japan |
5 |
Natural Gas
Natural Gas Import Prices
in US Dollars/MBtu
9 |
|
|
|
|
|
|
|
|
|
|
8 |
|
|
|
|
|
|
|
|
|
|
7 |
|
|
|
|
|
|
|
|
|
|
6 |
|
|
|
|
|
|
|
|
|
|
5 |
|
|
|
|
|
|
|
|
|
|
4 |
|
|
|
|
|
|
|
|
|
|
3 |
|
|
|
|
|
|
|
|
|
|
2 |
|
|
|
|
|
|
|
|
|
|
1 |
|
|
|
|
|
|
|
|
|
|
0 |
|
|
|
|
|
|
|
|
|
|
1985 |
1987 |
1989 |
1991 |
1993 |
1995 |
1997 |
1999 |
2001 |
2003 |
2005 |
Yearly Averages
Japan* |
USA** |
Belgium** |
Germany** |
Spain** |
*LNG **Pipeline
41
P
R
I RETAIL PRICES(a)
C
E
S
|
Heavy Fuel Oil |
Light Fuel Oil |
Automotive |
Unleaded |
||||
|
for Industry(b) |
for Households |
Diesel Oil(c) |
Premium(d) |
||||
|
(tonne) |
|
(1000 litres) |
(litre) |
|
(litre) |
|
|
|
|
|
|
|
|
|||
Australia |
.. L |
.. L |
.. L |
0.885 |
L |
|||
Austria |
421.28 |
L |
794.80 |
L |
0.825 |
L |
1.276 |
L |
Belgium |
356.39 |
L |
675.62 |
L |
1.067 |
L |
1.590 |
L |
Canada |
337.52 |
L |
709.99 |
L |
0.810 |
L |
0.803 |
L |
Chinese Taipei |
297.49 |
L |
x L |
0.628 |
L |
0.751 |
L |
|
Czech Republic |
314.98 |
L |
731.64 |
L |
0.988 |
L |
1.186 |
L |
Denmark |
436.49 |
L |
1 218.25 |
L |
1.044 |
L |
1.488 |
L |
Finland |
445.77 |
L |
755.40 |
L |
0.997 |
L |
1.500 |
L |
France |
381.48 |
L |
774.22 |
L |
1.071 |
L |
1.458 |
L |
Germany |
367.39 |
L |
682.43 |
L |
1.144 |
L |
1.519 |
L |
Greece |
339.72 |
L |
1044.47 |
L |
0.916 |
L |
1.086 |
L |
Hungary |
387.84 |
L |
x L |
1.020 |
L |
1.241 |
L |
|
India |
.. L |
.. L |
.. L |
.. L |
||||
Ireland |
498.16 |
L |
837.97 |
L |
1.073 |
L |
1.301 |
L |
Italy |
447.66 |
L |
1 333.68 |
L |
1.158 |
L |
1.505 |
L |
Japan |
537.45 |
L |
666.60 |
L |
0.768 |
L |
1.109 |
L |
Korea |
547.12 |
L |
956.91 |
L |
.. L |
1.526 |
L |
|
Luxembourg |
208.04 |
L |
629.84 |
L |
0.940 |
L |
1.271 |
L |
Mexico |
226.69 |
L |
.. L |
0.438 |
L |
0.613 |
L |
|
Netherlands |
422.92 |
L |
1 041.64 |
L |
1.099 |
L |
1.667 |
L |
New Zealand |
396.21 |
L |
.. L |
0.625 |
L |
0.972 |
L |
|
Norway |
.. L |
1 256.93 |
L |
1.210 |
L |
1.669 |
L |
|
Poland |
322.83 |
L |
781.54 |
L |
0.945 |
L |
1.169 |
L |
Portugal |
517.68 |
L |
790.61 |
L |
1.114 |
L |
1.473 |
L |
South Africa |
.. L |
.. L |
.. L |
.. L |
||||
Slovak Republic |
246.17 |
L |
.. L |
1.043 L |
1.208 L |
|||
Spain |
439.09 |
L |
720.00 |
L |
0.964 L |
1.188 L |
||
Sweden |
c L |
1 257.70 |
L |
1.141 L |
1.439 L |
|||
Switzerland |
368.06 L |
597.94 |
L |
1.141 L |
1.227 L |
|||
Turkey |
639.35 L |
1 473.86 |
L |
1.554 L |
1.963 L |
|||
United Kingdom |
391.33 L |
593.08 |
L |
1.394 L |
1.557 L |
|||
United States |
341.38 L |
620.24 |
L |
0.661 L |
0.622 L |
|||
|
(a) Prices are for 1st quarter 2006, or latest available L. (b) High sulphur fuel oil for Canada, India, Ireland, Mexico, |
|
New Zealand, South Africa, Turkey and the United States; low sulphur fuel oil for all other countries. (c) For commercial purposes. |
42 |
(d) Unleaded premium gasoline (95 RON); unleaded regular for Australia, Canada, Japan, Korea, Mexico, New Zealand |
|
|

IN SELECTED COUNTRIES in US Dollars/Unit
|
|
|
|
|
|
|
|
|
|
|
|
|
|
|
|
|
|
|
|
|
|
|
|
|
|
|
|
|
|
|
|
|
|
|
|
|
|
|
|
|
|
|
|
|
Nat Gas for |
Nat Gas for |
Steam Coal |
Electricity for |
Electricity for |
|
|
|
|
||||||
|
|
|
|
|||||||||||
Industry |
Households |
for Industry(f) |
Industry(g) |
Households(g) |
|
|
|
|
||||||
(107 kcal GCV(e)) |
(107 kcal GCV(e)) |
(tonne) |
|
(kWh) |
|
(kWh) |
|
|
|
|
|
|||
|
|
|
|
|
|
|
||||||||
.. L |
.. L |
.. L |
0.0609 |
L |
0.0985 |
L |
Australia |
|
|
|
||||
|
|
|
||||||||||||
.. L |
744.54 |
L |
162.34 |
L |
0.1056 |
L |
0.1613 |
L |
Austria |
|
|
|
||
|
|
|
||||||||||||
c L |
.. L |
.. L |
.. L |
.. L |
Belgium |
|
|
|
||||||
221.71 |
L |
395.18 |
L |
.. L |
.. L |
.. L |
Canada |
|
|
|
||||
|
|
|
||||||||||||
380.70 |
L |
354.97 |
L |
.. L |
0.0512 |
L |
0.0690 |
L |
Chinese Taipei |
|
|
|
||
|
|
|
|
|
|
|
|
|
|
|
|
|
||
377.03 |
L |
519.44 |
L |
c L |
0.0892 |
L |
0.1161 |
L |
Czech Republic |
|
|
|
||
c L |
1 270.76 L |
.. L |
0.0759 |
L |
0.2935 |
L |
Denmark |
|
|
|
||||
|
|
|
|
|
|
|
|
|
|
|
|
|
|
|
235.59 |
L |
334.95 |
L |
126.07 |
L |
0.0701 |
L |
0.1200 |
L |
Finland |
|
|
|
|
382.29 |
L |
653.44 |
L |
123.43 |
L |
0.0483 |
L |
0.1365 |
L |
France |
|
|
|
|
|
|
|
||||||||||||
.. L |
.. L |
.. L |
0.0769 |
L |
0.1975 |
L |
Germany |
|
|
|
||||
305.66 |
L |
503.14 |
L |
.. L |
0.0673 |
L |
0.1138 |
L |
Greece |
|
|
|
||
|
|
|
||||||||||||
405.42 |
L |
373.74 |
L |
.. L |
0.1068 |
L |
0.1266 |
L |
Hungary |
|
|
|
||
5 |
||||||||||||||
.. L |
.. L |
34.89 |
L |
.. L |
.. L |
India |
||||||||
|
|
|
||||||||||||
566.23 |
L |
606.43 |
L |
.. L |
0.1071 |
L |
0.1842 |
L |
Ireland |
|
|
|
||
|
|
|
||||||||||||
c L |
c L |
69.40 |
L |
0.1684 |
L |
0.1995 |
L |
Italy |
|
|
|
|||
392.53 |
L |
1271.52 |
L |
65.66 |
L |
0.1272 |
L |
0.1963 |
L |
Japan |
|
|
|
|
|
|
|
||||||||||||
467.42 |
L |
609.75 |
L |
58.72 |
L |
0.0638 |
L |
0.0894 |
L |
Korea |
|
|
|
|
|
|
|
|
|
|
|
|
|
|
|
||||
.. L |
477.53 |
L |
.. L |
.. L |
0.1866 |
L |
Luxembourg |
|
|
|
||||
370.63 |
L |
659.40 |
L |
x L |
0.1009 |
L |
0.1010 |
L |
Mexico |
|
|
|
||
|
|
|
||||||||||||
227.77 |
L |
858.15 |
L |
.. L |
c L |
0.2443 |
L |
Netherlands |
|
|
|
|||
166.03 |
L |
743.97 |
L |
c L |
0.0527 |
L |
0.1337 |
L |
New Zealand |
|
|
|
||
|
|
|
||||||||||||
x L |
x L |
.. L |
0.0517 |
L |
0.0856 |
L |
Norway |
|
|
|
||||
|
|
|
|
|
|
|
|
|
|
|
|
|
|
|
274.80 |
L |
449.72 |
L |
61.96 |
L |
0.0736 |
L |
0.1250 |
L |
Poland |
|
|
|
|
384.42 |
L |
1 009.22 |
L |
.. L |
0.1073 |
L |
0.1764 |
L |
Portugal |
|
|
|
||
|
|
|
||||||||||||
.. L |
x L |
.. L |
.. L |
.. L |
South Africa |
|
|
|
||||||
275.65 |
L |
431.22 |
L |
.. L |
0.0797 |
L |
0.1295 |
L |
Slovak Republic |
|
|
|
||
|
|
|
||||||||||||
344.60 |
L |
726.64 |
L |
.. L |
0.0833 |
L |
0.1535 |
L |
Spain |
|
|
|
||
|
|
|
||||||||||||
.. L |
.. L |
.. L |
.. L |
.. L |
Sweden |
|
|
|
||||||
445.91 L |
714.20 |
L |
86.42 |
L |
0.0807 L |
0.1276 L |
Switzerland |
|
|
|
||||
|
|
|
||||||||||||
350.49 L |
410.22 |
L |
50.68 |
L |
0.1077 L |
0.1194 L |
Turkey |
|
|
|
||||
|
|
|
|
|
|
|
|
|
|
|
||||
396.84 L |
519.67 |
L |
85.19 |
L |
0.1003 L |
0.1580 L |
United Kingdom |
|
|
|
||||
375.54 L |
487.47 |
L |
52.66 |
L |
0.0549 L |
0.0961 L |
United States |
|
|
|
||||
|
|
|
||||||||||||
and the United States. (e) Gross calorific value. (f) Brown coal for Turkey. (g) Price excluding tax for the United States. |
|
|
|
|||||||||||
|
|
|
||||||||||||
L Latest data available. |
|
|
|
|
|
|
|
|
|
|
|
|||
.. not available |
x |
not applicable |
c |
confidential |
|
|
|
|
|
|
|
|
|
|
|
|
|
|
|
|
|
|
|
|
|
|
|
|
|
|
|
|
|
|
|
|
|
|
|
|
|
|
|
|
43
E |
|
|
|
|
|
|
|
|
|
|
|
|
M |
|
|
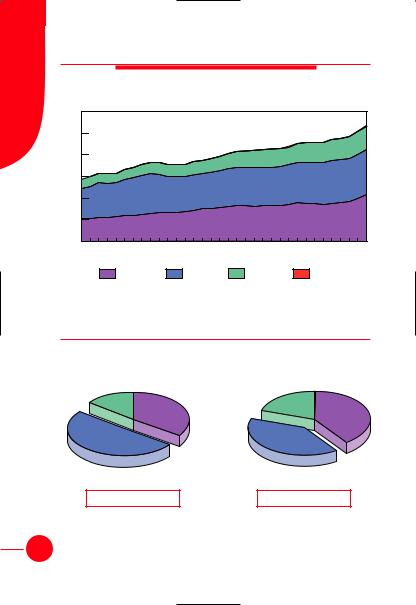
CO2 Emissions by Fuel |
|
|
|||||||
I |
|
|
|
|
||||||||
S |
|
|
|
|
|
|
|
|
|
|
|
|
S |
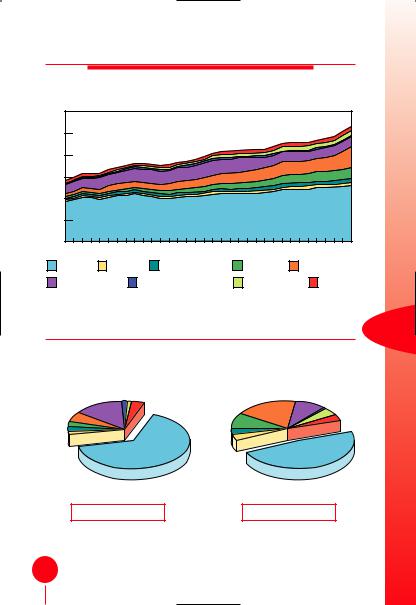
Evolution from 1971 to 2004 of World* CO2 Emissions** |
|
||||||||||
I |
|
|||||||||||
|
|
|
|
by Fuel (Mt of CO2) |
|
|
|
|
||||
O |
|
|
|
|
|
|
|
|
||||
30000 |
|
|
|
|
|
|
|
|
|
|
|
|
N |
|
|
|
|
|
|
|
|
|
|
|
|
|
|
|
|
|
|
|
|
|
|
|
|
|
S |
25000 |
|
|
|
|
|
|
|
|
|
|
|
|
20000 |
|
|
|
|
|
|
|
|
|
|
|
|
15000 |
|
|
|
|
|
|
|
|
|
|
|
|
10000 |
|
|
|
|
|
|
|
|
|
|
|
|
5000 |
|
|
|
|
|
|
|
|
|
|
|
|
0 |
|
|
|
|
|
|
|
|
|
|
|
|
1971 |
1974 |
1977 |
1980 |
1983 |
1986 |
1989 |
1992 |
1995 |
1998 |
2001 |
2004 |
Coal |
Oil |
Gas |
Other*** |
1973 and 2004 Fuel Shares of
CO2 Emissions**
|
1973 |
|
2004 |
|
Gas |
Coal |
Gas |
Other*** |
Coal |
0.3% |
||||
14.4% |
34.9% |
19.8% |
|
40.0% |
50.7% |
39.9% |
15 661 Mt of CO2 |
26 583 Mt of CO2 |
*World includes international aviation and international marine bunkers.
**Calculated using IEA’s Energy Balance Tables and the Revised 1996 IPCC Guidelines.
44 |
includes industrial waste |
waste. |
CO2 Emissions by Region
Evolution from 1971 to 2004 of World* CO2 Emissions** by Region (Mt of CO2)
30000 |
|
|
|
|
|
|
|
|
|
|
|
25000 |
|
|
|
|
|
|
|
|
|
|
|
20000 |
|
|
|
|
|
|
|
|
|
|
|
15000 |
|
|
|
|
|
|
|
|
|
|
|
10000 |
|
|
|
|
|
|
|
|
|
|
|
5000 |
|
|
|
|
|
|
|
|
|
|
|
0 |
1974 |
1977 |
1980 |
1983 |
1986 |
1989 |
1992 |
1995 |
1998 |
2001 |
2004 |
1971 |
OECD |
Africa |
Latin America |
Asia*** |
China |
Former USSR |
Non-OECD Europe |
Middle East |
Bunkers |
|
1973 and 2004 Regional Shares of
|
|
|
CO2 Emissions** |
|
6 |
||
|
1973 |
|
|
|
2004 |
|
|
|
Former |
Non- |
|
|
|
Former |
Non-OECD |
|
OECD |
Middle East |
|
China |
|||
China |
USSR |
Europe |
1.0% |
|
USSR |
Europe 1.0% |
|
14.4% |
1.7% |
Bunkers |
Asia*** |
17.9% |
8.7% |
Middle East |
|
5.7% |
|
|
9.4% |
|
|
4.5% |
|
|
|
|
3.7% |
|
|
||
|
|
|
Latin |
|
|
Bunkers |
|
|
|
|
|
|
|
||
|
|
|
|
America |
|
|
3.4% |
|
|
|
|
3.4% |
|
|
|
|
|
|
|
Africa |
|
|
|
1.9% |
|
|
|
3.1% |
|
|
|
|
|
OECD |
|
|
|
OECD |
|
|
|
|
|
|
|
||
|
|
|
65.9% |
|
|
|
48.6% |
15 661 Mt of CO2 |
|
26 583 Mt of CO2 |
|||||
World includes international aviation and international marine bunkers, which are shown as Bunkers. ** Calculated using IEA’s Energy Balance Tables and the Revised 1996
Guidelines. CO2 emissions are from fuel combustion only. *** Asia excludes China.
45
O U T L O O K
O U T L O O K F O R W O R L D T P E S
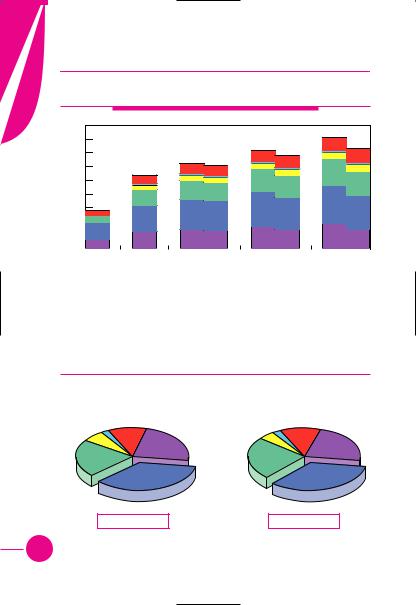
TPES* Outlook by Fuel
18000 |
|
|
|
|
|
|
|
(Mtoe) |
|
|
|
|
|
|
|
|
|
16000 |
|
|
|
|
|
|
|
|
14000 |
|
|
|
|
|
|
|
|
12000 |
|
|
|
|
|
|
|
|
10000 |
|
|
|
|
|
|
|
|
8000 |
|
|
|
|
|
|
|
|
6000 |
|
|
|
|
|
|
|
|
4000 |
|
|
|
|
|
|
|
|
2000 |
|
|
|
|
|
|
|
|
0 |
RS |
RS |
RS |
AS |
RS |
AS |
RS |
AS |
|
||||||||
|
1971 |
2003 |
|
2010 |
|
2020 |
|
2030 |
|
|
Coal |
|
Oil* |
|
|
Gas |
|
|
Nuclear |
|
Hydro |
|
|
Other** |
|
|
|
|
|
|||
|
|
|
|
|
|||
RS: Reference Scenario |
|
|
AS: Alternative Scenario |
||||
(based on current policies) |
|
(based on policies under consideration) |
|||||
Fuel Shares of TPES* in 2010 and 2030 for the Reference Scenario
|
2010 |
2030 |
||
Nuclear |
Hydro |
Other** |
Hydro |
Other** |
2.2% |
11.1% Coal |
Nuclear 2.3% |
11.8% Coal |
|
6.3% |
|
23.1% |
4.7% |
22.9% |
Gas |
|
Gas |
||
|
|
|
||
21.5% |
|
|
24.2% |
|
|
|
Oil* |
|
Oil* |
|
|
35.8% |
|
34.1% |
|
12 200 Mtoe |
16 500 Mtoe |
||
* Includes bunkers.
46 ** Other includes combustible renewables & waste, geothermal, solar, wind, tide, etc.

T O 2 0 3 0
TPES Outlook by Region
18000 |
|
|
|
|
|
|
(Mtoe) |
|
|
|
|
|
|
|
|
16000 |
|
|
|
|
|
|
|
14000 |
|
|
|
|
|
|
|
12000 |
|
|
|
|
|
|
|
10000 |
|
|
|
|
|
|
|
8000 |
|
|
|
|
|
|
|
6000 |
|
|
|
|
|
|
|
4000 |
|
|
|
|
|
|
|
2000 |
|
|
|
|
|
|
|
0 |
RS |
RS |
AS |
RS |
AS |
RS |
AS |
RS |
|||||||
1971 |
2003 |
|
2010 |
|
2020 |
|
2030 |
|
OECD |
|
Middle East |
|
Transition Economies* |
|
China |
|
Asia** |
|
|
|
|
|
|
|
|
Latin America |
|
Africa |
|
Bunkers |
|
|
|
|
|
||||
|
RS: Reference Scenario |
|
AS: Alternative Scenario |
|
|||
|
(based on current policies) |
|
(based on policies under consideration) |
||||
Regional Shares of TPES in 2010 and 2030 for the Reference Scenario
|
2010 |
|
|
|
2030 |
7 |
|
|
Asia** |
Latin |
|
|
|
Latin |
|
|
America |
Africa |
|
Asia** |
America |
Africa |
|
China |
12.4% |
4.5% |
5.4% |
|
14.9% |
5.5% |
6.4% |
|
|
Bunkers |
China |
|
Bunkers |
||
14.3% |
|
|
|
||||
|
|
1.2% |
|
|
1.0% |
||
|
|
|
|
16.2% |
|
||
|
|
|
|
|
|
|
|
Transition |
|
|
|
|
Transition |
|
|
Economies* |
|
|
|
Economies* |
|
|
|
9.6% |
|
|
|
|
9.0% |
|
|
Middle |
|
|
|
|
Middle East |
|
|
East |
|
|
OECD |
|
|
OECD |
|
|
|
|
5.9% |
|
|||
4.8% |
12 200 Mtoe |
47.7% |
|
16 500 Mtoe |
41.2% |
||
|
|
|
|
||||
*Includes Former USSR and Non-OECD Europe.
** Asia excludes China.
47

E |
|
|
|
|
|
|
|
|
|
|
|
|
N |
|
Selected Energy Indicators for 2004 |
||||||||||
E |
|
|||||||||||
R |
|
|
|
|
|
|
|
|
|
|
|
|
|
|
|
|
|
|
|
|
|
|
|
||
G |
|
|
|
|
|
|
|
|
|
|
|
|
Y |
|
|
|
|
|
|
|
|
|
|
|
|
|
Region/ |
Popu- |
|
GDP |
GDP |
Energy |
Net |
TPES |
Elec. |
CO2 |
||
|
|
|
||||||||||
I |
|
Country |
lation |
|
|
(PPP) |
Prod. |
Imports |
|
Cons.(a) |
Emissions(b) |
|
|
|
(million) |
(billion |
(billion |
(Mtoe) |
(Mtoe) |
(Mtoe) |
(TWh) |
(Mt |
|||
N |
|
|
|
2000$) |
2000$) |
|
|
|
|
of CO2) |
||
D |
|
|
|
|
|
|
|
|
|
|
|
|
World |
6352 |
35025 |
52289 |
11213 |
- |
11223(c) |
15985 |
26583(d) |
||||
I |
||||||||||||
|
OECD |
1164 |
27698 |
29493 |
3860 |
1742 |
5508 |
9548 |
12911 |
|||
C |
|
|||||||||||
Middle East |
182 |
740 |
1282 |
1437 |
-942 |
480 |
524 |
1183 |
||||
A |
||||||||||||
|
|
|
|
|
|
|
|
|
|
|
||
|
Former USSR |
286 |
491 |
1989 |
1508 |
-521 |
979 |
1184 |
2313 |
|||
T |
|
|||||||||||
|
|
|
|
|
|
|
|
|
|
|
||
O |
Non-OECD Europe |
54 |
145 |
413 |
63 |
44 |
104 |
166 |
265 |
|||
R |
|
China |
1303 |
1904 |
7219 |
1537 |
115 |
1626 |
2094 |
4769 |
||
S |
Asia |
2048 |
1822 |
6777 |
1127 |
191 |
1290 |
1264 |
2499 |
|||
|
|
Latin America |
443 |
1541 |
3119 |
655 |
-161 |
485 |
729 |
907 |
||
|
Africa |
872 |
685 |
1997 |
1027 |
-435 |
586 |
477 |
814 |
|||
|
|
|
|
|
|
|
|
|
|
|
|
|
|
|
Albania |
3.11 |
4.60 |
14.24 |
0.98 |
1.39 |
2.37 |
3.73 |
4.85 |
||
|
Algeria |
32.36 |
64.15 |
196.37 |
165.73 |
-132.30 |
32.89 |
26.29 |
77.84 |
|||
|
|
|
|
|
|
|
|
|
|
|
||
|
|
Angola |
15.49 |
12.38 |
31.04 |
57.36 |
-47.07 |
9.49 |
1.92 |
7.81 |
||
|
Argentina |
38.37 |
287.13 |
468.96 |
85.45 |
-21.31 |
63.71 |
88.28 |
135.98 |
|||
|
|
|
|
|
|
|
|
|
|
|
||
|
|
Armenia |
3.03 |
2.88 |
11.41 |
0.75 |
1.38 |
2.13 |
4.32 |
3.47 |
||
|
Australia |
20.21 |
455.60 |
598.31 |
261.77 |
-143.76 |
115.78 |
224.89 |
354.36 |
|||
|
|
|
|
|
|
|
|
|
|
|
||
|
|
Austria |
8.18 |
205.00 |
243.22 |
9.88 |
23.58 |
33.19 |
64.17 |
75.14 |
||
|
Azerbaijan |
8.31 |
7.85 |
31.70 |
20.05 |
-7.07 |
12.95 |
20.25 |
29.30 |
|||
|
|
|
|
|
|
|
|
|
|
|
||
|
|
Bahrain |
0.72 |
9.92 |
13.66 |
15.84 |
-8.70 |
7.49 |
7.77 |
16.95 |
||
|
Bangladesh |
139.22 |
55.97 |
239.30 |
18.39 |
4.38 |
22.79 |
19.43 |
33.55 |
|||
|
|
|
|
|
|
|
|
|
|
|
||
|
|
Belarus |
9.82 |
16.65 |
62.93 |
3.62 |
23.37 |
26.78 |
30.88 |
60.64 |
||
|
Belgium |
10.42 |
246.30 |
290.14 |
13.53 |
52.03 |
57.69 |
89.37 |
116.05 |
|||
|
|
|
|
|
|
|
|
|
|
|
||
|
|
Benin |
8.18 |
2.68 |
8.20 |
1.62 |
0.87 |
2.48 |
0.55 |
2.41 |
||
|
Bolivia |
9.01 |
9.31 |
22.52 |
11.82 |
-7.37 |
4.98 |
3.92 |
10.45 |
|||
|
|
Bosnia and Herzegovina |
3.91 |
5.50 |
25.27 |
3.25 |
1.35 |
4.70 |
8.52 |
16.28 |
||
|
Botswana |
1.77 |
6.49 |
16.17 |
1.01 |
0.86 |
1.87 |
2.34 |
4.32 |
|||
|
|
|
|
|
|
|
|
|
|
|
||
|
|
Brazil |
183.91 |
655.38 |
1385.12 |
176.31 |
31.33 |
204.85 |
359.56 |
323.32 |
||
(a)Gross production + imports – exports – transmission/distribution losses.
(b)CO2 emissions from fuel combustion only. Emissions are calculated using IEA's energy balances and the Revised
48 1996 IPCC Guidelines.