

BY REGION |
1 |
|
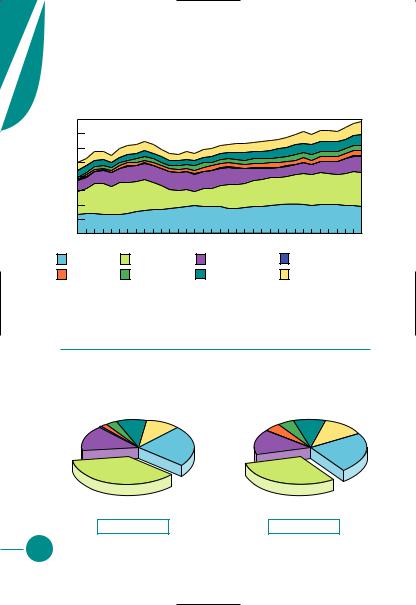
The OECD |
from 1971 to 2004 of OECD Total Primary Energy Supply* by Region (Mtoe)
1974 |
1977 |
1980 |
1983 |
1986 |
1989 |
1992 |
1995 |
1998 |
2001 |
2004 |
OECD North America |
OECD Pacific |
OECD Europe |
and 2004 Regional Shares of TPES*
1973 |
2004 |
Europe |
OECD Europe |
37.3% |
33.9% |
|
OECD |
|
Pacific |
|
16.0% |
OECD North America |
OECD North America |
51.8% |
50.1% |
3 762 Mtoe |
5 506 Mtoe |
*Excludes electricity trade.
9
S |
|
|
|
U |
Crude Oil Production |
||
P |
|||
P |
|
|
|
|
|
|
|
L |
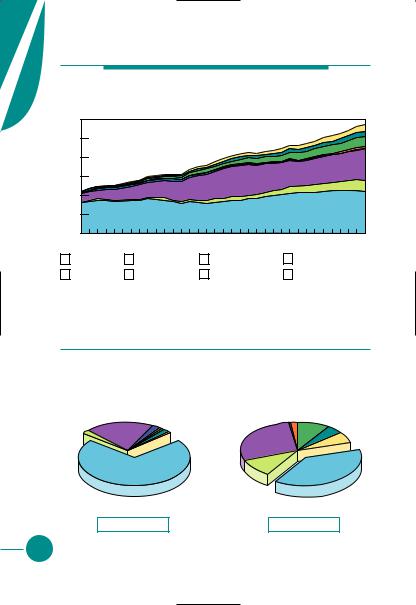
Evolution from 1971 to 2005 of Crude Oil Production by Region |
||
Y |
|||
|
|
(Mt) |
|
4000 |
|
|
|
|
|
|
|
|
|
|
|
3500 |
|
|
|
|
|
|
|
|
|
|
|
3000 |
|
|
|
|
|
|
|
|
|
|
|
2500 |
|
|
|
|
|
|
|
|
|
|
|
2000 |
|
|
|
|
|
|
|
|
|
|
|
1500 |
|
|
|
|
|
|
|
|
|
|
|
1000 |
|
|
|
|
|
|
|
|
|
|
|
500 |
|
|
|
|
|
|
|
|
|
|
|
0 |
1975 |
1978 |
1981 |
1984 |
1987 |
1990 |
1993 |
1996 |
1999 |
2002 |
2005 |
1972 |
OECD |
Middle East |
Former USSR |
Non-OECD Europe |
China |
Asia* |
Latin America |
Africa |
1973 and 2005 Regional Shares of
Crude Oil Production
|
|
1973 |
|
|
|
2005 |
|
||
Non- |
|
Asia* |
Latin |
|
Non- |
|
Asia* |
Latin |
|
OECD |
China |
3.2% |
America |
Africa |
OECD |
China |
4.5% |
America |
Africa |
Europe |
|
8.6% |
Europe |
|
9.2% |
||||
0.7% |
1.9% |
|
|
10.0% |
0.2% |
4.5% |
|
|
12.2% |
Former |
|
|
|
|
Former |
|
|
|
|
USSR |
|
|
|
|
|
|
|
|
|
|
|
|
|
USSR |
|
|
|
|
|
15.0% |
|
|
|
|
|
|
|
|
|
|
|
|
|
14.7% |
|
|
|
|
|
|
|
|
|
|
|
|
|
|
|
|
|
|
|
OECD |
|
|
|
|
OECD |
Middle East |
|
|
23.6% |
Middle East |
|
|
23.7% |
||
|
|
|
|
|
|
||||
37.0% |
|
|
|
|
30.8% |
|
|
|
|
|
|
2 867 Mt |
|
|
|
3 923 Mt |
|
||
10 |
*Asia excludes China. |

Producers, Exporters and Importers |
1 |
of Crude Oil |
|
|
% of |
|
Mt |
World |
|
|
total |
Arabia |
519 |
13.2 |
|
470 |
12.0 |
States |
307 |
7.8 |
Rep. of Iran |
205 |
5.2 |
|
188 |
4.8 |
Rep. of China |
183 |
4.7 |
|
162 |
4.1 |
|
143 |
3.6 |
|
139 |
3.5 |
|
133 |
3.4 |
|
|
|
the World |
1 474 |
37.7 |
|
|
|
|
3 923 |
100.0 |
|
|
|
Exporters |
Mt |
|
|
|
|
Saudi Arabia |
346 |
|
|
|
|
Russia |
258 |
|
|
|
|
Importers |
Mt |
||||
Norway |
132 |
|
|||
|
United States |
577 |
|||
Nigeria |
123 |
|
|||
|
Japan |
206 |
|||
Islamic Rep. of Iran |
122 |
|
|||
|
People’s Rep. of China |
123 |
|||
Mexico |
105 |
|
|||
|
Korea |
114 |
|||
United Arab Emirates |
95 |
|
|||
|
Germany |
110 |
|||
Venezuela |
94 |
|
|||
|
India |
96 |
|||
Canada |
87 |
|
|||
|
Italy |
93 |
|||
Iraq |
75 |
|
|||
|
France |
85 |
|||
|
|
|
|||
Rest of the World |
716 |
|
|||
|
United Kingdom |
63 |
|||
|
|
|
|||
World |
2 153 |
|
Netherlands |
60 |
|
|
|
|
|
|
|
2004 data |
|
|
Rest of the World |
708 |
|
|
|
|
|
||
|
|
|
World |
2 235 |
|
|
|
|
|
|
2004 data
11
S |
|
U |
Natural Gas Production |
P |
|
P |
|
L |
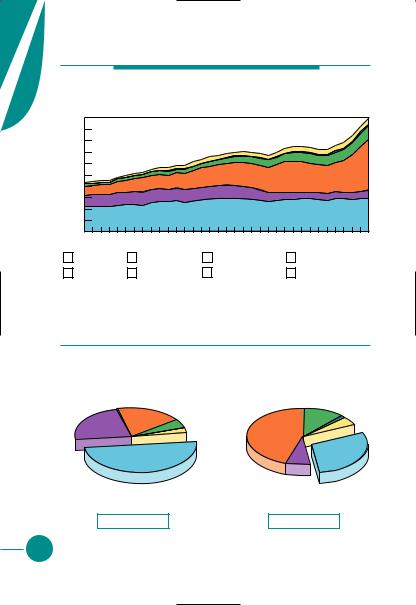
Evolution from 1971 to 2005 of Natural Gas Production by Region |
Y |
|
|
(Billion Cubic Metres) |
|
3000 |
|
2500 |
|
2000 |
|
1500 |
|
1000 |
|
500 |
|
0 |
1972 |
1975 |
1978 |
1981 |
1984 |
1987 |
1990 |
1993 |
1996 |
1999 |
2002 |
2005 |
|||||
|
OECD |
|
|
Middle East |
|
Former USSR |
|
|
Non-OECD Europe |
|||||||
|
|
|
|
|
|
|||||||||||
|
|
|
|
|
|
|||||||||||
|
China |
|
|
Asia* |
|
|
Latin America |
|
|
|
Africa |
|
|
|||
|
|
|
|
|
|
|
|
|
|
|||||||
|
|
|
|
|
|
|
|
|
|
|||||||
1973 and 2005 Regional Shares of
Natural Gas Production
|
1973 |
|
|
2005 |
|
|
||
|
Non- |
|
Asia* |
Non- |
|
|
Latin |
|
Former |
OECD |
|
China |
|
|
|||
China |
1.0% |
OECD |
Asia* |
|
||||
Europe |
America |
|||||||
USSR |
2.6% |
0.4% |
Latin America |
Europe |
1.9% |
9.5% |
4.7% |
Africa |
Middle 19.7% |
|
|
2.0% |
0.6% |
|
|
|
|
East |
|
|
|
|
|
|
6.2% |
|
|
|
Africa |
|
|
|
|
||
2.1% |
|
|
Former |
|
|
|
|
|
|
|
|
0.8% |
|
|
|
|
|
|
|
|
|
USSR |
|
|
|
|
|
|
|
|
28.2% |
|
|
|
|
|
|
|
OECD |
Middle |
|
|
|
OECD |
|
|
|
East |
|
|
|
||
|
|
|
71.4% |
|
|
|
38.6% |
|
|
|
|
10.3% |
|
|
|
||
|
|
|
|
|
|
|
|
|
|
1 226 Bcm |
|
|
2 872 Bcm |
|
|||
12 |
*Asia excludes China. |

Producers, Exporters and Importers* |
1 |
of Natural Gas |
|
Mm3 |
% of |
|
|
|
|
|
|
|
World |
|
|
|
|
|
|
|
|
|
total |
|
|
|
|
|
|
|
627 446 |
21.8 |
|
|
|
|
|
|
|
Exporters |
Mm3 |
|
|
|
|||
States |
516 614 |
18.0 |
|
|
|
|
||
|
Russia |
203 727 |
|
|
|
|||
|
187 164 |
6.5 |
|
|
|
|
||
|
|
|
|
|
|
|
||
|
92 797 |
3.2 |
|
Canada |
106 353 |
|
Importers |
Mm3 |
|
|
Norway |
82 801 |
|
||||
Kingdom |
92 045 |
3.2 |
|
|
United States |
121 348 |
||
|
|
|
|
|||||
|
|
|
|
Algeria |
68 638 |
|
||
|
89 559 |
3.1 |
|
|
Germany |
90 700 |
||
|
|
|
|
|
||||
|
|
|
|
Netherlands |
52 355 |
|
||
. of Iran |
83 535 |
2.9 |
|
|
Japan |
80 915 |
||
|
|
|
|
|||||
|
|
|
|
Turkmenistan |
49 423 |
|
||
|
78 804 |
2.7 |
|
|
Italy |
73 460 |
||
|
|
|
|
|
||||
|
|
|
|
Indonesia |
36 146 |
|
||
|
77 305 |
2.7 |
|
|
Ukraine |
62 132 |
||
|
|
|
|
|
||||
|
|
|
|
Malaysia |
32 614 |
|
||
Arabia |
69 500 |
2.4 |
|
|
France |
46 975 |
||
|
|
|
|
|||||
|
|
|
|
Qatar |
27 992 |
|
||
the World |
957 004 |
33.3 |
|
|
Spain |
33 118 |
||
|
United States |
22 288 |
|
|||||
|
|
|
|
|
Korea |
29 494 |
||
|
2 871 773 |
100.0 |
|
|
||||
|
|
|
|
|
||||
|
Rest of the World |
165 646 |
|
|||||
|
|
|
|
|
Turkey |
26 572 |
||
|
|
|
|
|
||||
|
|
|
|
|
|
|
||
|
|
|
|
World |
847 983 |
|
Netherlands |
23 025 |
|
|
|
|
|
|
|
|
|
|
|
|
|
2005 data |
|
|
Rest of the World |
250 140 |
|
|
|
|
|
|
|
|
|
|
|
|
|
|
|
|
World |
837 879 |
*Exports and imports include pipeline gas and LNG. |
|
|
||||||
2005 data |
|
|||||||
|
|
|
|
|
|
|
|
|
13
S |
|
U |
Hard Coal Production |
P |
|
P |
|
L |
Evolution from 1971 to 2005 of Hard Coal Production by Region |
Y |
|
|
(Mt) |
|
5000 |
|
4500 |
|
4000 |
|
3500 |
|
3000 |
|
2500 |
|
2000 |
|
1500 |
|
1000 |
|
500 |
|
0 |
1972 |
1975 |
1978 |
1981 |
1984 |
1987 |
1990 |
1993 |
1996 |
1999 |
2002 |
2005 |
|||||
|
OECD |
|
|
Middle East |
|
Former USSR |
|
|
Non-OECD Europe |
|||||||
|
|
|
|
|
|
|||||||||||
|
|
|
|
|
|
|||||||||||
|
China |
|
|
Asia* |
|
|
Latin America |
|
|
|
Africa |
|
|
|||
|
|
|
|
|
|
|
|
|
|
|||||||
|
|
|
|
|
|
|
|
|
|
|||||||
1973 and 2005 Regional Shares of
Hard Coal Production
|
1973 |
|
|
2005 |
|
|
Non- |
China |
Asia* |
|
|
Asia* |
|
OECD |
Latin America |
|
Latin America |
|||
Europe |
18.7% |
4.8% |
0.3% |
China |
12.0% |
1.4% |
0.4% |
|
|
Africa |
44.8% |
|
Africa |
Former |
|
|
|
|
4.9% |
|
|
|
3.1% |
|
|
||
USSR |
|
|
|
|
|
|
|
|
|
|
|
|
|
.8% |
|
|
|
|
|
|
|
|
|
OECD |
|
Former |
OECD |
|
|
|
50.0% |
|
USSR |
29.6% |
|
|
|
|
|
7.3% |
|
|
2 235 Mt |
|
|
4 973 Mt |
||
14 |
*Asia excludes China. |

Producers, Exporters and Importers |
1 |
of Coal |
|
Hard |
Brown |
|
Coal |
Coal |
|
(Mt) |
(Mt) |
Rep. of China |
2 226 |
* |
States |
951 |
77 |
|
398 |
32 |
|
301 |
71 |
Africa |
240 |
75 |
|
222 |
0 |
|
140 |
178 |
|
98 |
62 |
|
79 |
0 |
|
61 |
4 |
|
|
|
the World |
257 |
406 |
|
|
|
|
4 973 |
905 |
|
|
|
|
Hard |
Exporters |
Coal |
|
(Mt) |
Australia |
231 |
Indonesia |
108 |
Russia |
76 |
South Africa |
73 |
People’s Rep. of China |
72 |
Colombia |
56 |
United States |
45 |
Canada |
28 |
Poland |
21 |
Kazakhstan |
17 |
|
|
Rest of the World |
44 |
|
|
World |
771 |
|
|
2005 data |
|
*Included in hard coal.
|
Hard |
Importers |
Coal |
|
(Mt) |
Japan |
178 |
Korea |
77 |
Chinese Taipei |
61 |
United Kingdom |
44 |
Germany |
38 |
India |
37 |
United States |
28 |
People’s Rep. of China |
25 |
Spain |
25 |
Italy |
24 |
|
|
Rest of the World |
241 |
|
|
World |
778 |
|
|
2005 data |
|
15
S |
|
|
|
U |
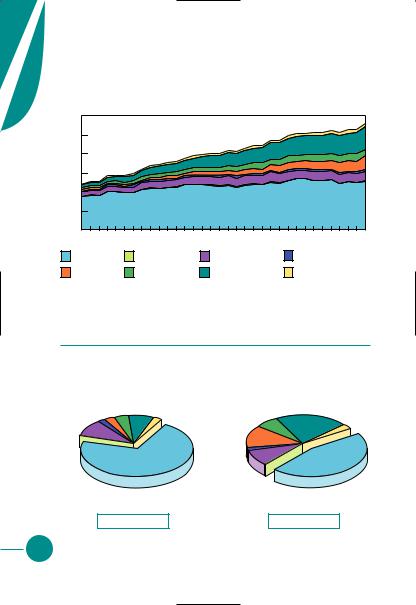
Nuclear Production |
||
P |
|||
P |
|
|
|
|
|
|
|
L |
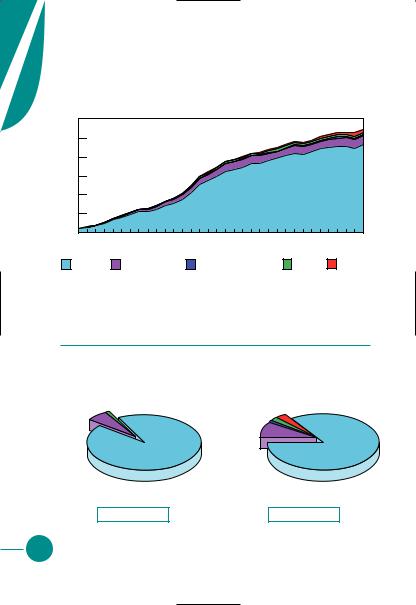
Evolution from 1971 to 2004 of Nuclear Production by Region |
||
Y |
|||
|
|
(TWh) |
|
3000 |
|
|
|
|
|
|
|
|
|
|
|
2500 |
|
|
|
|
|
|
|
|
|
|
|
2000 |
|
|
|
|
|
|
|
|
|
|
|
1500 |
|
|
|
|
|
|
|
|
|
|
|
1000 |
|
|
|
|
|
|
|
|
|
|
|
500 |
|
|
|
|
|
|
|
|
|
|
|
0 |
1974 |
1977 |
1980 |
1983 |
1986 |
1989 |
1992 |
1995 |
1998 |
2001 |
2004 |
1971 |
|||||||||||
OECD |
Former USSR |
Non-OECD Europe |
|
Asia* |
Other** |
||||||
1973 and 2004 Regional Shares of
Nuclear Production
|
1973 |
|
|
2004 |
|
|
|
Non- |
Asia* |
|
|
|
Asia* |
OECD |
Other** |
||
|
Europe |
2.2% |
3.0% |
||
Former |
1.3% |
||||
1.0% |
|
|
|||
|
|
|
|||
USSR |
|
Former |
|
|
|
5.9% |
|
|
|
||
|
USSR |
|
|
||
|
|
9.1% |
|
|
|
|
|
OECD |
|
OECD |
|
|
|
92.8% |
|
84.7% |
|
|
203 TWh |
|
2 738 TWh |
||
|
*Asia excludes China. |
16 |
** Other includes Africa, Latin America & China. |

Producers of Nuclear Electricity
1
|
|
% of |
|
TWh |
World |
|
|
total |
States |
813 |
29.6 |
|
448 |
16.4 |
|
282 |
10.3 |
|
167 |
6.1 |
|
145 |
5.3 |
|
131 |
4.8 |
|
90 |
3.3 |
|
87 |
3.2 |
Kingdom |
80 |
2.9 |
|
77 |
2.8 |
|
|
|
the World |
418 |
15.3 |
|
|
|
|
2 738 |
100.0 |
|
|
|
Installed |
GW |
|
|
% of |
|
Capacity |
|
Country |
nuclear |
||
|
|
||||
United States |
99 |
|
(based on first |
in total |
|
|
domestic |
||||
|
|
|
10 producers) |
||
France |
63 |
|
electricity |
||
|
|
||||
Japan |
45 |
|
|
generation |
|
|
France |
78 |
|||
Russia |
22 |
|
|||
Germany |
21 |
|
Sweden |
50 |
|
|
|
|
|||
Korea |
16 |
|
Ukraine |
48 |
|
|
|
|
|||
Ukraine |
13 |
|
Korea |
37 |
|
|
|
|
|||
Canada |
12 |
|
Germany |
28 |
|
|
|
|
|||
United Kingdom |
12 |
|
Japan |
26 |
|
|
|
|
|||
Sweden |
9 |
|
United Kingdom |
20 |
|
|
United States |
20 |
|||
|
|
|
|||
Rest of the World |
45 |
||||
|
Russia |
16 |
|||
|
|
|
|||
World |
357 |
|
Canada |
15 |
|
2004 data |
|
|
|
|
|
|
|
Rest of the World* |
8 |
||
Source: Commissariat à |
|
|
|
||
|
World |
16 |
|||
l’Énergie Atomique (France). |
|
||||
|
|
|
|
|
|
*Excludes countries with no nuclear production. |
2004 data |
17
S |
|
|
|
U |
Hydro Production |
||
P |
|||
P |
|
|
|
|
|
|
|
L |
Evolution from 1971 to 2004 of Hydro Production by Region |
||
Y |
|||
|
|
(TWh) |
|
3000 |
|
|
|
|
|
|
|
|
|
|
|
2500 |
|
|
|
|
|
|
|
|
|
|
|
2000 |
|
|
|
|
|
|
|
|
|
|
|
1500 |
|
|
|
|
|
|
|
|
|
|
|
1000 |
|
|
|
|
|
|
|
|
|
|
|
500 |
|
|
|
|
|
|
|
|
|
|
|
0 |
|
|
|
|
|
|
|
|
|
|
|
1971 |
1974 |
1977 |
1980 |
1983 |
1986 |
1989 |
1992 |
1995 |
1998 |
2001 |
2004 |
OECD |
Middle East |
Former USSR |
Non-OECD Europe |
China |
Asia* |
Latin America |
Africa |
1973 and 2004 Regional Shares of
Hydro Production
1973 2004
|
Non- |
China Asia* |
|
|
OECD |
Latin America |
|
Former |
Europe |
3.0% 4.3% |
7.3% |
USSR |
2.2% |
|
Africa |
9.5% |
|
|
2.3% |
Middle |
|
|
|
East |
|
|
|
0.3% |
|
|
|
|
|
|
OECD |
|
|
|
71.1% |
Asia* |
Latin America |
|
|
21.0% |
|
||
China 6.6% |
Africa |
||
|
|||
12.6% |
|
3.1% |
|
Non-OECD |
|
|
|
Europe |
|
|
|
2.0% |
|
|
|
Former USSR |
|
|
|
8.8% |
|
OECD |
|
Middle East |
|
||
0.6% |
|
45.1% |
1 282 TWh |
2 808 TWh |
18 |
*Asia excludes China. |