

Producers of Hydro Electricity
1
|
|
% of |
|
TWh |
World |
|
|
total |
Rep. of China |
354 |
12.6 |
|
341 |
12.1 |
|
321 |
11.4 |
States |
271 |
9.7 |
|
176 |
6.3 |
|
109 |
3.9 |
|
94 |
3.3 |
|
85 |
3.0 |
|
70 |
2.5 |
|
60 |
2.1 |
|
|
|
the World |
927 |
33.1 |
|
|
|
|
2 808 |
100.0 |
|
|
|
data
countries
no hydro production.
Installed |
GW |
|
|
|
% of |
Capacity |
|
Country |
hydro |
||
|
|
|
|||
(based on production) |
|
|
|
(based on first |
in total |
|
|
|
domestic |
||
|
|
|
|
10 producers) |
|
United States |
99 |
|
|
electricity |
|
|
|
|
|||
|
|
|
generation |
||
People’s Rep. of China |
86 |
|
|
|
|
|
|
Norway |
98.8 |
||
Canada |
67 |
|
|
||
Brazil |
59 |
|
|
Brazil |
82.8 |
Japan |
46 |
|
|
Venezuela |
71.0 |
Russia |
44 |
|
|
Canada |
57.0 |
India |
30 |
|
|
Sweden |
39.6 |
Norway |
28 |
|
|
Russia |
18.9 |
France |
25 |
|
|
People’s Rep. of China |
16.1 |
Sweden |
16 |
|
|
India |
12.7 |
|
|
|
|
Japan |
8.8 |
Rest of the World |
307 |
|
|
||
|
|
United States |
6.5 |
||
|
|
|
|
||
World |
807 |
|
|
||
|
|
|
|
||
|
Rest of the World* |
14.2 |
|||
|
|
|
|
||
|
|
|
|
||
2003 data
Sources: United Nations, World 16.1
IEA.
2004 data
19
T |
|
|
|
|
|
|
|
|
|
|
|
|
R |
|
|
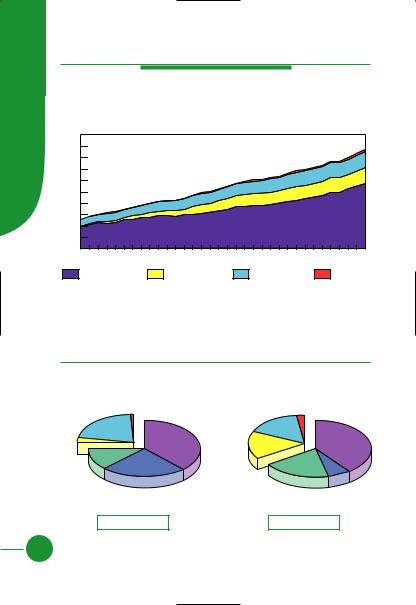
Refining by Product |
|
|
|||||||
A |
|
|
|
|
||||||||
N |
|
|
|
|
|
|
|
|
|
|
|
|
S |
Evolution from 1971 to 2004 of World Refinery Production |
|
||||||||||
F |
|
|||||||||||
O |
|
|
|
|
by Product (Mt) |
|
|
|
|
|
||
|
|
|
|
|
|
|
|
|
|
|
|
|
R |
4000 |
|
|
|
|
|
|
|
|
|
|
|
M |
3500 |
|
|
|
|
|
|
|
|
|
|
|
A |
3000 |
|
|
|
|
|
|
|
|
|
|
|
T |
2500 |
|
|
|
|
|
|
|
|
|
|
|
I |
2000 |
|
|
|
|
|
|
|
|
|
|
|
O |
1500 |
|
|
|
|
|
|
|
|
|
|
|
N |
1000 |
|
|
|
|
|
|
|
|
|
|
|
|
500 |
|
|
|
|
|
|
|
|
|
|
|
|
0 |
1974 |
1977 |
1980 |
1983 |
1986 |
1989 |
1992 |
1995 |
1998 |
2001 |
2004 |
|
1971 |
|||||||||||
LPG/Ethane/Naphtha |
Motor Gasoline |
Aviation Fuels |
Middle Distillates |
Heavy Fuel Oil |
Other Products |
1973 and 2004 Shares of Refinery Production by Product
|
1973 |
|
|
2004 |
|
||
|
Other |
LPG/Ethane/ |
|
|
Other |
LPG/Ethane/ |
|
Heavy Fuel |
Products |
Naphtha |
Motor |
|
Products |
Naphtha |
Motor |
9.2% |
5.8% |
Gasoline |
|
12.7% |
8.3% |
Gasoline |
|
Oil |
|
|
21.0% |
Heavy Fuel |
|
|
24.0% |
33.8% |
|
|
|
Oil |
|
|
|
|
|
|
|
16.4% |
|
|
|
|
|
|
Aviation |
|
|
|
|
|
|
|
Fuels |
|
|
|
|
|
|
|
4.2% |
|
|
|
Aviation |
|
|
Middle Distillates |
|
|
|
|
Fuels |
|
|
26.0% |
|
|
Middle Distillates |
6.1% |
|
|
|
|
|
|
32.5% |
|
|
|
2 719 Mt |
|
|
3 719 Mt |
|
||
20

Producers, Exporters and Importers
of Petroleum Products
|
|
% of |
Producers |
Mt |
World |
|
|
total |
United States |
841 |
22.6 |
People’s Rep. of China |
265 |
7.1 |
Japan |
199 |
5.4 |
Russia |
191 |
5.1 |
India |
129 |
3.5 |
Germany |
120 |
3.2 |
Korea |
116 |
3.1 |
Canada |
105 |
2.8 |
Italy |
98 |
2.6 |
Saudi Arabia |
96 |
2.6 |
|
|
|
Rest of the World |
1 559 |
42.0 |
|
|
|
World |
3 719 |
100.0 |
|
|
|
2004 data |
|
|
2
Exporters |
Mt |
|
|
|
Russia |
72 |
|
|
|
Netherlands |
71 |
|
|
|
|
Importers |
Mt |
||
Saudi Arabia |
58 |
|
United States |
97 |
United States |
54 |
|
||
|
Netherlands |
56 |
||
Singapore |
52 |
|
||
|
Singapore |
51 |
||
Venezuela |
34 |
|
||
|
Japan |
49 |
||
Korea |
31 |
|
||
|
People’s Rep. of China |
46 |
||
Kuwait |
31 |
|
||
|
Germany |
34 |
||
United Kingdom |
30 |
|
||
|
France |
33 |
||
Italy |
24 |
|
||
|
Spain |
25 |
||
|
|
|
||
Rest of the World |
435 |
|
||
|
Korea |
22 |
||
|
|
|
||
World |
892 |
|
Indonesia |
20 |
2004 data |
|
|
|
|
|
|
Rest of the World |
392 |
|
|
|
|
|
|
|
|
|
World |
825 |
|
|
|
|
|
2004 data
21
T |
|
|
|
|
|
|
|
|
|
|
|
|
R |
|
|
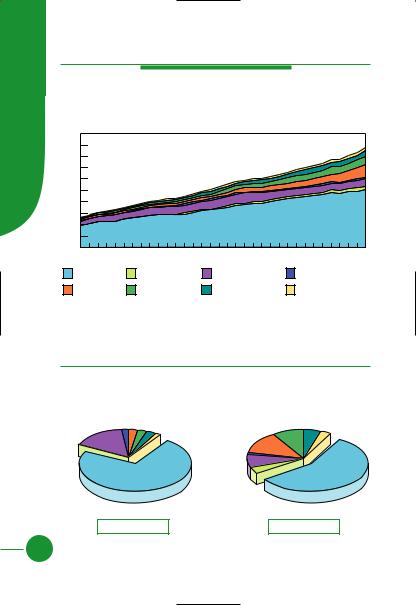
Refining by Region |
|
|
|
||||||
A |
|
|
|
|
|
|||||||
N |
|
|
|
|
|
|
|
|
|
|
|
|
S |
Evolution from 1971 to 2004 of World Refinery Throughput |
|
||||||||||
F |
|
|||||||||||
O |
|
|
|
|
by Region (Mt) |
|
|
|
|
|
||
|
|
|
|
|
|
|
|
|
|
|
|
|
R |
4000 |
|
|
|
|
|
|
|
|
|
|
|
M |
3500 |
|
|
|
|
|
|
|
|
|
|
|
A |
3000 |
|
|
|
|
|
|
|
|
|
|
|
T |
2500 |
|
|
|
|
|
|
|
|
|
|
|
I |
2000 |
|
|
|
|
|
|
|
|
|
|
|
O |
1500 |
|
|
|
|
|
|
|
|
|
|
|
N |
1000 |
|
|
|
|
|
|
|
|
|
|
|
|
|
|
|
|
|
|
|
|
|
|
|
|
|
500 |
|
|
|
|
|
|
|
|
|
|
|
|
0 |
1974 |
1977 |
1980 |
1983 |
1986 |
1989 |
1992 |
1995 |
1998 |
2001 |
2004 |
|
1971 |
|||||||||||
OECD |
Middle East |
Former USSR |
Non-OECD Europe |
China |
Asia* |
Latin America |
Africa |
1973 and 2004 Regional Shares of
Refinery Throughput
1973 |
2004 |
Non-
OECD China Asia* Former Europe 1.5% 3.3% USSR 1.5%
12.4%
Middle
East 4.0%
|
|
Non- |
|
|
Latin America |
|
OECD |
China |
Asia* |
Former |
Europe |
|||
9.0% |
USSR |
0.8% |
7.3% |
10.0% Latin America |
Africa |
7.4% |
|
|
6.5% |
1.7% |
|
|
||
|
|
|
Africa |
|
|
Middle |
|
|
3.3% |
|
|
|
|
|
|
East |
|
|
|
|
8.3% |
|
|
|
OECD |
|
|
|
OECD |
66.6% |
|
|
|
56.4% |
2 739 Mt |
3 797 Mt |
*Asia excludes China.
22

Refinery Capacity, Net Exporters and
Net Importers of Oil*
2
Crude |
|
% of |
|
|
|
|
|
|
|
Distillation |
kb/cd |
World |
|
|
|
|
|
|
|
Capacity |
|
total |
|
|
|
|
|
|
|
United States |
17 130 |
20.5 |
|
|
|
|
|
|
|
Net Exporters |
|
Mt |
|
|
|
||||
Former USSR |
8 120 |
9.7 |
|
|
|
|
|
||
|
Saudi Arabia |
|
404 |
|
|
|
|||
People’s Rep. of China** |
6 250 |
7.5 |
|
|
|
|
|
||
Japan |
4 670 |
5.6 |
|
Russia |
|
325 |
|
Net Importers |
Mt |
Korea |
2 580 |
3.1 |
|
Norway |
|
141 |
|
United States |
616 |
Germany |
2 430 |
2.9 |
|
Islamic Rep. of Iran |
|
133 |
|
||
|
|
|
Japan |
251 |
|||||
Italy |
2 320 |
2.8 |
|
Venezuela |
|
128 |
|
||
|
|
|
People’s Rep. of China |
147 |
|||||
India |
2 250 |
2.7 |
|
Nigeria |
|
117 |
|
||
|
|
|
Germany |
119 |
|||||
Saudi Arabia |
2 100 |
2.5 |
|
Kuwait |
|
104 |
|
||
|
|
|
Korea |
105 |
|||||
Canada |
2 020 |
2.4 |
|
United Arab Emirates |
|
100 |
|
||
|
|
|
France |
94 |
|||||
|
|
|
|
Mexico |
|
96 |
|
||
Rest of the World |
33 660 |
40.3 |
|
|
|
India |
86 |
||
|
|
|
|
|
|||||
|
|
|
|
Iraq |
|
72 |
|
||
World |
83 530 |
100.0 |
|
|
|
Italy |
83 |
||
|
|
|
|
|
|||||
Rest of the World |
|
571 |
|
||||||
|
|
|
|
|
|
Spain |
77 |
||
2005 data |
|
|
|
|
|
||||
|
|
|
2004 data |
|
|
Chinese Taipei |
48 |
||
|
|
|
|
|
|
||||
|
|
|
|
|
|
|
|
||
|
|
|
|
|
|
|
|
|
|
|
|
|
|
|
|
|
|
Rest of the World |
579 |
|
|
|
|
|
|
|
|
|
|
*Crude oil and petroleum products. |
|
|
2004 data |
|
|||||
**Does not include unlisted small teapot refineries |
|
|
|
|
|||||
which are estimated at between 200 and 500 kb/cd. |
|
|
|
|
|||||
23
T |
|
|
|
|
|
|
|
|
|
|
|
|
R |
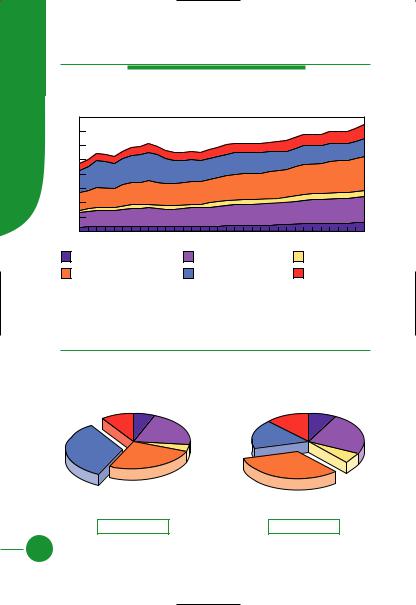
Electricity Generation* by Fuel |
|
||||||||||
A |
|
|||||||||||
N |
|
|
|
|
|
|
|
|
|
|
|
|
S |
|
|
|
|
|
|
|
|
|
|
|
|
F |
Evolution from 1971 to 2004 of World Electricity Generation* |
|
||||||||||
O |
|
|||||||||||
R |
|
|
|
|
by Fuel (TWh) |
|
|
|
|
|
||
M |
20000 |
|
|
|
|
|
|
|
|
|
|
|
A |
18000 |
|
|
|
|
|
|
|
|
|
|
|
T |
16000 |
|
|
|
|
|
|
|
|
|
|
|
I |
14000 |
|
|
|
|
|
|
|
|
|
|
|
12000 |
|
|
|
|
|
|
|
|
|
|
|
|
O |
|
|
|
|
|
|
|
|
|
|
|
|
10000 |
|
|
|
|
|
|
|
|
|
|
|
|
N |
|
|
|
|
|
|
|
|
|
|
|
|
8000 |
|
|
|
|
|
|
|
|
|
|
|
|
|
6000 |
|
|
|
|
|
|
|
|
|
|
|
|
4000 |
|
|
|
|
|
|
|
|
|
|
|
|
2000 |
|
|
|
|
|
|
|
|
|
|
|
|
0 |
1974 |
1977 |
1980 |
1983 |
1986 |
1989 |
1992 |
1995 |
1998 |
2001 |
2004 |
|
1971 |
|||||||||||
Thermal |
Nuclear |
Hydro |
Other** |
1973 and 2004 Fuel Shares of
Electricity Generation*
|
1973 |
|
2004 |
|
|
Hydro |
Other** |
|
Hydro |
Other** |
|
21.0% |
0.7% |
Coal |
16.1% |
2.1% |
Coal |
Nuclear |
|
38.3% |
|
|
39.8% |
3.3% |
|
|
|
|
|
Gas |
|
|
Nuclear |
|
|
12.1% |
|
|
15.7% |
|
|
|
Oil |
|
Gas |
|
Oil |
|
|
19.6% |
|
6.7% |
|
|
24.7% |
|
|
||
|
|
|
|
|
|
6 117 TWh |
|
17 450 TWh |
|
||
*Excludes pumped storage.
**Other includes geothermal, solar, wind, combustible renewables & waste.
24

Electricity Production
from Fossil Fuels
Coal |
TWh |
United States |
2 090 |
People’s Rep. of China |
1 713 |
India |
461 |
Germany |
308 |
Japan |
294 |
South Africa |
226 |
Australia |
190 |
Russia |
161 |
Poland |
143 |
Korea |
142 |
|
|
Rest of the World |
1 216 |
|
|
World |
6 944 |
|
|
2004 data |
|
Oil |
TWh |
United States |
139 |
Japan |
133 |
Saudi Arabia |
81 |
People’s Rep. of China |
72 |
Mexico |
70 |
Italy |
47 |
Indonesia |
36 |
India |
36 |
Kuwait |
33 |
Iraq |
32 |
|
|
Rest of the World |
491 |
|
|
World |
1 170 |
|
|
2004 data |
|
2
Gas |
TWh |
United States |
732 |
Russia |
421 |
Japan |
244 |
United Kingdom |
160 |
Italy |
130 |
Islamic Rep. of Iran |
125 |
Thailand |
89 |
Mexico |
87 |
Saudi Arabia |
79 |
Egypt |
72 |
|
|
Rest of the World |
1 280 |
|
|
World |
3 419 |
|
|
2004 data
25
T |
|
|
|
|
|
|
|
|
|
|
|
|
R |
Electricity Generation* by Region |
|
||||||||||
A |
|
|||||||||||
N |
|
|
|
|
|
|
|
|
|
|
|
|
S |
|
|
|
|
|
|
|
|
|
|
|
|
F |
Evolution from 1971 to 2004 of World Electricity Generation* |
|
||||||||||
O |
|
|||||||||||
R |
|
|
|
|
by Region (TWh) |
|
|
|
|
|||
M |
20000 |
|
|
|
|
|
|
|
|
|
|
|
A |
18000 |
|
|
|
|
|
|
|
|
|
|
|
T |
16000 |
|
|
|
|
|
|
|
|
|
|
|
14000 |
|
|
|
|
|
|
|
|
|
|
|
|
I |
|
|
|
|
|
|
|
|
|
|
|
|
12000 |
|
|
|
|
|
|
|
|
|
|
|
|
O |
|
|
|
|
|
|
|
|
|
|
|
|
10000 |
|
|
|
|
|
|
|
|
|
|
|
|
N |
8000 |
|
|
|
|
|
|
|
|
|
|
|
|
6000 |
|
|
|
|
|
|
|
|
|
|
|
|
4000 |
|
|
|
|
|
|
|
|
|
|
|
|
2000 |
|
|
|
|
|
|
|
|
|
|
|
|
0 |
|
|
|
|
|
|
|
|
|
|
|
|
1971 |
1974 |
1977 |
1980 |
1983 |
1986 |
1989 |
1992 |
1995 |
1998 |
2001 |
2004 |
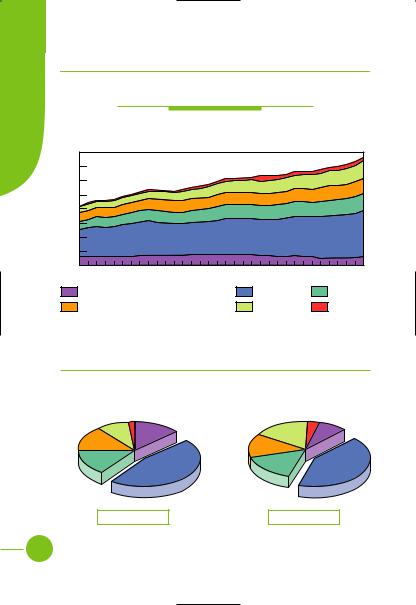
OECD |
Middle East |
Former USSR |
Non-OECD Europe |
China |
Asia** |
Latin America |
Africa |
1973 and 2004 Regional Shares of
Electricity Generation*
|
1973 |
|
|
|
2004 |
|
|||
|
Non- |
|
Asia** |
Latin |
Non- |
|
|
|
|
|
OECD |
|
|
|
Latin |
||||
Former |
China |
OECD |
China |
Asia** |
|||||
Europe |
2.6% |
America |
America |
||||||
USSR |
1.7% |
2.8% |
|
2.7% |
Europe |
12.8% |
8.7% |
||
15.0% |
|
|
|
|
Former 1.1% |
|
|
5.0% Africa |
|
Middle |
|
|
|
|
USSR |
|
|
3.1% |
|
East |
|
|
|
|
7.9% |
|
|
|
|
0.6% |
|
|
|
|
Middle |
|
|
|
|
|
|
|
|
|
|
|
|
||
|
|
|
|
|
East |
|
|
|
|
|
|
|
|
OECD |
3.4% |
|
|
OECD |
|
|
|
|
|
|
|
|
|||
|
|
|
|
72.8% |
|
|
|
58.0% |
|
|
6 117 TWh |
|
|
17 450 TWh |
|||||
26 |
* Excludes pumped storage. |
**Asia excludes China. |
|
|
Producers, Exporters and Importers
of Electricity
|
|
% of |
Producers* |
TWh |
World |
|
|
total |
United States |
4 148 |
23.8 |
People’s Rep. of China |
2 200 |
12.6 |
Japan |
1 071 |
6.1 |
Russia |
930 |
5.3 |
India |
668 |
3.8 |
Germany |
610 |
3.5 |
Canada |
598 |
3.4 |
France |
567 |
3.2 |
United Kingdom |
393 |
2.3 |
Brazil |
387 |
2.2 |
|
|
|
Rest of the World |
5 878 |
33.8 |
|
|
|
World |
17 450 |
100.0 |
|
|
|
2004 data |
|
|
Exporters** TWh
France |
69 |
Germany |
51 |
Paraguay |
45 |
Canada |
33 |
Switzerland |
28 |
Czech Republic |
25 |
United States |
23 |
Russia |
20 |
Sweden |
18 |
Poland |
15 |
Rest of the World 219
World 546
2004 data
** Gross production minus production from pumped storage plants.
** Total exports and total imports (including transit).
2
|
Importers** |
TWh |
|
|
Germany |
48 |
|
|
Italy |
46 |
|
|
Brazil |
37 |
|
|
United States |
34 |
|
|
Switzerland |
27 |
|
|
Canada |
23 |
|
|
Netherlands |
21 |
|
|
Austria |
17 |
|
|
Sweden |
16 |
|
|
Norway |
15 |
|
Rest of the World 258
World 542
2004 data
27
C |
|
|
|
|
|
|
|
|
|
|
|
|
|
O |
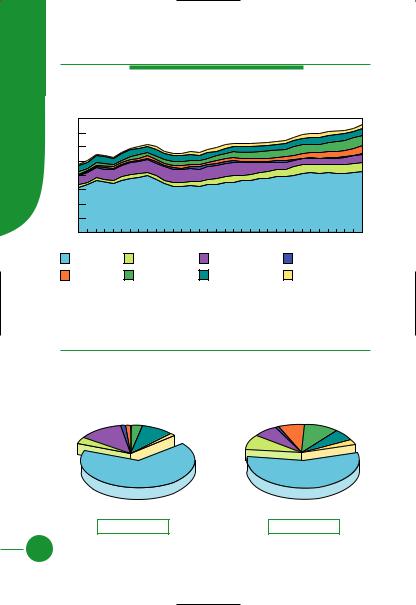
T O T A L F I N A L C O N S U M P T I O N |
||||||||||||
N |
|||||||||||||
S |
|||||||||||||
U |
|
|
|
|
The World |
|
|
|
|
||||
M |
|
|
|
|
|
|
|
|
|||||
P |
|
|
|
|
|
|
|
|
|
|
|
|
|
T |
Evolution from 1971 to 2004 of World Total Final Consumption |
||||||||||||
I |
|||||||||||||
|
|
|
|
by Fuel (Mtoe) |
|
|
|
|
|
||||
O |
|
|
|
|
|
|
|
|
|
||||
8000 |
|
|
|
|
|
|
|
|
|
|
|
||
N |
|
|
|
|
|
|
|
|
|
|
|
||
7000 |
|
|
|
|
|
|
|
|
|
|
|
||
|
|
|
|
|
|
|
|
|
|
|
|
||
|
6000 |
|
|
|
|
|
|
|
|
|
|
|
|
|
5000 |
|
|
|
|
|
|
|
|
|
|
|
|
|
4000 |
|
|
|
|
|
|
|
|
|
|
|
|
|
3000 |
|
|
|
|
|
|
|
|
|
|
|
|
|
2000 |
|
|
|
|
|
|
|
|
|
|
|
|
|
1000 |
|
|
|
|
|
|
|
|
|
|
|
|
|
0 |
1974 |
1977 |
1980 |
1983 |
1986 |
1989 |
1992 |
1995 |
1998 |
2001 |
2004 |
|
|
1971 |
||||||||||||
Coal |
Oil |
Gas |
Combustible Renewables & Waste* |
Electricity |
Other** |
1973 and 2004 Fuel Shares of
Total Final Consumption
|
1973 |
|
|
|
2004 |
|
|
Combustible |
Electricity |
Other** |
Coal |
|
Electricity |
Other** |
Coal |
1.7% |
|
3.4% |
|||||
Renewables |
9.5% |
|
13.4% |
Combustible |
16.2% |
|
8.4% |
& Waste* |
|
|
|
|
|
|
|
|
|
|
Renewables |
|
|
|
|
14.3% |
|
|
|
|
|
|
|
|
|
|
& Waste |
|
|
|
|
|
|
|
|
|
|
|
|
|
|
|
|
13.7% |
|
|
|
Gas |
|
|
|
|
|
|
|
14.6% |
|
|
Oil |
|
Gas |
|
Oil |
|
|
|
|
16.0% |
|
||
|
|
|
46.5% |
|
|
42.3% |
|
|
|
|
|
|
|
||
|
4 607 Mtoe |
|
|
7 644 Mtoe |
|
||
* Prior to 1994 combustible renewables & waste final consumption has been estimated.
**Other includes geothermal, solar, wind, heat, etc.
28