

PROCTER&GAMBLE ORGANIZATION 2005 A
.pdfProcter & Gamble: Organization 2005 (A) |
707-519 |
Organization 2005 in action
To implement the extensive restructuring program, on January 1, 1999, the P&G board installed a new CEO, Durk Jager. A long time P&G employee, Jager had been a key player in developing the plans for Organization 2005 while occupying the position of COO. He hoped to use Organization 2005 to change P&G’s risk-averse regionally managed structure so that it could launch new blockbuster brands based on new technologies rather than incremental improvements of existing products.30 To this end, he allocated a large share of P&G’s resources to GBU NBD groups and a Corporate New Ventures function (see Exhibit 6). This led to the development of several new
categories and brands such as Febreze, Swiffer, and Dryel. To drive his vision, Jager frequently |
||
scrutinized P&G’s R&D portfolio and personally stewarded new technologies through the pipeline |
||
that he felt were promising. |
or |
Post |
|
||
|
|
|
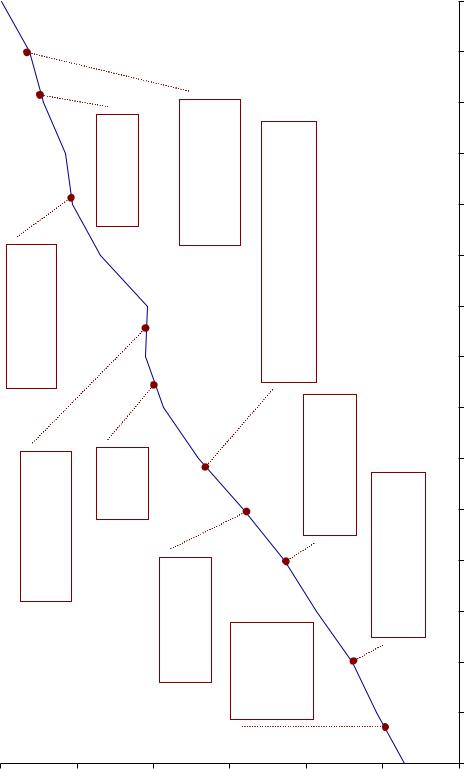
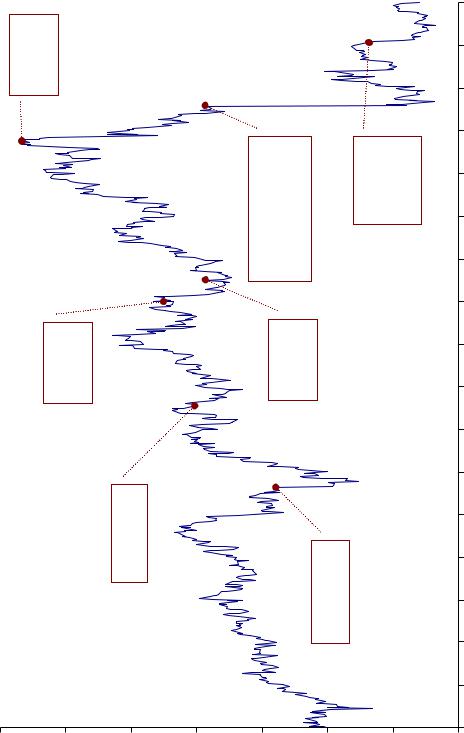
In October 1999, P&G’s fiscal first quarter results showed immediate acceleration in business |
||
performance. Sales were up 5 percent over the previous year, a marked improvement over the 2.6 percent annual revenue growth P&G had experienced the previous two years. Core net earnings, excluding restructuring costs, increased by 10 percent. Though these numbers fell short of the longterm goals, they were quite respectable for the first full quarter of any restructuring program. As a consequence, P&G’s stock appreciated significantly (see Exhibit 7). The stock price reached an alltime high of $118.38, when the next quarterly report came out on January 30, 2000, stating that sales grew an impressive 7 percent and core net earnings increased 13 percent (see Exhibits 8 and 9)
Yet, the situation deteriorated drastically on March 7, 2000, when P&G announced that instead of the expected 8 percent increase in quarterly earnings, the core earnings would be 10 percent lower than the 1999 January-March quarter, despite an increase in revenue. Higher-than-expected rawmaterial costs, delays in FDA approvals, and particularly intense international competition were blamed for the situation. That day the company’s stock lost 30 percent of its value, closing at $57.25,
less than a half of what it traded at in January. Jager told analysts:
We've had a track recordCopyof meeting our bottom-line commitments [and] have learned that we simply can't focus on the top line to make the bottom line grow. We are getting more innovations to market faster because of our Organization 2005 structure and culture changes.31 This has been a transition year. Going forward we are going to focus on P&G basics—hard- nosed cost management as well as accelerating sales growth.32
DespiteNotexecutives’ promises, P&G disappointed once again on June 8, 2000. Fourth-quarter profits were flat, against the expectations of 15-17 percent increase. P&G also lowered its future quarterly sales growth estimates to 2–3 percent, casting doubt on whether Organization 2005 was
Other executives noted that the company had 50 new products in the pipeline, including Impress, a patented food wrap that formed a water-tight seal with the application of pressure. The growing sales of Febreze, Swiffer, and Dryel were also expected to help reverse the crisis quickly. Yet, the situation became even worse when P&G announced its official quarterly numbers on April 25, 2000. Core net earnings excluding restructuring costs had fallen 18 percent while sales increased 6 percent despite a 2 percent hit from exchange-rate changes. “We are redoubling our efforts to manage costs,” Jager told analysts.33 The stock lost 10 percent of its value, giving back some gains to close in the
mid-60s.34
even lifting the top line. Increased competition, lower volume growth and negative currency effects were again blamed for the disappointing results. Market-research companies confirmed P&G’s poor competitive position citing its loss of U.S. market share in 16 out of 30 categories since the preceding year.35 P&G stock lost 7 percent, falling to $57 after the announcement; it had been the worstperforming component of the Dow over the previous six months.36 Jager had no choice but to resign.
Do |
11 |
|
This document is authorized for use only by Igor Stroganov until May 2012. Copying or posting is an infringement of copyright. Permissions@hbsp.harvard.edu or 617.783.7860.
707-519 -12-
DiversificationCategory
Driven-Development
Do-
&-Research
1Exhibit
Source: Procter & Gamble, 1999 Annual Report (Cincinnati: Procter & Gamble, 1999), pp. 3-5, http://www.pg.com/investors/annualreports.jhtml, accessed March 2006.
This document is authorized for use only by Igor Stroganov until May 2012. Copying or posting is an infringement of copyright. Permissions@hbsp.harvard.edu or 617.783.7860.
13- |
|
|
|
|
|
|
|
|
|
|
|
|
|
|
|
|
|
|
- |
|
|
|
|
|
|
|
|
|
|
|
|
|
|
|
|
|
|
707-519 |
|
|
|
|
|
|
|
|
|
|
|
|
|
|
0 |
|
|
|
|
|
|
|
|
|
|
|
|
|
|
|
|
|
|
|
|
|
|
|
|
|
|
|
|
|
|
|
|
|
|
|
|
|
0 |
|
|
|
|
|
|
|
|
|
|
|
|
|
|
|
|
|
|
|
0 |
|
|
|
|
|
|
|
|
|
|
|
|
|
|
|
|
|
|
|
2 |
|
|
|
|
|
|
|
|
|
|
|
|
|
|
|
|
9 |
|
|
|
|
|
|
|
|
|
|
|
|
|
|
|
|
|
|
9 |
|
|
|
|
|
|
|
|
|
|
|
|
|
|
|
|
|
|
|
9 |
|
|
|
|
|
|
|
|
|
|
|
|
|
|
|
|
|
|
|
1 |
|
|
|
|
|
|
|
|
|
|
|
|
|
|
|
|
8 |
|
|
|
|
|
|
|
|
|
|
|
and |
|
|
|
|
|
|
9 |
|
|
|
|
|
|
|
|
|
|
|
|
|
|
|
|
|
|
9 |
|
||
|
|
|
|
|
|
|
|
|
|
|
|
|
|
|
|
|
1 |
|
|
|
|
|
|
|
|
|
|
|
|
|
|
|
|
7 |
|
|
|
|
|
|
|
|
|
|
|
|
|
|
|
|
|
|
9 |
|
|
|
|
|
|
|
|
|
|
|
|
|
|
|
|
|
|
|
9 |
|
|
|
|
|
|
|
|
|
|
|
|
|
|
|
|
|
|
|
1 |
|
|
|
|
|
|
Organization2005 |
restructuringbegins |
|
Iamsacquired,andPUR markingentrycareintopet- |
waterpurificationmarkets- |
Max Factor, SKII, Hugo Boss perfume,acquired,andBetrix marking entry into prestige skin care,fragrances,men’sfine |
|
|
Post |
|
||||
|
|
|
|
|
|
market |
|
|
|
6 |
|
|
|
|||||
|
|
|
|
|
|
|
|
|
9 |
|
|
|||||||
|
|
|
|
|
|
|
|
|
|
9 |
|
|||||||
|
|
|
|
|
|
|
|
|
|
|
1 |
|
||||||
|
|
|
|
|
|
color-cosmetics |
|
|
|
5 |
|
|
|
|||||
|
|
|
|
|
|
|
|
|
9 |
|
|
|||||||
|
|
|
|
|
|
|
|
|
|
9 |
|
|||||||
|
|
|
|
|
|
|
|
|
|
|
1 |
|
||||||
|
|
|
|
|
|
|
|
|
|
|
|
|
||||||
|
Tambrandsacquired; |
leadership positiontamponin |
|
|
|
or |
|
|
4 |
|
|
|
||||||
|
|
|
|
andEuropeanthe |
|
|
|
|
|
|
||||||||
|
marketcaptured |
|
|
|
|
|
9 |
|
|
|||||||||
|
|
|
|
|
|
|
9 |
|
||||||||||
|
|
|
|
|
|
|
|
1 |
|
|||||||||
|
|
|
|
|
|
3 |
|
|
|
|||||||||
|
|
|
|
|
|
9 |
|
|
||||||||||
|
|
|
|
|
|
|
9 |
|
||||||||||
|
|
|
|
|
|
|
|
|
|
|
|
|
|
|
|
|
||
|
|
|
|
|
|
|
|
|
|
|
|
|
|
|
|
|
1 |
|
|
|
|
|
|
|
|
|
|
|
|
|
|
|
|
2 |
|
|
|
|
|
|
|
|
|
|
|
|
|
|
|
|
|
|
9 |
|
|
|
|
|
|
|
|
|
|
|
|
|
|
|
|
|
|
|
9 |
|
|
|
|
|
|
|
|
|
|
|
|
|
and |
|
|
|
|
|
1 |
|
|
|
|
|
|
|
restructuring |
|
|
|
|
Girl |
|
|
|
1 |
|
|
|
|
|
|
|
|
|
|
|
|
|
|
|
|
9 |
|
|
|||
|
|
|
|
|
|
|
|
|
|
|
|
|
|
9 |
|
|||
|
|
|
|
|
SGE |
begins |
|
|
|
|
|
|
|
|
1 |
|
||
|
|
|
|
|
|
|
|
|
|
|
0 |
|
|
|
||||
|
|
VP Schickedanzacquired, |
marking entry intopaperEU |
|
Copy |
|
(CoverNoxell |
Noxzema)acquired,marking cosmeticsentrycolorinto |
15 Product-supply restructuringbegins; Blendax acquired, markingentryinto EU oralcare market |
|
|
|
|
|||||
|
|
|
|
|
9 |
|
|
|||||||||||
|
|
|
|
|
|
9 |
|
|||||||||||
|
|
productsmarket |
|
|
|
|
1 |
|
||||||||||
|
|
|
|
9 |
|
|
|
|||||||||||
|
|
|
|
|
|
|
|
|
8 |
|
|
|||||||
|
|
|
|
|
|
|
|
|
|
9 |
|
|||||||
|
|
|
|
|
|
|
|
|
|
|
1 |
|
||||||
Procter & Gamble Net Sales, 1985-2000 |
Not |
|
|
|
30 Old Spice acquired, marking entry intomass fragrances |
|
|
|
|
8 |
|
|
|
|||||
|
|
|
|
|
|
|
8 |
|
|
|||||||||
|
|
|
|
|
|
|
|
9 |
|
|||||||||
|
|
|
|
|
|
|
|
|
1 |
|
||||||||
|
|
|
|
|
|
|
7 |
|
|
|
||||||||
|
|
|
|
|
|
|
8 |
|
|
|||||||||
|
|
|
|
|
|
|
|
9 |
|
|||||||||
|
|
|
|
thefold |
|
|
|
1 |
|
|||||||||
|
|
|
|
|
|
|
|
|
||||||||||
|
|
|
25 RichardsonVicks acquired;Pantene, |
ClearasilVicks, broughtbrandsinto |
|
|
6 |
|
|
Source: ProcterGamble.& |
||||||||
|
|
|
|
|
8 |
|
||||||||||||
|
|
|
|
|
|
9 |
||||||||||||
|
|
|
|
|
|
|
|
|
|
|
1 |
|||||||
|
|
|
|
|
|
|
|
|
5 |
|
|
|||||||
|
|
|
|
|
|
|
|
|
8 |
|
||||||||
40 |
|
|
35 |
|
|
|
20 |
10 |
|
9 |
||||||||
|
|
|
|
|
|
|
1 |
|||||||||||
|
|
|
|
|
|
|
|
|||||||||||
2 |
|
|
|
|
|
|
|
BillionsofDollars |
|
|
|
|
|
|
|
|||
Do |
|
|
|
|
|
|
|
|
|
|
|
|
|
|
|
|
|
|
Exhibit |
|
|
|
|
|
|
|
|
|
|
|
|
|
|
|
|
|
|
This document is authorized for use only by Igor Stroganov until May 2012. Copying or posting is an infringement of copyright. Permissions@hbsp.harvard.edu or 617.783.7860.

707-519 |
|
|
|
|
|
|
Post |
|||||
|
|
|
|
|
Procter & Gamble: Organization 2005 (A) |
|||||||
|
Exhibit 3 P&G Income Statement, Fiscal Years 1992-2000 |
|
|
|
|
|
||||||
|
|
|
1992 |
1993 |
1994 |
|
1995 |
1996 |
1997 |
1998 |
1999 |
2000 |
|
Net Sales |
29,362 |
30,433 |
30,385 |
|
33,482 |
35,284 |
35,764 |
37,154 |
38,125 |
39,951 |
|
|
Cost of Goods Sold |
17,324 |
17,683 |
17,338 |
|
19,561 |
20,938 |
20,510 |
20,896 |
21,027 |
21,018 |
|
|
Gross Profit |
12,038 |
12,750 |
13,047 |
|
13,921 |
14,346 |
15,254 |
16,258 |
17,098 |
18,933 |
|
|
Total SG&A |
9,171 |
9,589 |
9,377 |
|
9,677 |
9,531 |
9,766 |
10,203 |
10,845 |
12,165 |
|
|
|
Advertising Expense* |
2,693 |
2,973 |
2,996 |
|
3,284 |
3,254 |
3,466 |
3,704 |
3,639 |
3,793 |
|
|
R&D Expense* |
861 |
956 |
964 |
|
1,148 |
1,399 |
1,469 |
1,546 |
1,726 |
1,899 |
|
Operating Income |
2,867 |
3,161 |
3,670 |
|
4,244 |
4,815 |
5,488 |
6,055 |
6,253 |
6,768 |
|
|
Net Interest Expense |
(510) |
(552) |
(482) |
|
(488) |
(221) |
(239) |
(347) |
(650) |
(722) |
|
|
Other non-op Income |
425 |
404 |
158 |
|
244 |
120 |
- |
- |
235 |
304 |
|
|
Restructuring Charges |
- |
(2,705) |
- |
|
- |
- |
- |
- |
- |
(814) |
|
|
Other Items |
103 |
41 |
- |
|
- |
(45) |
- |
- |
- |
- |
|
|
Income Tax Expense |
Copy |
1,355 |
1,623 |
1,834 |
1,928 |
2,075 |
1,994 |
||||
|
1,013 |
80 |
1,135 |
|
||||||||
|
Net Income from Cont. Ops. |
1,872 |
269 |
2,211 |
|
2,645 or3,046 |
3,415 |
3,780 |
3,763 |
3,542 |
||
|
Employees (‘000) |
106 |
103.5 |
96.5 |
|
99.2 |
103 |
106 |
110 |
110 |
110 |
|
|
Source: Procter & Gamble Annual Reports. |
|
|
|
|
|
|
|
|
|
||
|
Exhibit 4 P&G Cash Flow Statements, Fiscal Years 1992-2000 |
|
|
|
|
|||||||
|
|
|
1992 |
1993 |
1994 |
|
1995 |
1996 |
1997 |
1998 |
1999 |
2000 |
|
|
|
|
|
|
|
|
|
|
|
||
|
Net Income |
1,872 |
269 |
2,211 |
2,645 |
3,046 |
3,415 |
3,780 |
3,763 |
3,542 |
||
|
Depreciation |
1,051 |
1,140 |
1,134 |
1,253 |
1,358 |
1,487 |
1,598 |
2,148 |
2,191 |
||
|
Asset Writedowns |
- |
2,705 |
- |
|
- |
- |
- |
- |
- |
- |
|
|
Other Operating Activities |
125 |
(1,065) |
196 |
|
181 |
328 |
(26) |
(101) |
(60) |
463 |
|
|
|
Not |
(23) |
289 |
108 |
(511) |
(574) |
1,006 |
(392) |
(307) |
(1,521) |
|
|
Change in Working Capital |
|||||||||||
|
Cash from Op. Activities |
3,025 |
3,338 |
3,649 |
3,568 |
4,158 |
5,882 |
4,885 |
5,544 |
4,675 |
||
|
Capital Expenditure |
(1,911) |
(1,911) |
(1,841) |
(2,146) |
(2,179) |
(2,129) |
(2,559) |
(2,828) |
(3,018) |
||
|
Sale of PP&E |
291 |
725 |
105 |
|
310 |
402 |
520 |
555 |
434 |
419 |
|
|
Cash Acquisitions |
(1,240) |
(138) |
(295) |
(623) |
(358) |
(150) |
(3,269) |
(137) |
(2,967) |
||
|
Invest. In Marketable Sec. |
- |
(306) |
23 |
|
96 |
(331) |
(309) |
63 |
356 |
221 |
|
|
Cash from Investing |
(2,860) |
(1,630) |
(2,008) |
(2,363) |
(2,466) |
(2,068) |
(5,210) |
(2,175) |
(5,345) |
||
|
Net Change in Debt |
1,019 |
(215) |
(664) |
(490) |
(38) |
(660) |
2,853 |
1,341 |
3,030 |
||
|
Net Purch. Of Com. Stock |
(49) |
(55) |
(14) |
(115) |
(432) |
(1,652) |
(1,929) |
(2,533) |
(1,430) |
||
Do |
|
(788) |
(850) |
(949) |
(1,062) |
(1,202) |
(1,329) |
(1,462) |
(1,626) |
(1,796) |
||
|
Total Dividends Paid |
|||||||||||
|
Other Financing Activities |
71 |
77 |
36 |
|
67 |
89 |
134 |
158 |
212 |
- |
|
|
Cash from Financing |
253 |
(1,043) |
(1,591) |
(1,600) |
(1,583) |
(3,507) |
(380) |
(2,606) |
(196) |
||
|
FX Rate Adj. |
(26) |
(119) |
1 |
|
50 |
(63) |
(31) |
(96) |
(18) |
(13) |
|
|
Net Change in Cash |
392 |
546 |
51 |
(345) |
46 |
276 |
(801) |
745 |
(879) |
||
Source: Procter & Gamble Annual Reports.
14
This document is authorized for use only by Igor Stroganov until May 2012. Copying or posting is an infringement of copyright. Permissions@hbsp.harvard.edu or 617.783.7860.
of infringement an is posting or Copying .2012 May until Stroganov Igor by only use for authorized is document This .7860.783.617 or edu.harvard.Permissions@hbsp .copyright
707-519 -15-
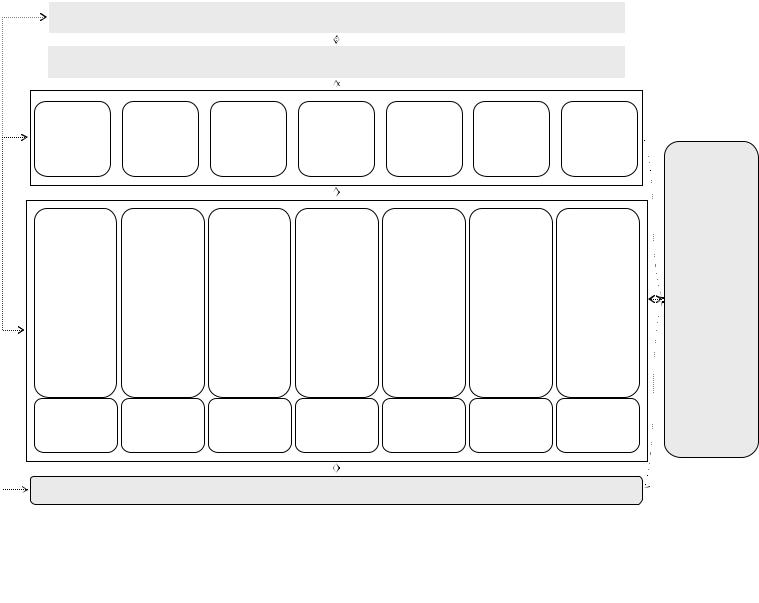
Exhibit 5 Organization 2005 Structure, 1999 |
|
|
|
|
|
|
|
|
|
|
|
|
||||||
Do |
|
|
|
|
|
|
|
|
|
|
|
|
||||||
|
|
|
|
|
|
|
|
|
Consumers around the world |
|
|
|
|
|
|
|
||
|
|
|
|
|
|
|
|
|
|
|
|
|
||||||
|
|
|
|
|
|
|
|
|
|
|
|
|
|
|
|
|
|
|
|
|
|
|
|
|
|
Customers (Wal-Mart, Target, Costco, Kroger, Safeway, CVS, Tesco, Carrefour, etc.) |
|
|
|
|
|
||||||
|
MDOs |
|
|
Not |
|
|
|
|
|
|
|
|
|
|
||||
|
CBD* |
|
|
|
|
|
|
|
|
|
|
|
|
|
|
|
|
|
|
|
|
|
|
|
|
|
|
|
|
|
|
|
|
|
|||
|
Field Sales** |
|
|
North |
Western |
CEEMEA¹ |
Latin |
Northeast |
China |
Asia, |
|
|
|
|
||||
|
CMK*** |
|
|
|
|
GBS |
|
|||||||||||
|
|
|
America |
Europe |
|
|
America |
Asia |
|
Australia, |
|
|
|
|||||
|
External Relations |
|
|
|
|
|
|
|
|
|||||||||
|
|
|
|
|
|
|
|
|
|
|||||||||
|
|
|
|
|
|
|
|
|
|
India |
|
|
|
|
||||
|
Recruiting |
|
|
|
|
|
|
|
|
|
|
|
|
|
||||
|
HR |
|
|
|
|
|
|
|
|
|
|
|
|
Employee |
||||
|
MDO IT |
|
|
|
|
|
|
|
|
|
|
|
|
Services |
||||
|
|
|
|
|
|
|
|
|
|
|
|
|
|
|
|
Accounting & |
||
|
|
|
|
|
|
|
|
|
|
|
|
|
|
|
||||
|
GBUs |
|
|
|
|
|
|
|
|
|
|
|
|
Financial |
||||
|
|
|
|
|
|
|
|
|
|
|
|
|
||||||
|
|
|
Fabric and |
Healthcare |
Beauty Care |
Snacks & |
Tissue & |
Feminine |
Baby Care |
|
Reporting |
|||||||
|
|
|
|
|
|
|
|
|
|
|||||||||
|
Marketing |
|
|
Home Care† |
OTC/ |
|
|
Beverages |
Towel |
Protection |
|
|
|
Workplace |
||||
|
|
|
|
Pharma. |
•Pantene |
|
|
|
|
•Pampers |
|
|||||||
|
Market Research |
|
•Tide |
|
•Pringles |
•Bounty |
•Always |
|
Services |
|||||||||
|
|
|
•Olay |
|
•Luvs |
|
||||||||||||
|
R&D |
|
•Mr. Clean |
•Vicks |
•Cover Girl |
|
•Folgers |
•Charmin |
•Tampax |
•Babysan |
|
|
|
|
||||
|
Manufacturing |
|
|
|
Employee |
|||||||||||||
|
|
•Lenor |
•Scope |
•H&S |
|
•Millstone |
•Puffs |
•Whisper |
|
|
|
|||||||
|
Purchasing |
|
|
|
•Crest |
Copy |
|
|
|
|
Purchases |
|||||||
|
Distribution |
|
•Joy |
•Old Spice |
|
•Jiff |
•Tempo |
|
|
|
|
|
|
|
||||
|
Finance |
|
•Downy |
•Pepto |
•Secret |
|
•Crisco |
|
|
|
|
|
IT Business |
|||||
|
HR |
|
•Dawn/Fairy |
•Metamucil |
•SK-II |
|
•Sunny |
|
|
|
|
|
||||||
|
GBU IT |
|
•Cheer |
•Nyquil |
•Zest |
|
Delight |
or |
|
Solutions |
||||||||
|
|
|
|
|
•Cascade |
•PUR |
•Clearasil |
|
•Punica |
|
Business |
|||||||
|
|
|
|
|
•Bounce |
•Iams |
•Noxzema |
|
•Olean |
|
||||||||
|
|
|
|
|
•Ace Bleach |
•Actonel |
•Hugo Boss |
|
|
|
Information |
|||||||
|
New Business |
|
|
|
•Macrodantin |
|
|
|
Central IT |
|||||||||
|
|
|
|
|
|
|
|
|
|
|
||||||||
|
|
|
|
|
|
|
|
|
|
|
|
|
||||||
|
Development |
|
•Febreeze |
•Thermacare |
|
|
•Torengos |
|
|
|
|
|
Services |
|||||
|
|
|
|
|
|
|
|
|
|
|
|
|
|
|
||||
|
|
|
|
|
•Swiffer |
|
|
|
•Cooking |
|
|
|
|
|
|
|
|
|
|
|
|
|
|
•Dryel, Fit |
|
|
|
Schools |
|
|
|
|
|
|
|
|
|
|
|
|
|
|
|
|
|
|
|
|
|
|
|
|
||||
|
|
|
|
|
|
|
|
Corporate Functions – Corporate New Ventures, Engineering, etc. |
Post |
|||||||||
|
|
|
|
|
|
|
|
|
|
|
|
|
||||||
† Laundry Division is in Fabric and Home Care
*CBD = customer business development (primary sales function)
**Field Sales = local teams responsible for monitoring in-store execution, shelf presence, etc.
***CMK = consumer market knowledge
¹CEEMEA = Central Europe, Middle East, and Africa
Source: Adapted from Procter & Gamble organization charts, 1999
707-519 -16-
2005Organization Dofor VisionJager's
6Exhibit
Post2006. Marchaccessed
http://www.pg.com/investors/annualreports.jhtml,5,
Gamble,& pp.1999), -3
1999Gamble, ReportAnnual Procter(Cincinnati:
&Procter
Source: fromExcerpted
This document is authorized for use only by Igor Stroganov until May 2012. Copying or posting is an infringement of copyright. Permissions@hbsp.harvard.edu or 617.783.7860.
17- |
|
|
|
|
|
|
|
|
|
|
|
|
|
Post9 |
|
|||||
- |
|
|
|
|
|
|
|
|
|
|
|
|
|
|
||||||
707-519 |
|
|
|
|
|
|
|
|
|
|
|
|
|
|
||||||
|
|
|
|
|
|
|
|
|
|
|
|
|
|
|
0 |
|
|
|
|
|
|
|
|
|
|
|
|
|
|
|
|
|
|
|
|
0 |
|
|
|
|
|
|
|
|
|
|
|
|
|
|
|
|
|
|
|
|
|
- |
|
|
|
|
|
|
|
|
|
|
|
|
|
|
|
|
|
|
|
|
|
g |
|
|
|
|
|
|
|
|
|
|
|
|
|
|
|
|
|
|
|
|
|
u |
|
|
|
inP&Gtalksto |
acquireWarner |
Lambert |
|
|
|
|
|
|
|
|
|
|
|
0 |
|
|
|
A |
|
|
|
|
|
|
|
|
|
|
|
|
|
|
|
|
|
|
||||
|
|
|
|
|
|
|
|
|
|
|
|
|
|
|
0 |
|
|
|
|
|
|
|
|
|
|
|
|
|
|
|
|
|
|
|
|
|
- |
|
|
|
|
|
|
|
|
|
|
|
|
|
|
|
|
|
|
|
|
|
n |
|
|
|
|
|
|
|
|
|
|
|
|
|
|
|
|
|
|
|
|
|
Ju |
|
|
|
|
|
|
|
|
|
|
|
|
|
|
|
|
|
0 |
|
|
|
|
|
|
|
|
|
|
|
|
|
|
|
|
|
|
|
|
0 |
|
|
|
|
|
|
|
|
|
|
|
|
|
|
|
|
|
|
|
|
|
- |
|
|
|
|
|
|
|
|
|
|
|
|
|
|
|
|
|
|
|
|
r |
|
|
||
|
|
|
|
|
|
|
|
|
|
|
|
|
|
|
|
|
p |
|
|
|
|
|
|
|
|
|
|
|
|
|
|
|
|
|
|
00 |
|
A |
|
||
|
|
|
|
|
|
|
|
|
|
|
|
|
|
|
|
|
|
|
||
|
|
|
|
|
|
|
|
|
|
|
|
|
|
|
|
- |
|
|
|
|
|
|
|
|
|
|
|
|
Stock loses 30% in one day as |
P&G announces it will miss earnings estimates by at least 10% |
With anothermiss |
imminent, Jager |
resigns andLafley takes over |
|
|
|
eb |
|
|
||
|
|
|
|
|
|
|
|
|
|
|
|
|
A |
|
||||||
|
|
|
|
|
|
|
|
|
|
|
or |
|
|
|
|
|
|
|
||
|
|
|
|
|
|
|
|
|
|
|
|
|
|
|
9 |
|
F |
|
||
|
|
|
|
|
|
|
|
|
|
|
|
|
|
|
|
- |
|
|
|
|
|
|
|
|
|
|
|
|
|
|
|
|
|
|
|
|
|
ec |
|
|
|
|
|
|
|
|
|
|
|
|
|
|
|
|
|
|
|
|
|
D |
|
|
|
|
|
|
|
|
|
|
|
|
|
|
|
|
|
9 |
|
|
|
|
|
|
|
|
|
|
|
|
|
|
|
|
|
|
|
|
9 |
|
|
|
|
|
|
|
|
|
|
|
|
|
|
|
|
|
|
|
|
|
- |
|
|
|
|
|
|
|
|
|
|
|
|
|
|
|
|
|
|
|
|
t |
|
|
|
|
|
|
|
|
|
|
|
|
|
|
|
|
|
|
|
|
|
c |
|
|
|
|
|
|
|
|
|
|
Copy |
|
|
|
|
|
|
|
|
O |
|
|||
|
|
|
|
|
|
|
|
|
|
|
|
9 |
|
|
|
|
|
|||
|
|
|
|
|
|
|
|
|
|
|
|
|
|
|
9 |
|
|
|
|
|
|
|
|
|
|
|
|
|
|
|
|
|
|
|
|
|
- |
|
|
|
|
|
|
|
|
|
|
|
|
|
|
|
|
|
|
|
|
|
g |
|
|
|
|
|
|
|
|
|
|
|
|
|
|
|
|
|
|
|
|
|
u |
|
|
|
|
|
|
|
|
|
|
|
|
|
|
|
|
|
9 |
|
|
|
|
|
|
|
|
|
|
|
|
|
|
|
|
|
|
|
|
9 |
|
|
|
|
|
|
|
|
|
|
|
|
|
|
|
|
|
|
|
|
|
- |
|
|
|
|
|
|
|
|
|
|
|
|
|
|
|
|
|
|
|
|
|
n |
|
|
|
|
|
|
Organization announced2005 |
analyststo |
|
|
|
|
Organization structure2005 in |
place |
|
|
|
|
|
|
|
Ju |
|
|
|
|
|
|
|
|
|
|
|
|
|
9 |
|
|
|
|
|
||||
|
|
|
|
|
|
|
|
|
|
|
|
|
|
|
9 |
|
|
|
|
|
|
|
|
|
|
|
|
|
|
|
|
|
|
|
|
|
- |
|
|
|
|
|
|
|
|
|
|
|
|
|
|
|
|
|
|
|
|
r |
|
|
||
|
|
|
|
|
|
|
|
|
|
|
|
|
|
|
|
|
p |
|
|
|
|
|
|
|
|
|
|
|
|
|
|
|
|
|
|
99 |
|
A |
|
||
|
|
|
|
|
|
|
|
|
|
|
|
|
|
|
|
|
|
|
||
|
|
|
|
|
|
|
|
|
|
|
|
|
|
|
|
- |
|
|
|
|
|
|
|
|
|
|
|
|
|
|
|
|
|
|
|
|
|
b |
|
|
|
|
|
|
|
|
|
|
|
|
|
|
|
|
|
|
|
|
|
e |
|
|
|
|
|
|
|
|
|
|
|
|
|
|
|
|
|
|
|
|
F |
|
|
|
|
|
|
|
|
|
|
|
|
|
|
|
|
|
8 |
|
|
|
|
|
|
|
|
|
|
|
|
|
|
|
|
|
|
|
|
9 |
|
|
|
|
|
|
|
|
|
|
|
|
|
|
|
|
|
|
|
|
|
- |
|
|
|
|
|
|
|
|
|
|
|
|
|
|
|
|
|
|
|
|
|
ec |
|
|
|
|
|
|
|
|
|
|
|
|
|
|
|
|
|
|
|
|
|
D |
|
|
|
|
|
|
|
|
|
|
|
|
|
|
|
|
|
8 |
|
|
|
|
|
|
|
|
|
|
|
|
|
|
|
|
|
|
|
|
9 |
|
|
|
|
|
|
|
|
|
|
|
|
|
|
|
|
|
|
|
|
|
- |
|
|
|
|
|
|
|
|
|
|
|
|
|
|
|
|
|
|
|
|
t |
|
|
|
|
|
|
|
|
|
|
|
|
|
|
|
|
|
|
|
|
|
c |
|
|
|
|
Not |
from |
|
|
|
|
|
|
|
|
|
|
|
|
O |
|
||||
1997–2000History, |
promotedJager |
CEOtoCOO |
|
|
|
2005Organization |
internallyannounced |
|
|
|
98 |
|
|
|
|
|||||
|
|
|
|
|
|
|
|
|
|
|
|
|
|
|||||||
|
|
|
|
|
|
|
|
|
|
|
|
|
|
|
|
- |
|
|
|
|
|
|
|
|
|
|
|
|
|
|
|
|
|
|
|
|
|
g |
|
|
|
|
|
|
|
|
|
|
|
|
|
|
|
|
|
|
|
|
|
u |
|
|
|
|
|
|
|
|
|
|
|
|
|
|
|
|
|
8 |
|
|
|
A |
|
|
|
|
|
|
|
|
|
|
|
|
|
|
|
|
|
|
|
|
|
|
|
|
|
|
|
|
|
|
|
|
|
|
|
|
|
9 |
|
|
|
|
|
|
|
|
|
|
|
|
|
|
|
|
|
|
|
|
|
- |
|
|
|
|
|
|
|
|
|
|
|
|
|
|
|
|
|
|
|
|
|
n |
|
|
|
|
|
|
|
|
|
|
|
|
|
|
|
|
|
|
|
|
|
u |
|
|
|
|
|
|
|
|
|
|
|
|
|
|
|
|
|
|
|
|
J |
|
|
|
|
|
|
|
|
|
|
|
|
|
|
|
|
|
8 |
|
|
|
|
|
|
|
|
|
|
|
|
|
|
|
|
|
|
|
|
9 |
|
|
|
|
|
|
|
|
|
|
|
|
|
|
|
|
|
|
|
|
|
- |
|
|
|
|
|
|
|
|
|
|
|
|
|
|
|
|
|
|
|
|
r |
|
|
||
|
|
|
|
|
|
|
|
|
|
|
|
|
|
|
|
|
p |
|
|
|
PriceShareGamble&Procter |
120 |
|
110 |
|
100 |
|
|
|
70 |
|
60 |
50 |
8 |
|
|
A |
Gamble.&ProcterSource: |
|||
|
|
|
|
|
|
|
|
|
|
|||||||||||
|
|
|
|
|
|
|
|
|
|
|
|
|
|
|
9 |
|
|
|
|
|
|
|
|
|
|
|
|
|
|
|
|
|
|
|
|
|
- |
|
|
|
|
|
|
|
|
|
|
|
|
|
|
|
|
|
|
|
|
|
b |
|
|
|
|
|
|
|
|
|
|
|
|
|
|
|
|
|
|
|
|
|
e |
|
|
Do |
|
|
|
|
|
|
|
|
|
|
|
|
|
|
|
|
|
F |
|
|
|
|
|
|
|
|
|
|
|
|
|
|
|
|
7 |
|
|
|
|
|
|
|
|
|
|
|
|
|
|
|
|
|
|
|
|
|
9 |
|
|
|
|
|
|
|
|
|
|
|
|
|
|
|
|
|
|
|
|
|
- |
|
|
|
|
|
|
|
|
|
|
|
|
|
|
|
|
|
|
|
|
|
ec |
|
|
|
|
|
|
|
|
|
|
|
|
|
|
|
|
|
|
|
|
|
D |
|
|
|
|
|
|
|
|
|
|
|
|
|
|
|
|
|
7 |
|
|
|
|
|
|
|
|
|
|
|
|
|
|
|
|
|
|
|
|
9 |
|
|
|
|
|
|
|
|
|
|
|
|
90 |
80 |
|
|
|
|
|
|
|
- |
|
|
|
|
|
|
|
|
|
|
|
|
|
|
|
|
|
|
t |
|
|
|
|||
|
|
|
|
|
|
|
|
|
|
|
|
|
|
|
c |
|
|
|||
|
|
|
|
|
|
|
|
|
|
|
|
|
|
|
|
|
|
O |
|
|
|
|
|
|
|
|
|
DollarsperShare |
|
|
|
|
|
|
|
|
|
|
|||
7 |
|
|
|
|
|
|
|
|
|
|
|
|
|
|
|
|
|
|
|
|
Exhibit |
|
|
|
|
|
|
|
|
|
|
|
|
|
|
|
|
|
|
|
|
This document is authorized for use only by Igor Stroganov until May 2012. Copying or posting is an infringement of copyright. Permissions@hbsp.harvard.edu or 617.783.7860.
.7860.783.617 or edu.harvard.Permissions@hbsp .copyright
of infringement an is posting or Copying .2012 May until Stroganov Igor by only use for authorized is document This
Do |
|
|
|
|
|
|
|
|
|
|
|
|
|
|
|
|
|
|
|
|
|
|
|
|
|
|
|
|
|
|
|
|
|
|
|
707-519 -18- |
|||||||||||||||
|
|
|
|
|
|
|
|
|
|
|
|
|
|
|
|
|
|
|
|
|
|
|
|
|
|
|
|
|
|
|
|
|
|
|
|
|
|
|
|
|
|
|
|
|
|
|
|
|
|||
Exhibit 8 P&G GBU Financial Data, 1998–2000 Fiscal Years |
|
|
|
|
|
|
|
|
|
|
|
|
|
|
|
|
|
|
|
|
|
|
|
|
|
|
|
|
|||||||||||||||||||||||
|
|
|
|
|
|
|
|
|
|
|
|
|
|
|
|
|
|
|
|
|
|
|
|
|
|
|
|
|
|
|
|
|
|
|
|
|
|
|
|
|
|
|
|
|
|
||||||
|
|
|
|
|
|
Fabric & Home Care† |
|
|
|
|
Paper |
|
|
Beauty Care |
|
|
Health Care |
|
|
Food & Beverage |
|
||||||||||||||||||||||||||||||
|
|
|
|
|
|
|
|
|
|
|
|
|
|
|
|
|
|
|
|
|
|
|
|
|
|
|
|
|
|
|
|
|
|
|
|
|
|
|
|
|
|
|
|
|
|
|
|
|
|
|
|
|
|
|
|
|
|
1998 |
1999 |
2000 |
|
1998 |
1999 |
|
2000 |
|
1998 |
|
|
|
1999 |
2000 |
|
|
1998 |
1999 |
2000 |
|
|
1998 |
1999 |
2000 |
|
||||||||||||||||||||
|
|
|
|
|
|
|
|
|
|
|
|
|
|
|
|
|
|
|
|
|
|
|
|
|
|
|
|
|
|
|
|
|
|
|
|
|
|
|
|
|
|
|
|
|
|
|
|
|
|
|
|
Net Sales |
11,019 |
11,415 |
12,157 |
|
11,685 |
12,190 |
|
12,044 |
|
7,469 |
|
|
|
7,376 |
7,389 |
|
|
2,889 |
2,876 |
3,909 |
|
|
4,620 |
4,655 |
4,634 |
|
|||||||||||||||||||||||||
EBIT |
2,240 |
2,417 |
2,318 |
|
1,772 |
2,195 |
|
1,817 |
|
1,379 |
|
|
|
1,457 |
1,393 |
|
|
381 |
372 |
540 |
|
|
477 |
528 |
566 |
|
|||||||||||||||||||||||||
Depreciation |
295 |
293 |
354 |
|
611 |
638 |
|
664 |
|
198 |
|
|
|
198 |
194 |
|
|
105 |
107 |
159 |
|
|
135 |
149 |
153 |
|
|||||||||||||||||||||||||
Net Earnings |
1,406 |
1,497 |
1,450 |
|
990 |
1,278 |
|
1,069 |
|
845 |
|
|
|
917 |
894 |
|
|
232 |
242 |
335 |
|
|
294 |
328 |
364 |
|
|||||||||||||||||||||||||
Total Assets |
|
|
5,047 |
5,477 |
|
|
|
8,184 |
|
8,415 |
|
|
|
|
|
3,754 |
3,497 |
|
|
|
1,556 |
2,229 |
|
|
|
2,598 |
2,611 |
|
|||||||||||||||||||||||
CapEx |
|
|
Not638 807 1,327 |
1,282 |
|
|
|
|
|
285 |
310 |
|
|
|
143 |
195 |
|
|
|
237 |
235 |
|
|||||||||||||||||||||||||||||
Key Brands |
|
|
Tide, Ariel, |
|
|
|
|
Pampers, Always |
|
Pantene, Olay, |
|
|
Vics, Actonel |
|
|
Folgers, Pringles, |
|
||||||||||||||||||||||||||||||||||
|
Downy, Lenor |
|
Charmin, Bounty |
|
Covergirl, SK-II |
|
|
|
|
|
Jiff, Crisco |
|
|
|
|||||||||||||||||||||||||||||||||||||
|
|
|
|
|
|
|
|
|
|
|
|
|
|
|
|
|
|
|
|
|
|
|
|||||||||||||||||||||||||||||
60% |
|
|
|
|
|
|
|
|
|
|
|
|
|
|
|
|
|
|
|
Copy |
|
|
|
|
|
|
|
|
|
|
|
|
|
|
|
||||||||||||||||
Source: Procter & Gamble, 2000 Annual Report (Cincinnati: Procter & Gamble, 2000), p. 40, http://www.pg.com/investors/annualreports.jhtml, accessed March 2006. |
|
|
|
|
|
|
|
||||||||||||||||||||||||||||||||||||||||||||
Note: All numbers in Millions of 2000 U.S. dollars. The difference between GBU totals and the corporate is attributable to corporate eliminations, or corporate level assets. |
|
|
|
|
|
|
|
||||||||||||||||||||||||||||||||||||||||||||
† Fabric and Home Care includes Laundry Division. |
|
|
|
|
|
|
|
|
|
|
|
|
|
|
|
|
|
|
|
|
|
|
|
|
|
|
|
|
|
|
|
|
|
|
|
||||||||||||||||
Exhibit 9 P&G Regional Sales/Profit Breakdowns, 2000 Fiscal Year |
|
Exhibit 10 P&G Organic Volume and Sales Growth, 1998-2000 Fiscal Years |
|||||||||||||||||||||||||||||||||||||||||||||||||
70% |
|
|
|
|
|
|
|
|
|
|
|
|
|
|
|
|
|
|
|
|
|
|
|
|
6% |
|
|
|
|
|
|
|
|
|
|
|
|
|
|
|
|
|
|
|
|
|
|
|
|
|
|
|
|
|
|
|
|
|
|
|
|
|
|
|
|
|
|
|
|
|
|
|
|
|
|
|
|
|
|
|
|
Organic Sales Growth |
|
|
|
|
|
|
|
|
|
|
|
|
|
|
|
||||||
|
|
|
|
|
|
|
|
|
|
|
|
|
|
|
|
|
|
|
|
|
|
|
|
|
|
|
|
|
|
|
|
|
|
|
|
|
|
|
|
|
|
|
|||||||||
50% |
|
|
|
|
|
|
|
|
|
|
|
|
|
|
|
|
|
|
|
|
|
|
|
|
5% |
|
|
|
|
Organic Volume Growth |
|
|
|
|
|
|
|
|
|
|
|
|
|
|
|
||||||
|
|
|
|
|
|
|
|
|
|
|
|
|
|
|
|
|
|
|
|
|
|
|
|
|
|
|
|
|
|
|
|
|
|
|
|
|
|
|
|
|
|
|
|||||||||
|
|
|
|
|
|
|
|
|
|
|
|
|
|
|
|
|
|
|
|
|
|
|
|
|
|
|
|
|
|
|
|
|
|
|
|
|
|
|
|
|
|
|
|
|
|
|
|
|
|||
|
|
|
|
|
|
|
|
|
|
|
|
|
|
|
|
|
|
|
|
|
|
|
|
|
|
|
|
|
|
|
|
|
|
|
|
|
|
|
|
|
|
|
|
|
|
|
|
|
|||
|
|
|
|
|
|
|
|
|
|
|
|
|
|
|
|
|
|
|
|
|
|
|
|
4% |
|
|
|
|
|
|
|
|
|
|
|
|
|
|
|
|
|
|
|
|
|
|
|
|
|
||
|
|
|
|
|
|
|
|
|
|
|
|
|
|
|
|
|
|
|
|
|
|
|
|
|
|
|
|
|
|
|
|
|
|
|
|
|
|
|
|
|
|
|
|
|
|
|
|||||
|
|
|
|
|
|
|
|
|
|
|
|
Sales |
|
|
|
|
|
|
|
|
|
|
|
|
|
|
|
|
|
|
|
|
or |
|
|
|
|
|
|
|
|
|
|
|
|
|
|||||
40% |
|
|
|
|
|
|
|
|
|
|
|
Profits |
|
|
|
|
|
|
|
|
|
|
|
3% |
|
|
|
|
|
|
|
|
|
|
|
|
|
|
|
|
|
|
|
|
|||||||
|
|
|
|
|
|
|
|
|
|
|
|
|
|
|
|
|
|
|
|
|
|
|
|
|
|
|
|
|
|
|
|
|
|
|
|
|
|
|
|
|
|
|
|
|
|
|
|||||
|
|
|
|
|
|
|
|
|
|
|
|
|
|
|
|
|
|
|
|
|
|
|
|
|
|
|
|
|
|
|
|
|
|
|
|
|
|
|
|
|
|
|
|
|
|
|
|||||
|
|
|
|
|
|
|
|
|
|
|
|
|
|
|
|
|
|
|
|
|
|
|
|
|
|
|
|
|
|
|
|
|
|
|
|
|
|
|
|
|
|
|
|
|
|
|
|
|
|||
|
|
|
|
|
|
|
|
|
|
|
|
|
|
|
|
|
|
|
|
|
|
|
|
|
|
|
|
|
|
|
|
|
|
|
|
|
|
|
|
|
|
|
|
|
|
|
|
|
|||
30% |
|
|
|
|
|
|
|
|
|
|
|
|
|
|
|
|
|
|
|
|
|
|
|
|
|
|
|
|
|
|
|
|
|
|
|
|
|
|
|
|
|
|
|
|
|
|
|
|
|
||
|
|
|
|
|
|
|
|
|
|
|
|
|
|
|
|
|
|
|
|
|
|
|
|
2% |
|
|
|
|
|
|
|
|
|
|
|
|
|
|
|
|
|
|
|
|
|
|
|
|
|
||
|
|
|
|
|
|
|
|
|
|
|
|
|
|
|
|
|
|
|
|
|
|
|
|
|
|
|
|
|
|
|
|
|
|
|
|
|
|
|
|
|
|
|
|
|
|
|
|||||
20% |
|
|
|
|
|
|
|
|
|
|
|
|
|
|
|
|
|
|
|
|
|
|
|
|
|
|
|
|
|
|
|
|
|
|
|
|
|
|
|
|
|
|
|
|
|
|
|
|
|
||
|
|
|
|
|
|
|
|
|
|
|
|
|
|
|
|
|
|
|
|
|
|
|
|
|
|
|
|
|
|
|
|
|
|
|
|
|
|
|
|
|
|
|
|
|
|
||||||
|
|
|
|
|
|
|
|
|
|
|
|
|
|
|
|
|
|
|
|
|
|
|
|
|
|
|
|
|
|
|
|
|
|
|
|
|
|
|
|
|
|
|
|
|
|
|
|
|
|
|
|
10% |
|
|
|
|
|
|
|
|
|
|
|
|
|
|
|
|
|
|
|
|
|
|
|
|
1% |
|
|
|
|
|
|
|
|
|
|
|
|
|
|
|
|
|
|
|
|
|
|
|
|
|
|
|
|
|
|
|
|
|
|
|
|
|
|
|
|
|
|
|
|
|
|
|
|
|
|
0% |
|
|
|
|
|
|
|
|
|
|
|
|
|
|
|
|
|
|
|
|
|
|
|
|
|
||
0% |
|
|
|
|
|
|
|
|
|
|
|
|
|
|
|
|
|
|
|
|
|
|
|
|
|
|
|
|
|
|
|
|
|
|
|
|
|
|
|
|
|
|
|
|
|
|
|
|
|
||
|
|
|
|
|
|
|
|
|
|
|
|
|
|
|
|
|
|
|
|
|
|
|
|
|
|
|
|
|
|
|
|
|
|
|
|
|
|
|
|
|
|
|
|
|
|
|
|
|
|||
|
|
|
|
|
|
|
|
|
|
|
|
|
|
|
|
|
|
|
|
|
|
|
|
|
|
|
|
|
|
1998 |
|
|
|
1999 |
|
|
|
|
|
2000 |
|
|
|
|
|||||||
North America |
Europe, Middle East, |
|
Asia |
|
|
Latin America |
|
|
|
|
|
|
|
|
|
|
|
|
|
|
|
|
|||||||||||||||||||||||||||||
|
|
|
|
|
|
|
|
|
|
|
|
|
|
|
|
|
|
|
|
|
|
|
|
|
|
|
|||||||||||||||||||||||||
|
|
|
|
|
|
|
|
Africa |
|
|
|
|
|
|
|
|
|
|
|
|
|
|
|
|
|
|
|
|
|
|
|
|
|
|
|
|
|
|
|
|
|
|
|
|
|
|
|||||
Source: Procter & Gamble, 2000 Annual Report (Cincinnati: Procter & Gamble, 2000), |
|
Source: |
|
Casewriters’ calculations. Excludes acquisitions, divestitures and currency effects. |
|||||||||||||||||||||||||||||||||||||||||||||||
|
|
|
|
|
|
|
|
|
|
|
|
|
Post |
||||||||||||||||||||||||||||||||||||||
http://www.pg.com/investors/annualreports.jhtml, accessed March 2006

|
Procter & Gamble: Organization 2005 (A) |
|
|
|
|
Post |
||||||
|
|
|
|
|
|
707-519 |
||||||
|
Exhibit 11 Financial Comparisons with Key Competitors |
|
|
|
|
|
||||||
|
|
|
2000 Fiscal Year Income Statement (In Millions of 2000 Dollars) |
|
|
|||||||
|
|
|
|
|
Unilever |
Colgate |
|
Kimberly-Clark |
L’Oreal |
|||
|
|
|
Net Sales |
|
44,254 |
|
9,358 |
|
|
13,982 |
11,709 |
|
|
|
|
Cost of Goods Sold |
|
|
|
4,000 |
|
|
7,607 |
|
|
|
|
|
Gross Profit |
|
|
|
5,358 |
or |
6,375 |
|
|
|
|
|
|
SG&A |
|
|
|
3,300 |
3,113 |
|
|
||
|
|
|
|
|
|
|
|
|
|
|||
|
|
|
Operating Income |
|
|
|
2,058 |
|
|
3,262 |
1,780 |
|
|
|
|
Depreciation |
|
|
|
338 |
|
|
673 |
356 |
|
|
|
|
Operating Profit |
|
2,981 |
|
1,720 |
|
|
2,589 |
1,424 |
|
|
|
|
Net Interest Expense |
|
|
|
204 |
|
|
243 |
101 |
|
|
|
|
Other Non-Operating Inc (Exp) |
Copy |
73 |
|
|
275 |
-100 |
|
||
|
|
|
Special Items |
|
9 |
|
|
1 |
0 |
|
||
|
|
|
|
|
|
|
|
|
||||
|
|
|
Pre-Tax Earnings |
|
2,396 |
|
1,598 |
|
|
2,622 |
1,223 |
|
|
|
|
Income Tax Expense |
|
|
|
503 |
|
|
759 |
451 |
|
|
|
|
Minority Interest |
|
|
|
33 |
|
|
63 |
|
|
|
|
|
Earnings from Cont. Ops. |
|
1,017 |
|
1,062 |
|
|
1,800 |
954 |
|
|
|
|
|
|
2000 Fiscal Year Supplemental Items |
|
|
|
||||
|
|
|
|
|
|
|
|
|
|
|
||
|
|
|
|
|
Unilever |
Colgate |
|
Kimberly-Clark |
L’Oreal |
|||
|
|
|
Advertising Expense |
|
6,144 |
|
551 |
|
|
349 |
ND |
|
|
|
|
R&D Expense |
|
1,114 |
|
176 |
|
|
277 |
360 |
|
|
|
|
Capital Expenditures |
|
1,249 |
|
367 |
|
|
1,170 |
444 |
|
|
|
|
Employees |
|
261,000 |
38,300 |
|
|
66,300 |
48,200 |
|
|
|
|
|
Not |
Average Rates of Growth, 1999 and 2000 Fiscal Years |
|
|
||||||
|
|
|
|
|
|
|||||||
|
|
|
|
|
|
|
|
|
|
|
||
|
|
|
|
|
Unilever |
Colgate |
|
Kimberly-Clark |
L’Oreal |
|||
|
|
|
Sales Growth |
|
2% |
|
7% |
|
|
10% |
13% |
|
|
|
|
Volume Growth |
|
2% |
|
6% |
|
|
9% |
ND |
|
|
Source: Procter & Gamble Annual Reports. |
|
|
|
|
|
|
|
||||
Do |
|
|
|
|
|
|
|
|
|
|
|
|
|
|
|
|
|
|
|
|
|
|
19 |
||
|
|
|
|
|
|
|
|
|
|
|
||
This document is authorized for use only by Igor Stroganov until May 2012. Copying or posting is an infringement of copyright. Permissions@hbsp.harvard.edu or 617.783.7860.

Calvin Klein fragrances, Dove personal cleansers, Axe deodorants, I Can’tPostBelieve It’s Not Butter margarine, Slim-Fast diet foods, Q-Tips, Domestos toilet cleaner, and Vaseline petroleum jelly. Unilever
707-519 Procter & Gamble: Organization 2005 (A)
Appendix: Selected Competitors of P&G
Unilever
Unilever was founded in 1930 through a merger of a Dutch margarine company Margarine Unie
with British soap company Lever Brothers. In 2000 Unilever generated $44 billion in revenues and
employed 261,000 people, making it the second-largest consumer products company, after $50bn
Nestlé. Fifty percent of Unilever’s sales came from foods, 22 percent from home care and 26 percent
from personal care.37 Unilever managed 1600 brands, with a quarter of them generating 91 percent of
was one of the most diversified consumer-products companiesor– largely by acquiring hundreds of
revenue.38 Unilever’s products were extremely diverse, including Lipton tea, Ben & Jerry’s ice cream,
resource allocation across brands and product categories.39 Functional organizations such as manufacturing, R&D, marketing, and sales were managed regionally, and often by country, for maximum responsiveness to local needs.
small to medium-sized local companies. Unilever wanted to expand its share of revenues from developing countries from 33 percent to 50 percent by 2010. Unilever considered itself a “truly multilocal multinational,” and utilized a highly decentralized organizational structure in which geographic organizations boreCopysole responsibility for financial performance and full control over
In February 2000 Unilever announced a restructuring plan -- Path to Growth -- aimed at annual sales growth of 5 percent and operating margins of 15 percent within four years. The 1200 brands that together generated only 9 percent of revenue were to be eliminated, as were 25,000 jobs and a quarter of manufacturing plants. The remaining brands would receive additional $400 million in advertising and promotional spend in addition to $320 million that would otherwise go to the marginal brands. Supply-chain information-technology systems would be standardized and improved to optimize this new fully integrated network of manufacturing plants and distribution facilities. Purchasing was to be further automated and centralized to reduce costs. The program was expected to cost $3.2 billion through 2004, including asset writedowns. To align management with the new growth targets, performance-based pay would increase from 40 percent to 100 percent of
base pay.NotOnce this first-stage streamlining of brands and supply-chain systems was completed, further reduction in overheads would become possible through significant business simplification. Beginning in 2004, some financial processes would be consolidated into a small number of shared service centers around the world.40
To aid the new plan, Unilever unveiled its new organizational structure in April 2000. Each regional organization would be split into two divisions: foods and home and personal care (HPC). Each division would possess its own sales, marketing, and regional innovation functions. Regional presidents would retain profit responsibility but would manage the two divisions as separate entities. In pursuit of a more global focus on products and brands, each regional president would serve on either a foods or an HPC executive committee. Each executive committee would be chaired by a
Dodivisional director whose compensation would be based on global divisional performance. The R&D
and supply-chain functions would then be globally consolidated by product division. This arrangement would allow the individual foods and HPC supply chains to develop platform manufacturing and distribution solutions across regions. Large global technical centers would focus on core technologies that would ultimately be adapted regionally in smaller regional innovation centers.41 Just as Path to Growth got under way, Unilever made its largest-ever acquisition, Bestfoods, for $24.4 billion, bringing the large global brands Hellmann’s and Knorr into the fold along with an array of U.S. favorites like Skippy peanut butter and Mazola cooking oil.
20
This document is authorized for use only by Igor Stroganov until May 2012. Copying or posting is an infringement of copyright. Permissions@hbsp.harvard.edu or 617.783.7860.