

SAT 8
.pdf x
x x
x x
x
CHAPTER 8 / FUNCTIONS |
|
|
|
|
|
|
|
|
|
|
|
|
|
|
|
|
|
|
|
165 |
|||
E X A M P L E : |
|
|
|
|
|
|
|
|
|
|
|
|
|
|
|
|
|
|
|
|
|
||
Evaluate arcsin |
|
2 |
. |
|
|
|
|
|
|
|
|
|
|
|
|
|
|||||||
|
|
|
|
|
|
|
|
|
|
|
|
|
|
|
|||||||||
|
2 |
|
|
|
|
|
|
|
|
|
|
|
|
|
|||||||||
The arcsin |
|
2 |
represents the angle whose sine is |
2 |
. |
|
|
|
|
|
|||||||||||||
|
|
|
|
|
|
|
|
|
|||||||||||||||
|
2 |
|
2 |
|
|
|
|
|
|||||||||||||||
Because sin |
|
π |
|
= |
|
2 |
, arcsin |
|
2 |
= |
π |
. |
(Answer) |
|
|
|
|
|
|||||
4 |
|
2 |
|
|
2 |
|
|
|
|
|
|
||||||||||||
|
|
|
|
|
|
|
|
4 |
|
|
|
|
|
|
|
|
|
||||||
E X A M P L E : |
|
|
|
|
|
|
|
|
|
|
|
|
|
|
|
|
|
|
|
|
|
||
Evaluate arcsin(sin π). |
|
|
|
|
|
|
|
|
π |
|
π |
|
|||||||||||
arcsin(sin y) = y is only valid for values of y in the interval |
− |
≤ y ≤ |
. |
||||||||||||||||||||
|
2 |
||||||||||||||||||||||
|
|
|
|
|
|
|
|
|
|
|
|
|
|
|
|
|
|
2 |
|
|
|||
π does not lie within the range of the arcsine function, but sin π = 0. |
|
|
|||||||||||||||||||||
arcsin(sin π) = arcsin(0) = 0. |
|
|
|
|
|
|
|
|
|
|
|
|
|||||||||||
arcsin(sin π) = 0. |
|
|
(Answer) |
|
|
|
|
|
|
|
|
|
|
|
|
||||||||
E X A M P L E : |
|
|
|
|
|
|
|
|
|
|
|
|
|
|
|
|
|
|
|
|
|
||
Evaluate tan(arctan 4). |
|
|
|
|
|
|
|
|
|
|
|
|
|||||||||||
The domain of tan(arctan x) = x is the set of all real numbers, so: |
|
|
|||||||||||||||||||||
tan(arctan 4) = 4. |
|
|
(Answer) |
|
|
|
|
|
|
|
|
|
|
|
|||||||||
E X A M P L E :
Evaluate sin(arcos 45 ).
This is asking for the sine of the angle whose cosine is 45 . Think about a
right triangle in quadrant I whose hypotenuse measures 5 and whose leg adjacent to the given angle measures 4.
The sine of the angle is |
3. |
(Answer) |
|
5 |
|
*PERIODIC FUNCTIONS
A function is periodic if for every x in its domain there is some constant c such that:
f (x + c) = f (x).
The smallest value of c is the period of the function. The sine and cosine functions, for example, are periodic and have a period of 2π.
166 |
PART II / MATH REVIEW |
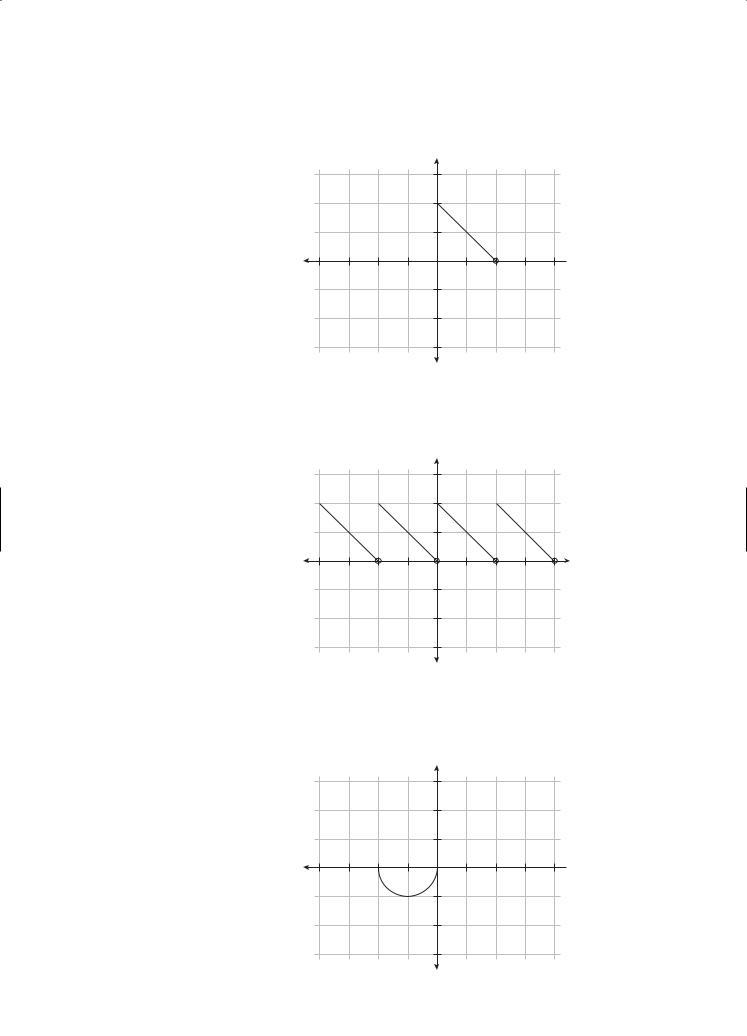
E X A M P L E :
Part of the graph of a function f having period 2 is shown below. Sketch the graph of f on the interval −4 ≤ x ≤ 4.
y
2
 x
x
–2
The given part of the graph represents one period. Repeat the graph to the right and left until you reach 4 and −4, respectively. The resulting graph is:
y |
2 |
x |
–2 |
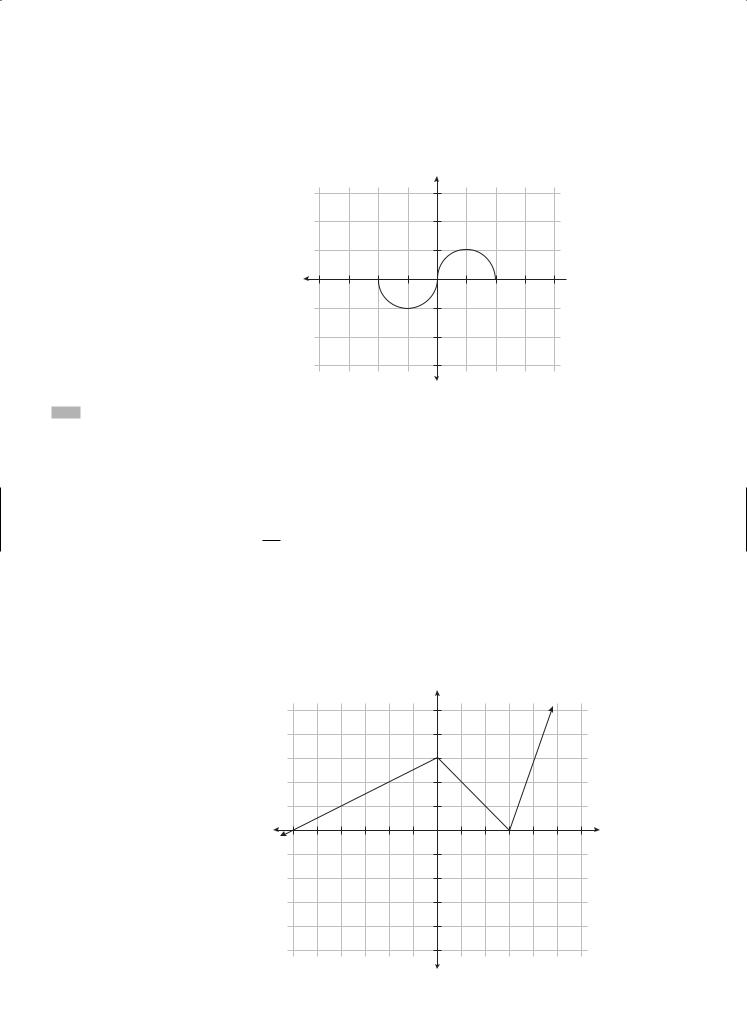
E X A M P L E :
Part of the graph of a function f having period 2 is shown below. Sketch the graph of f on the interval −2 ≤ x ≤ 2 given that the function is odd.
y
2
 x
x
–2
 x
x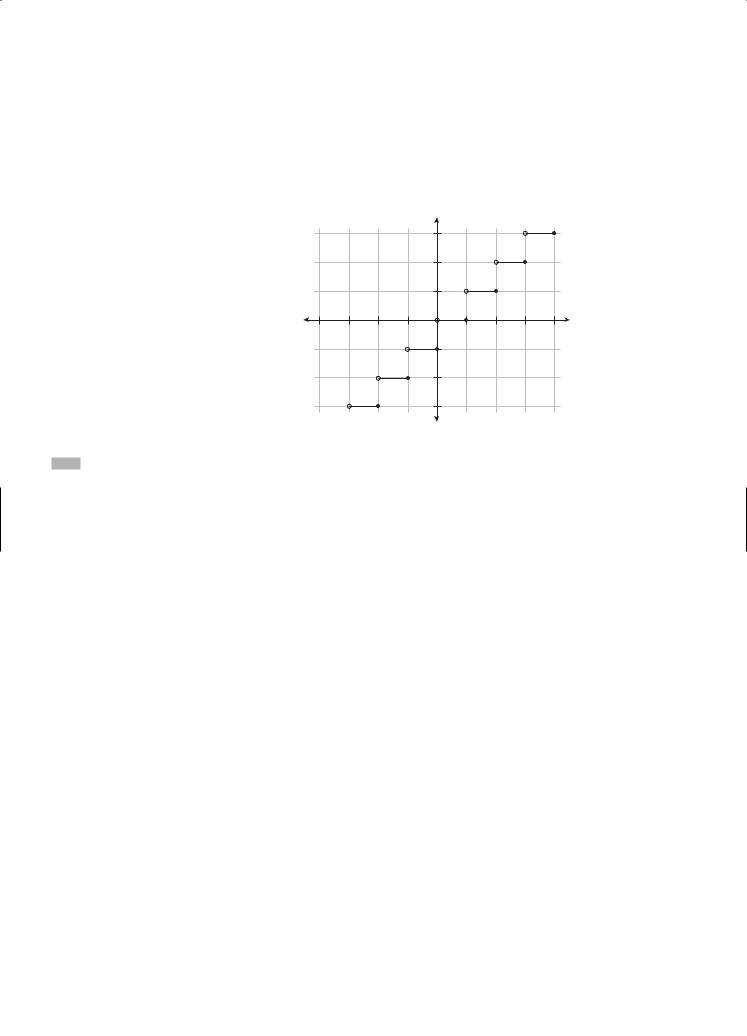
168 |
PART II / MATH REVIEW |
The greatest integer function, f (x) = [x], is another example of a piecewise function. f (x) equals the greatest integer less than or equal to x. f (1.5) = [1.5] = 1. f (−0.5) = [−0.5] = −1. The graph of the f (x) = [x] jumps up one unit at each integer and is a horizontal segment between consecutive integers. Because of its vertical breaks, the greatest integer function is also called a step function. Its graph is as follows:
y |
2 |
x |
–2 |
*RECURSIVE FUNCTIONS
A recursive function defines the terms in a sequence by relating each term to the previous ones.
The Fibonacci Sequence 1, 1, 2, 3, 5, 8, 13, . . . can be defined recursively as:
an = an− 2 + an−1 where n ≥ 2, a0 = 1 and a1 = 1.
A factorial can also be thought of as being recursive because n! = 1 × 2 × 3 × 4 . . . (n − 1) × n. In other words, n! = (n − 1)! × n.
E X A M P L E :
If fn = 2fn−1 + 3 for n = 2, 3, 4, . . . and f1 = 3, then what is f4?
Start by looking at the pattern formed by consecutive terms.
f1 |
= 3 |
|
f2 |
= 2f1 + 3 = 2(3) + 3 = 9. |
|
f3 |
= 2f2 |
+ 3 = 2(9) + 3 = 21. |
f4 |
= 2f3 |
+ 3 = 2(21) + 3 = 45. |
f4 |
= 45. |
(Answer) |

CHAPTER 8 / FUNCTIONS |
169 |
E X A M P L E :
If fn + 1 = fn−1 + 3fn for n = 2, 3, 4, . . . and f1 = 1 and f2 = 2, then what is f5?
Because you are given the first two terms of the sequence, you can define the other terms using these.
f1 |
= 1. |
|
f2 |
= 2. |
|
f3 |
= f1 + 3f2 |
= 1 + 3(2) = 7. |
f4 |
= f2 + 3f3 |
= 2 + 3(7) = 23. |
f5 |
= f3 + 3f4 |
= 7 + 3(23) = 76. |
f5 |
= 76. |
(Answer) |
*PARAMETRIC FUNCTIONS
The content in this chapter has focused on graphs involving two variables, x and y, but it is also possible to express x and y in terms of a third variable. This third variable is called a parameter. Examples of parametric equations are as follows:
x = 12t.
y = −2t2 + 12t.
Substituting values for the parameter results in ordered pairs (x, y), which are points on the graph of the function. A curve represented by a pair of parametric equations is still plotted in an xy-coordinate plane. Plotting points as t increases gives the curve in a certain direction, which is called its orientation.
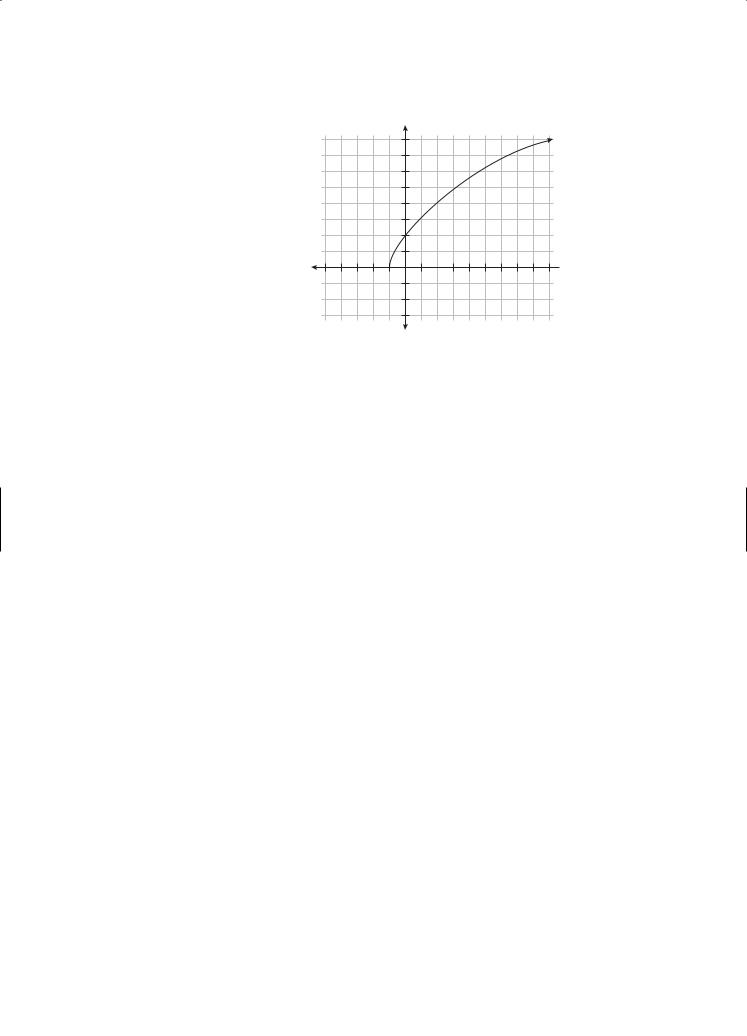
E X A M P L E :
Graph the curve determined by the parametric equations x = t2 − 1 and y = 3t on the interval 0 ≤ t ≤ 4.
Substitute values of t to determine points on the curve.
t |
0 |
1 |
2 |
3 |
4 |
|
|
|
|
|
|
x |
−1 |
0 |
3 |
8 |
15 |
|
|
|
|
|
|
y |
0 |
3 |
6 |
9 |
12 |
|
|
|
|
|
|
170 |
PART II / MATH REVIEW |
Now, plot the points in order to get the following graph:
y
8
6
4
2
 x
x
–5 |
5 |
–2
Parametric equations can also be graphed by finding an equation in terms of x and y that has the same graph. When eliminating the parameter, check the domain of the new function, since the resulting graph may contain points that are not on the graph of the original parametric equations.
E X A M P L E :
Eliminate the parameter and write the rectangular equation whose graph represents the parametric curve x = t2 and y = 4t2 − 1.
Substitute x = t2 into the equation for y to get:
y = 4x − 1.
The equation is linear. The domains of the original parametric equations show that x ≥ 0 and y ≥ −1, however, because squaring t always results in a positive value. The domain of the rectangular equation must be x ≥ 0.
y = 4x − 1 and x ≥ 0. |
(Answer) |

CHAPTER 9 / DATA ANALYSIS, STATISTICS, AND PROBABILITY |
173 |
E X A M P L E : |
|
Sarah has test scores of 65, 78, 81, 82, and 90. What must she score on her 6th test to maintain an average score of 80?
Let x be Sarah’s 6th test score. Because you know the average, or mean, of the data, set up an equation equal to 80 and solve for x.
80 = 65 + 78 + 81 + 82 + 90 + x . 6
80 = 396 + x .
6
480 = 396 + x.
84 = x.
Sarah must score 84 on her 6th test. |
(Answer) |
E X A M P L E :
Find the median and mode of the following distribution:
0, 0, 1, 4, 6, 8, 8, 9
The mode is the number that occurs the most. Because both 0 and 8 occur twice, each number is a mode.
The median is the middle number. Because there’s an even number of terms in the given distribution, the median cannot be one of the given terms. Instead, find the median by adding the 4th and 5th terms and dividing by two. (In essence, you’re finding the average of the two terms because the middle occurs between them.) The median is:
|
4 + |
6 |
= 5. |
|
2 |
|
|
||
|
|
|
||
The mode is 0 and 8, and the median is 5. |
(Answer) |
|||
RANGE
Range is a simple measure of data dispersion. Range is the difference between the largest and smallest data values. Take Sarah’s test scores of 65, 78, 81, 82, and 90 from one of the previous examples. The range of her scores is 25. 90 − 65 = 25.
E X A M P L E :
Given the daily high temperatures for the week are: 61°, 65°, 76°, 69°, 60°, 72°, and 69°, what is the range of the data?
The highest temperature is 76° and the lowest temperature is 60°, so the range is:
76 − 60 = 16. |
(Answer) |