

SAT 8
.pdf174 PART II / MATH REVIEW
E X A M P L E :
If the mean of the set of data 2, 5, 7, 9, 10, and x is 8, what is the range?
Since the mean is 8:
|
2 + 5 + 7 + 9 + 10 + x |
= 8 |
|
|
|
|
6 |
|
|
|
|
|
|
|
33 + x = |
48 |
|
|
|
|
x = 48 − |
33 = 15 |
|
|
The range is, therefore, 15 − 2 = 13. |
(Answer) |
|||
INTERQUARTILE RANGE
The interquartile range is most often used in box-and-whisker plots. To determine the quartiles of a given data, find three different medians: (a) the median of the entire data set, (b) the median of the lower half of the data, the lower quartile, and (c) the median of the upper half of the data, the upper quartile. The interquartile range is the difference between the upper and lower quartile data values.
E X A M P L E :
Thirteen students receive the following grades on a math test: 60, 78, 90, 67, 88, 92, 81, 100, 95, 83, 83, 86, 74
What is the interquartile range of the test scores?
Start by arranging the test scores in order of lowest to highest: 60, 67, 74, 78, 81, 83, 83, 86, 88, 90, 92, 95, 100
The median of the data is 83. To find the interquartile range, find the lower quartile by determining the median of the data to the left of the median, 83. Then, find the upper quartile by determining the median of the data to the right of the median, 83.
Lower quartile = |
74 + 78 |
= 76. |
|
2 |
|
||
|
|
|
|
Upper quartile = |
90 + 92 |
= 91. |
|
2 |
|
||
|
|
|
|
The interquartile range is 91 − 76 = 15. |
(Answer) |
||
*STANDARD DEVIATION
Standard deviation is another measure of data dispersion. A deviation is the difference between a data value and the mean of the data set. The standard deviation is given by the formula:
σ = sum of the squares of the deviations from the mean number of terms in the data set

CHAPTER 9 / DATA ANALYSIS, STATISTICS, AND PROBABILITY |
175 |
E X A M P L E : |
|
What is the standard deviation of the following distribution: 8, 11, 11, 13, 14, 15?
The mean of the data is:
8 + 11 + 11 + 13 + 14 + 156 = 726 = 12.
Now, determine how much each score differs from the mean. Substitute theses deviations into the standard deviation formula to get:
σ = |
(−4)2 |
+ (−1)2 + (−1)2 + 12 + 22 + 32 |
= 5.33. |
|
6 |
||
|
|
|
|
σ = 2.3. |
(Answer) |
|
|
E X A M P L E :
If each score in a set of scores is increased by 5, which of the following would be true statements?
I.The mean is increased by 5.
II. The mean is unchanged.
III. The standard deviation is increased by 5.
IV. The standard deviation is unchanged.
(A)I only
(B)III only
(C)I and III only
(D)II and IV only
(E)I and IV only
Because each score is increased by 5, the mean would also increase by 5. Statement I is, therefore, true. The difference of each of the terms in the new data set from the new mean is unchanged, however. The standard deviation remains unchanged. I and IV are true statements, so Answer E is the correct choice.
DATA INTERPRETATION
Data interpretation problems involve reading data from various graphs and plots, such as histograms, pie charts, frequency distributions, bar graphs, and other types of data displays.

CHAPTER 9 / DATA ANALYSIS, STATISTICS, AND PROBABILITY |
177 |
E X A M P L E :
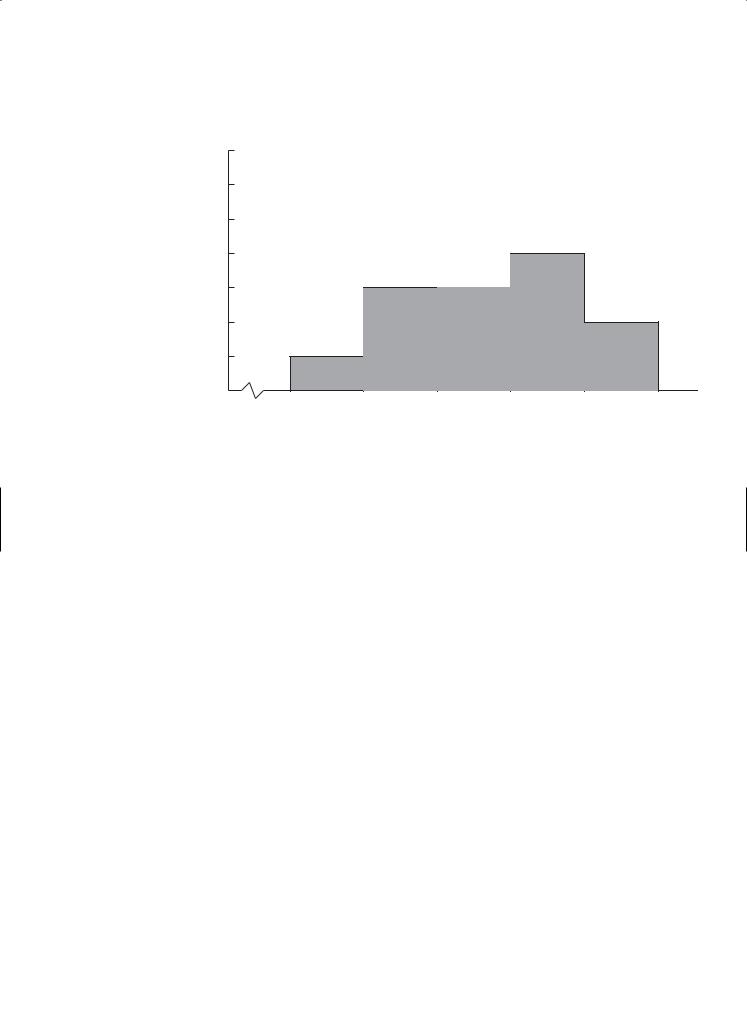
The frequency distribution of the average daily temperatures in June is shown below. Determine the mean temperature. Round your answer to the nearest integer.
Temperature |
Frequency |
|
|
59 |
2 |
|
|
60 |
5 |
|
|
61 |
6 |
|
|
62 |
6 |
|
|
63 |
5 |
|
|
64 |
3 |
|
|
65 |
2 |
|
|
66 |
1 |
|
|
The mean is the sum of all the temperatures divided by the total number of days in question. Adding up the frequencies results in:
2 + 5 + 6 + 6 + 5 + 3 + 2 + 1 = 30 days.
June actually has 30 days, so this number makes sense. Now find the sum of the 30 given temperatures and divide by 30.
59(2) + 60(5) + 61(6) + 62(6) + 63(5) + 64(3) + 65(2) + 66(1)
30
= 1,859 30
≈ 61.97
62 degrees. (Answer)
REGRESSION
Three different regressions are included on the Level 2 test: Linear, Quadratic, and Exponential. In regression problems, you are asked to determine the model that best fits a set of data. Linear models are in the form: y = ax + b. Quadratic models are in the form: y = ax2 + bx + c. Lastly, exponential models are in the form: y = abx.
All three can be determined by using the LinReg, QuadReg, and ExpReg functions under STAT—CALC on your TI graphing calculator.


180 |
PART II / MATH REVIEW |
Then, find the equation of the parabola of best fit by pressing STAT, CALC, 5 QuadReg, and ENTER. Your screen should show the following: (Here it is rounded to 2 decimal places.)
QuadReg
y = ax2 + bx + c a = .03
b = −5.17 c = 223.55
The quadratic model for the data is y = 0.03x2 − 5.17x + 223.55. |
(Answer) |
Again, although it was not asked in this problem, you can graph the parabola and the scatter plot to check your equation. Press Y=, VARS, 5 Statistics, >, >, and 1 RegEQ to enter the regression equation. Then, press 2nd STAT PLOT, 1, ENTER to turn on Plot 1 and select L1 as Xlist and L2 as Ylist. Press GRAPH to display both the scatter plot and the parabola of best fit. (Press ZOOM 9 to automatically adjust the window to the data entered.)
*Exponential Regression
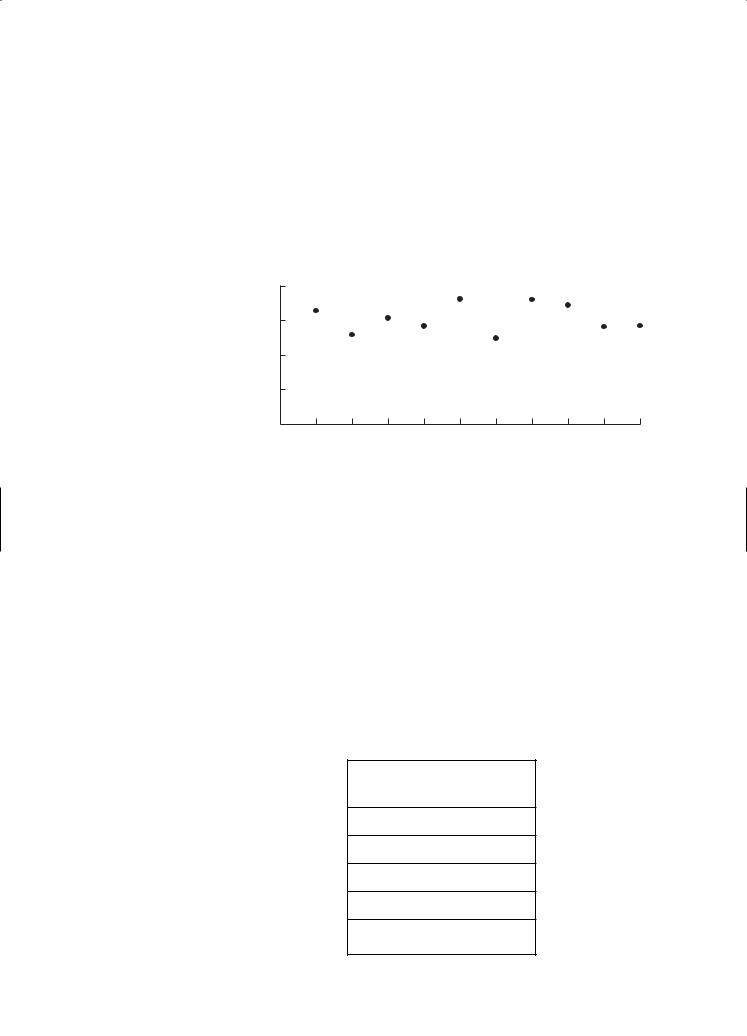
The exponential regression model, is the exponential curve, y = abx, that best represents the relationship between the data sets in a scatter plot. Let’s use the ExpReg feature of your TI graphing calculator to find the exponential equation that best represents the given data.
E X A M P L E :
Find the exponential function that best fits the data in the table below.
x |
0 |
1 |
2 |
3 |
4 |
5 |
y |
3 |
3.3 |
3.7 |
4.5 |
5.2 |
6.4 |
First, enter the data into List 1 and List 2 of your calculator. Press STAT, ENTER and enter the x values in L1 and the y values in L2.
Then, find the equation of the exponential curve of best fit by pressing STAT, CALC, 0 ExpReg, and ENTER. Your screen should show the following: (Here it is rounded to 2 decimal places.)
ExpReg
y = a*b^ x a = 2.87 b = 1.17
The exponential model for the data is y = 2.87(1.17)x. |
(Answer) |

CHAPTER 9 / DATA ANALYSIS, STATISTICS, AND PROBABILITY |
181 |
You can graph the exponential curve and the scatter plot to check your equation. Press Y =, VARS, 5 Statistics, >, >, and 1 RegEQ to enter the regression equation. Then, press 2nd STAT PLOT, 1, ENTER to turn on Plot 1 and select L1 as Xlist and L2 as Ylist. Press GRAPH to display both the scatter plot and the best-fitting exponential function. (Press ZOOM 9 to automatically adjust the window to the data entered.)
PROBABILITY
An experiment is an occurrence in which you do not necessarily get the same results when it is repeated under similar conditions. The sample space is the set of all possible outcomes of an experiment. When you toss a coin, the possible outcomes are heads, H, or tails, T. The sample space of a coin toss is written as {H, T}. The sample space for rolling a die, for example, is {1, 2, 3, 4, 5, 6}. An event is a set of outcomes and is a subset of the sample space.
If all outcomes are equally likely, the probability that an event, E, occurs is:
P(E) = the number of possible outcomes of E . the total number of possible outcomes
E X A M P L E :
Two dice are rolled. Find the probability that the sum of the two numbers is less than 4.
When the two dice are rolled there are: 6 × 6 = 36 total possible outcomes.
The sum of the two dice must, however, be less than 4. If the first die is a 1, the second could be 1 or 2. If the first die is 2, the second die could be a 1. If the first die is a 3, 4, 5, or, 6, there are no possibilities that the second roll will result in a sum of less than 4. The possible outcomes are therefore:
{(1, 1), (1, 2), (2, 1)}
The probability is the total number of = 363 = 121 . possible outcomes
121 . (Answer)

182 |
PART II / MATH REVIEW |
E X A M P L E :
The are 12 pieces of colored chalk in a package—3 white, 3 yellow, 3 orange, and 3 green. If two pieces are selected at random, find the probability that both will be yellow.
The probability of choosing the first yellow piece of chalk is:
P(Y1 ) = 123 = 14
Once one piece is chosen, there are only 11 pieces left in the package. The probability of choosing the second piece of yellow chalk is:
P(Y2 ) = 112
The answer is therefore: |
1 |
|
2 |
= |
2 |
= |
1 |
||||
|
|
|
|
|
|
||||||
4 |
|
44 |
22 |
||||||||
|
|
|
|
|
11 |
|
|
||||
|
1 |
. |
(Answer) |
|
|
|
|
|
|
|
|
22 |
|
|
|
|
|
|
|
|
|||
|
|
|
|
|
|
|
|
|
|
||
Notice that in the previous problem the first piece of chalk is not replaced before the second is drawn. This decreases the total number of outcomes to 11 when the second piece of chalk is selected.
E X A M P L E :
The probability of passing this week’s math test is 70%, and the probability of passing this week’s English test is 80%. What is the probability of failing both tests?
To get the probability that an event will NOT occur, subtract the probability that the event will occur from 1.
The probability of not passing this week’s math test is: 1 − 70% = 30%. The probability of not passing this week’s English test is: 1 − 80% = 20%.
Notice that these are independent events, meaning that passing the math test is not dependent on how you do on the English test and vice versa. Multiply the probability of not passing both tests to get:
30%(20%) = 6%
6%. (Answer)
