

дарья михална / ISO_7730_2005
.pdfISO 7730:2005(E)
Key
PMV predicted mean vote
PPD predicted percentage dissatisfied, %
Figure 1 — PPD as function of PMV
The PPD predicts the number of thermally dissatisfied persons among a large group of people. The rest of the group will feel thermally neutral, slightly warm or slightly cool. The predicted distribution of votes is given in Table 2.
Table 2 — Distribution of individual thermal sensation votes for different values of mean vote
PMV |
PPD |
|
|
Persons predicted to vote a |
|
|
|
|
|
% |
|
|
|
|
|
|
|
|
|
0 |
−1, 0 or +1 |
−2, −1, 0, +1 or +2 |
|
|
|
|
|
|
|
+2 |
75 |
5 |
25 |
70 |
|
+1 |
25 |
30 |
75 |
95 |
|
+0,5 |
10 |
55 |
90 |
98 |
|
0 |
5 |
60 |
95 |
100 |
|
−0,5 |
10 |
55 |
90 |
98 |
|
−1 |
25 |
30 |
75 |
95 |
|
−2 |
75 |
5 |
25 |
70 |
|
|
|
|
|
|
|
a Based on experiments involving 1 300 subjects.
© ISO 2005 – All rights reserved |
5 |
ISO 7730:2005(E)
6 Local thermal discomfort
6.1General
The PMV and PPD express warm and cold discomfort for the body as a whole. But thermal dissatisfaction can also be caused by unwanted cooling or heating of one particular part of the body. This is known as local discomfort. The most common cause of local discomfort is draught (6.2). But local discomfort can also be caused by an abnormally high vertical temperature difference between the head and ankles (6.3), by too warm or too cool a floor (6.4), or by too high a radiant temperature asymmetry (6.5). Annex A provides examples of local and overall thermal comfort requirements for different categories of environment and types of space.
It is mainly people at light sedentary activity who are sensitive to local discomfort. These will have a thermal sensation for the whole body close to neutral. At higher levels of activity, people are less thermally sensitive and consequently the risk of local discomfort is lower.
6.2Draught
The discomfort due to draught may be expressed as the percentage of people predicted to be bothered by draught. Calculate the draught rate (DR) using Equation (6) (model of draught):
DR = (34 −ta,l )( |
|
a,l −0,05)0,62 (0,37 |
|
a,l Tu +3,14) |
(6) |
|
v |
v |
|||||
For va,l < 0,05 m/s: |
use va,l = 0,05 m/s |
|
||||
For DR > 100 %: |
use DR = 100 % |
|
||||
where
ta,l is the local air temperature, in degrees Celsius, 20 °C to 26 °C;
va,l is the local mean air velocity, in metres per second, < 0,5 m/s;
Tu is the local turbulence intensity, in percent, 10 % to 60 % (if unknown, 40 % may be used).
The model applies to people at light, mainly sedentary activity with a thermal sensation for the whole body close to neutral and for prediction of draught at the neck. At the level of arms and feet, the model could overestimate the predicted draught rate. The sensation of draught is lower at activities higher than sedentary (> 1,2 met) and for people feeling warmer than neutral. Additional information on the effect of air velocity can be found in Annex G.
6.3Vertical air temperature difference
A high vertical air temperature difference between head and ankles can cause discomfort. Figure 2 shows the percentage dissatisfied (PD) as a function of the vertical air temperature difference between head and ankles. The figure applies when the temperature increases upwards. People are less sensitive under decreasing temperatures. Determine the PD using Equation (7):
PD = |
100 |
1+ exp(5,76 −0,856 ∆ta,v ) |
Equation (7), derived from the original data using logistic regression analysis, ∆ta,v < 8 °C.
(7)
should only be used at
6 |
© ISO 2005 – All rights reserved |

ISO 7730:2005(E)
Key |
|
PD |
percentage dissatisfied, % |
∆ta,v |
vertical air temperature difference between head and feet, °C |
|
Figure 2 — Local discomfort caused by vertical air temperature difference |
© ISO 2005 – All rights reserved |
7 |

ISO 7730:2005(E)
6.4Warm and cool floors
If the floor is too warm or too cool, the occupants could feel uncomfortable owing to thermal sensation of their feet. For people wearing light indoor shoes, it is the temperature of the floor rather than the material of the floor covering which is important for comfort. Figure 3 shows the percentage dissatisfied as a function of the floor temperature, based on studies with standing and/or sedentary people.
Key |
|
PD |
percentage dissatisfied, % |
tf |
floor temperature, °C |
|
Figure 3 — Local thermal discomfort caused by warm or cold floors |
For people sitting or lying on the floor, similar values may be used. Determine the PD using Equation (8), derived from the original data using non-linear regression analysis:
PD =100 −94 exp(−1,387 +0,118 tf −0,002 5 tf2 ) |
(8) |
For longer occupancy the results are not valid for electrically heated floors.
NOTE By electrical heating, a certain heat input is provided independent of the surface temperature. A water-based heating system will not produce temperatures higher than the water temperature.
For spaces that people occupy with bare feet, see ISO/TS 13732-2.
8 |
© ISO 2005 – All rights reserved |
ISO 7730:2005(E)
6.5Radiant asymmetry
Radiant asymmetry (∆tpr) can also cause discomfort. People are most sensitive to radiant asymmetry caused by warm ceilings or cool walls (windows). Figure 4 shows the percentage dissatisfied as a function of the radiant temperature asymmetry caused by a warm ceiling, a cool wall, a cool ceiling or by a warm wall. For horizontal radiant asymmetry, Figure 4 applies from side-to-side (left/right or right/left) asymmetry, the curves providing a conservative estimate of the discomfort: no other positions of the body in relation to the surfaces (e.g. front/back) cause higher asymmetry discomfort. Determine the PD using Equations (9) to (12), as applicable.
a)Warm ceiling
PD = |
100 |
−5,5 |
1+ exp(2,84 −0,174 ∆tpr ) |
∆tpr < 23 °C
b)Cool wall
PD = |
100 |
1+ exp(6,61−0,345 ∆tpr ) |
∆tpr < 15 °C
c)Cool ceiling
PD = |
100 |
1+ exp(9,93 −0,50 ∆tpr ) |
∆tpr < 15 °C
d)Warm wall
PD = |
100 |
−3,5 |
1+ exp(3,72 −0,052 ∆tpr ) |
∆tpr < 35 °C
(9)
(10)
(11)
(12)
Equations (9) to (12) were derived from the original data using logistic regression analysis, and should not be used beyond the ranges shown above. Those for a) (warm ceiling) and for d) (warm wall) have been adjusted to account for discomfort not caused by radiant asymmetry. See Figure 4.
© ISO 2005 – All rights reserved |
9 |

ISO 7730:2005(E)
Key |
|
PD |
percentage dissatisfied, % |
∆tpr |
radiant temperature asymmetry, °C |
1Warm ceiling.
2Cool wall.
3Cool ceiling.
4Warm wall.
Figure 4 — Local thermal discomfort caused by radiant temperature asymmetry
7 Acceptable thermal environments for comfort
Thermal comfort is that condition of mind which expresses satisfaction with the thermal environment. Dissatisfaction can be caused by warm or cool discomfort of the body as a whole, as expressed by the PMV and PPD, or by an unwanted cooling (or heating) of one particular part of the body.
Due to individual differences, it is impossible to specify a thermal environment that will satisfy everybody. There will always be a percentage dissatisfied occupants. But it is possible to specify environments predicted to be acceptable by a certain percentage of the occupants.
Often it will be the same persons who are sensitive to different types of local discomfort. For instance, a person sensitive to draught may also be sensitive to local cooling caused by radiant asymmetry or by a cold floor. Such a cold-sensitive person may also more easily experience cool discomfort for the body as a whole. Therefore, the PPD, DR or PD caused by other types of local discomfort should not be added.
Due to local or national priorities, technical developments and climatic regions, a higher thermal quality (fewer dissatisfied) or lower quality (more dissatisfied) in some cases may be accepted. In such cases, the PMV and PPD, the model of draught, the relation between local thermal discomfort parameters (see Clause 6), and the expected percentage of dissatisfied people may be used to determine different ranges of environmental parameters for the evaluation and design of the thermal environment.
Examples of different categories of requirements are given in Annex A.
10 |
© ISO 2005 – All rights reserved |
ISO 7730:2005(E)
8 Non-steady-state thermal environments
8.1General
The basis for the methods given in the preceding clauses is steady-state conditions. The thermal environment is, however, often in a non-steady-state and the question arises as to whether the methods then apply. Three types of non-steady-state conditions can occur: temperature cycles, temperature drifts or ramps, and transients.
8.2Temperature cycles
Temperature cycles can occur due to the control of the temperature in a space. If the peak-to-peak variation is less than 1 K, there will be no influence on the comfort and the recommendations for steady-state may be used. Higher peak variations can decrease comfort.
8.3Temperature drifts or ramps
If the rate of temperature change for drifts or ramps is lower than 2,0 K/h, the methods for steady-state variation apply.
8.4Transients
In general, the following statements regarding transients can be made.
A step-change of operative temperature is felt instantaneously.
After an up-step in operative temperature, the new steady-state thermal sensation is experienced immediately, i.e. the PMV-PPD can be used to predict comfort.
Following a down-step in operative temperature, the thermal sensation drops at first to a level beneath the one predicted by PMV, then increases and reaches under steady-state conditions the steady-state level after approximately 30 min, i.e. the PMV-PPD predicts values that are too high for the first 30 min. The time to reach a new steady-state condition depends on the initial conditions.
9 Long-term evaluation of the general thermal comfort conditions
Different categories of general comfort may be specified as ranges for the PMV-PPD (see Annex A).
If these criteria are to be met, including extreme situations, the heatingand/or cooling capacity of any HVAC (heating, ventilation, air-conditioning) installation should be relatively high. Economic and/or environmental considerations can lead to acceptable limited time intervals during which the PMV will be allowed to stay outside the specified ranges.
By computer simulation or measurements, comfort conditions are often tested during longer periods for different types of building and/or HVAC design. The need here is to specify a characteristic value for the longterm comfort conditions for comparison of designs and performances.
For this purpose, a non-exhaustive list of methods that could be applied is presented in Annex H.
© ISO 2005 – All rights reserved |
11 |
ISO 7730:2005(E)
10 Adaptation
In determining the acceptable range of operative temperature according to this International Standard, a clothing insulation value that corresponds to the local clothing habits and climate shall be used.
In warm or cold environments, there can often be an influence due to adaptation. Apart from clothing, other forms of adaptation, such as body posture and decreased activity, which are difficult to quantify, can result in the acceptance of higher indoor temperatures. People used to working and living in warm climates can more easily accept and maintain a higher work performance in hot environments than those living in colder climates (see ISO 7933 and ISO 7243).
Extended acceptable environments may be applied for occupant-controlled, naturally conditioned, spaces in warm climate regions or during warm periods, where the thermal conditions of the space are regulated primarily by the occupants through the opening and closing of windows. Field experiments have shown that occupants of such buildings could accept higher temperatures than those predicted by the PMV. In such cases, the thermal conditions may be designed for higher PMV values than those given in Clause 6 and Annex A.
12 |
© ISO 2005 – All rights reserved |

ISO 7730:2005(E)
Annex A
(informative)
Examples of thermal comfort requirements for different categories of environment and types of space
A.1 Categories of thermal environment
The desired thermal environment for a space may be selected from among the three categories, A, B and C according to Table A.1. All the criteria should be satisfied simultaneously for each category.
Table A.1 — Categories of thermal environment
|
Thermal state of the body as a whole |
|
|
Local discomfort |
|
|
|||
|
|
|
|
|
|
|
|
|
|
|
PPD |
PMV |
|
DR |
|
|
PD |
|
|
Category |
% |
|
% |
|
% |
|
|
||
|
|
|
|
|
|
caused by |
|
|
|
|
|
|
|
|
|
|
|
|
|
|
|
|
|
|
vertical air |
|
warm or cool |
|
radiant |
|
|
|
|
|
|
|
|||
|
|
|
|
|
temperature |
|
floor |
|
asymmetry |
|
|
|
|
|
difference |
|
|
|
|
|
|
|
|
|
|
|
|
|
|
A |
< 6 |
− 0,2 < PMV < + 0,2 |
< 10 |
< 3 |
|
< 10 |
|
< 5 |
|
|
|
|
|
|
|
|
|
|
|
B |
< 10 |
− 0,5 < PMV < + 0,5 |
< 20 |
< 5 |
|
< 10 |
|
< 5 |
|
|
|
|
|
|
|
|
|
|
|
C |
< 15 |
− 0,7 < PMV < + 0,7 |
< 30 |
< 10 |
|
< 15 |
|
< 10 |
|
|
|
|
|
|
|
|
|
|
|
Each category prescribes a maximum percentage dissatisfied for the body as a whole (PPD) and a PD for each of the four types of local discomfort. Some requirements are difficult to meet in practice while others are quite easily met. The different percentages express a balance struck between the aim of a few dissatisfied and what is practically obtainable using existing technology.
Owing to the accuracy of instrumentation for measuring the input parameters, it can be difficult to verify that the PMV conforms to the Class A category (−0,2 < PMV < +0,2). Instead, the verification may be based on the equivalent operative temperature range, as specified in A.2 and in Table A.5.
The three categories presented in Table A.1 apply to spaces where persons are exposed to the same thermal environment. It is an advantage if some kind of individual control of the thermal environment can be established for each person in a space. Individual control of the local air temperature, mean radiant temperature or air velocity can contribute to balancing the rather large differences between individual requirements and consequently can lead to fewer dissatisfied.
Modification of the clothing can also contribute to balance individual differences. The effect on the optimum operative temperature of adding or removing different garments is described in Table C.2.
A.2 Operative temperature range
For a given space there exists an optimum operative temperature corresponding to PMV = 0, depending on the activity and the clothing of the occupants. Figure A.1 shows the optimum operative temperature and the permissible temperature range as a function of clothing and activity for each of the three categories. The optimum operative temperature is the same for the three categories, while the permissible range around the optimum operative temperature varies.
© ISO 2005 – All rights reserved |
13 |
ISO 7730:2005(E)
The operative temperature at all locations within the occupied zone of a space should at all times be within the permissible range. This means that the permissible range should cover both spatial and temporal variations, including fluctuations caused by the control system.
Figure A.1 applies for a relative humidity of 50 %; however, in moderate environments the air humidity has only a modest impact on the thermal sensation. Typically, a 10 % higher relative humidity and a 0,3 °C higher operative temperature are perceived as being warmer in equal measure.
The PDs in Table A.1 are not additive. In practice, a higher or lower number of dissatisfied persons may be found when using subjective questionnaires in field investigations (see ISO 10551).
The air velocity in the space is assumed to be < 0,1 m/s. The relative air velocity, var, caused by body movement is estimated to be zero for a metabolic rate, M, less than 1 met and var = 0,3 (M − 1) for M > 1 met. The diagrams are determined for a relative humidity = 50 %, but the humidity only has a slight influence on the optimum and permissible temperature ranges.
A.3 Local thermal discomfort
Figure A.2 give ranges for local thermal discomfort parameters for the three categories presented in Table A.1.
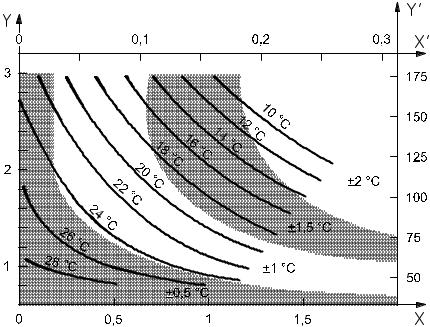
The max. allowable mean air velocity is a function of local air temperature and turbulence intensity. The turbulence intensity may vary between 30 % and 60 % in spaces with mixed-flow air distribution. In spaces with displacement ventilation or without mechanical ventilation, the turbulence intensity may be lower.
Category A: PPD < 6 %
14 |
© ISO 2005 – All rights reserved |