
Thermal Analysis of Polymeric Materials
.pdf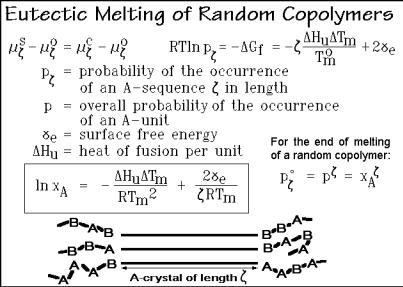
7.2 Melting Transitions of Copolymers |
727 |
___________________________________________________________________
equivalent to RT ln x1 in Fig. 2.26 is replaced by RT ln p . The mole fraction of the low-molar-mass component, x1, is the probability of occurrence of component 1 in solution. Similarly, p is the probability of the occurrence of a crystallizable sequence of A-units of length . This probability must take cognizance that any sequence of length or longer contributes to p . In addition, the heat of fusion must be adjusted to Hu to account for the full sequence. Finally, one must add the surface free energy 2 e to account for the termination of the crystal on both ends of the crystallized sequence. The lateral surface of the crystal is considered small, and has been neglected. The crystal would then take the shape given by the sketch of Fig. 7.23. The ends of the crystallized sequence can be either of type A or B, as shown.
Fig. 7.23
In Fig. 7.24 the equilibrium weight fractions of crystallinity of length , w , are displayed, calculated from the top right equation of Fig. 7.23 with parameters approximating polyethylene. The dotted line represents a random distribution of sequences assuming equal sizes for A and B (molar and weight fractions xA = 0.9). As soon as the equilibrium line crosses the dotted line, at *, the longer sequences may crystallize and reduce their concentration in the melt, as marked by the shading for the curve representing the crystallization temperature of 339.4 K.
At a sufficiently low temperature, at the eutectic, all A-sequences have been sorted into separate crystals for complete crystallization of all A-units. At the end of melting, at the liquidus line, the concentration in the melt must be equal to the initial sequencedistribution, w o, as obtained on polymerization. If this distribution is random, as shown in Fig. 3.46, the simple correlation given in Fig. 7.23 holds, and the boxed equation can be derived. At the liquidus line, a remaining trace of an extended chain crystal of a long sequence of A-units is in equilibrium with the solution. For the example of Fig. 7.24 this temperature is 368.9 K.

728 7 Multiple Component Materials
___________________________________________________________________
Fig. 7.24
In most copolymers the fraction of large sequences is small, and in addition, long sequences would chain-fold and not reach equilibrium. The calculated end of melting of a copolymer, if measurable at all, would thus have to be corrected for chain folding by typically 10 20 K (see Fig. 2.90).
The difficulty to reach equilibrium is further illustrated in Fig. 7.25. The change of the concentration of sequences of crystallizable A-units is calculated by following
Fig. 7.25
7.2 Melting Transitions of Copolymers |
729 |
___________________________________________________________________
the isothermal kinetics, as is derivable from irreversible thermodynamics in Sect. 2.4 with dp /dt = L G /T when disregarding the retardations due to any type of nucleation described in Sect. 3.5. In the initial time interval that leads to t1, all sequences longer than * are beginning to crystallize, but initially not necessarily to a crystal matching their length. The crystallization to a smaller crystal, but larger than
*, is faster and may create one or two short A-ends. This partial crystallization distorts the concentration of the uncrystallized sequences. At time t2, crystallization has progressed to equilibrium up to the length 34. Overall, the approach to equilibrium takes the shape of a wave approaching w e. It is obvious that the process of readjustment of sequence-distributions will be arrested long before equilibrium is reached, leaving a large concentration of crystallizable ends in the melt. Experimental detection of these chain ends will be shown below.
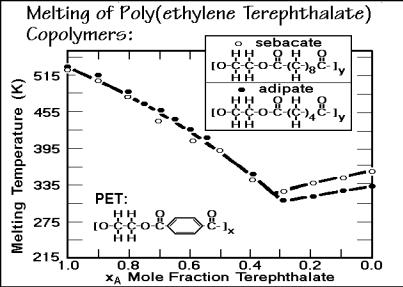
Sets of data for the liquidus line of poly(ethylene terephthalate-co-sebacate) and poly(ethylene terephthalate-co-adipate) are shown in Fig. 7.26. Because of the greater lengths of the repeating units, both components crystallize and the qualitative appearance of the melting-end temperatures is that of a eutectic phase diagram. As in homopolymer crystallization, however, there is little chance that equilibrium is reached. The equilibrium melting of poly(ethylene terephthalate) occurs at 553 K, not at 515 K. At best, the liquidus line and the corresponding eutectic point refer to zero- entropy-production conditions and additional internal variables have to be known to describe the system and account for the lowering of the liquidus line to the eutecticlike temperature (see Sect. 2.4).
Fig. 7.26
The melting-point lowering in ideal solutions is caused solely by the entropy of mixing. For copolymers, it has additional restrictions due to small crystal sizes and chain folding. Often this additional reduction of the melting point is larger than the
730 7 Multiple Component Materials
___________________________________________________________________
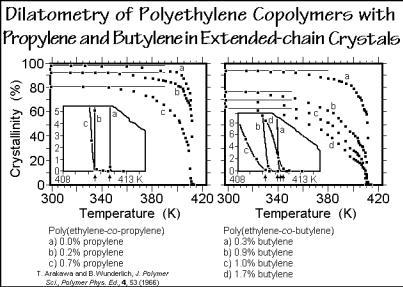
mixing effect. Furthermore, the demixing on crystallization is usually incomplete. The B-units rejected by the A-crystals do not mix fully with the surrounding melt, but accumulate at the interface, causing a change in the entropy of mixing on fusion, as is also seen from the sketch in Fig. 7.23. Figure 7.27 shows an example of the end of melting of poly(ethylene-co-propylene)s and poly(ethylene-co-butene)s, crystallized to the extended-chain morphology under elevated pressure to eliminate the chainfolding effect. The crystallinities of these copolymers decrease strongly with the comonomer concentration, given in side-groups per 100 chain atoms. The temperature of the melt end, however, seems not to change from the base polymer. All seven samples melt at 411.2 K ±0.6 K. This observation suggests that the mixing process either does not occur at all, or is decoupled from the melting (melting is governed by a local equilibrium without major changes in the concentration in the melt).
Fig. 7.27
More complicated is the description of the melting of copolymers with full or partial isomorphism or isodimorphism (Sect. 5.1.10). The changes in concentration in the mixed crystals as well as the melt must be considered and the change of the lattice energy with cocrystallization must be known. The simplest description assumes that there is no difference in concentration between melt and crystal, and there is a linear change of the heat of fusion, Hd, with concentration. This leads to: Tm = [1 xB( Hd/ Hu)]Tmo, where Hu is the heat of fusion per repeating unit of the homopolymer.
Figure 7.28 illustrates a solid solution of poly(ethylene terephthalate-co- isophthalate). The liquidus curve is taken at the end of melting and the solidus curve was calculated from the changes in lattice spacings with temperature and concentration of the comonomer. The minimum in the phase diagram corresponds to the change in crystal structure from terephthalate to isophthalate.

7.2 Melting Transitions of Copolymers |
731 |
___________________________________________________________________
Fig. 7.28
Cold crystallization is the third possible crystallization mode for copolymers. Crystallization occurs at sufficiently low temperature so that the mobility of the repeating units can align only the smallest crystals that are stable at this large distance from the melting temperature. In Fig. 7.29 cold crystallization is modeled in two dimensions with 12 chains that have been moved into register. Crystallization is only possible by neighboring sequences of two or more A-units, indicated by the shading.
Fig. 7.29

732 7 Multiple Component Materials
___________________________________________________________________
The example had a fraction of A-units, wA, of 0.5. It is quite obvious that small deviations from randomness can drastically influence the crystallinity. Besides finding an overall limit of the crystallinity, it is also possible to evaluate the sizeand shape-distribution of the crystals, as well as the surface areas. In reverse, a measured melting curve can be used to fit these parameters as long as the melting occurs under zero-entropy-production conditions, outlined in Sect. 2.4.
Figure 7.30 illustrates the limits from equilibrium to cold crystallization. They are based on a computer calculation for three-dimensional cold crystallization. It is assumed in this case that sequences of less than three A-units do not crystallize, and that at least two out of the four neighboring chains must match the sequence of three repeating units to make the central sequence crystalline. If all four lateral neighbors are crystalline, the repeating unit is in the interior of the crystal, if only three are crystalline, it is on the surface, and if only two are crystalline, it is part of an edge. With this critical sequence length and two surface free energies, experimental data of poly(ethylene terephthalate-co-sebacate) can be discussed, as is shown in Fig. 7.31. The experimental phase diagram of the same copolymer, but after slower cooling, is displayed in Fig. 7.26.
Fig. 7.30
With this brief summary of some basic descriptions of copolymer systems, it is clear that beyond concentration, detailed structural and thermodynamic information is needed for a full description. As seen in Chap. 6, semicrystalline polymers are globally nonequilibrium systems. Local equilibria may determine the premelting behavior and give information about the crystal morphology and crystallization history. Since copolymers crystallize less than the corresponding homopolymers, the defect structure is of overriding importance and the possible decoupling from the demixing produces additional, arrested internal parameters.

7.2 Melting Transitions of Copolymers |
733 |
___________________________________________________________________
Fig. 7.31
7.2.2. Applications
In this section, copolymers of polyethylene are discussed, starting with low-density, branched polyethylene and culminating with crystallization, melting, and annealing of poly(ethylene-co-octene-1), also described as linear-low-density polyethylene, LLDPE. Furthermore, partial phase diagrams of poly(ethylene terephthalate-co- oxybenzoate), PETcoOB, and poly(oxybenzoate-co-oxynaphthoate), POBcoON, are presented. The latter systems are examples of increasing chain stiffness by cocrystallization which leads to mesophase behavior (see Sect. 5.5).
LLDPE. Figure 7.32 displays results of an early study of the change in the crystals of branched, low-density polyethylene as a function of branch content (see Fig. 1.22). The X-ray data of a number of copolymers in Fig. 5.35 revealed limited isomorphism of the polyethylene crystals for a number of branch types. In accord with these data, the unit cell volume in Fig. 7.32 increases with branch content. The low-angle X-ray data indicate a gradual decrease of the long period. The lamellar crystal thickness can be separated from the long period with help of the crystallinity information in Fig. 7.33. All of these changes in volume and length should be compared to the average sequence length of crystallizable CH2-groups, also shown in Fig. 7.32. It decreases rather rapidly with increasing number of branches. The discrepancy between the average sequence length and crystal thickness can be brought into accord by considering the decrease in crystallinity (which suggests increasingly only less prominent longer CH2-sequences crystallize) and the isomorphism (which suggests increasing numbers of branches are included in the crystals).
The plot on the right of Fig. 7.32 proves that only occasional branches can be included into the crystals. Next, the defect concentration in the crystals was calculated, assuming that 2g1 kinks cause the change in the unit cell volume (see

734 7 Multiple Component Materials
___________________________________________________________________
Fig. 7.32
Fig. 7.33
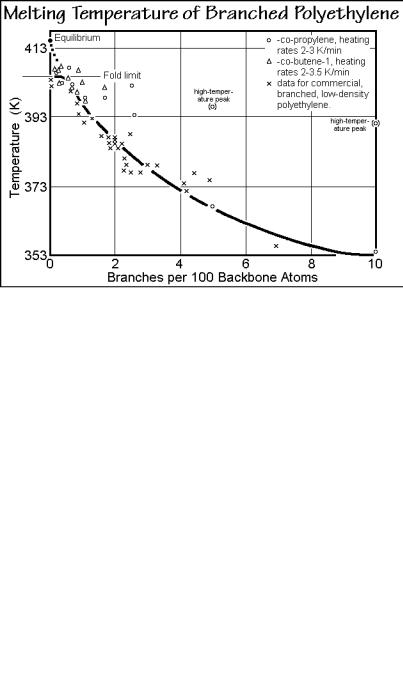
Sect. 5.3.3). Figure 7.34, finally, is a plot of data of the melting end as a function of branch concentration. Although one might extrapolate the data to the marked equilibrium melting temperature of the homopolymer, the influence of the fold limit is obvious.
The more recently available linear-low-density polyethylenes allow more precise analyses. In LLDPE, for example, ethylene and octene are reacted using a homoge-
7.2 Melting Transitions of Copolymers |
735 |
___________________________________________________________________
Fig. 7.34
neous, single-site catalyst which results in a uniform distribution of the comonomers and a very narrow molar mass distribution (see Sect. 3.2.1). In Fig. 7.35 heat capacity measurements and the transition behavior of LLDPE with an octene content of 7.3 mol-% are displayed (24 wt-%) [14–17]. On heating, the crystallinity is 24% at 240 K and decreases continuously to a value of 14% at 298 K and reaches the melt-end at 355 K. The crystallization process during cooling begins at 323 K (onset) and covers
Fig. 7.35
736 7 Multiple Component Materials
___________________________________________________________________
the temperature range down to the glass transition. Crystallization consists of at least two different processes, one gives rise to the sharp peak at 318 K, the other is a more continuous process that extends to low temperatures.
These DSC data are compared in the figure to TMDSC results. The crystallization peak appears only in the total heat capacity and not in the reversing heat capacity, i.e., this process is irreversible and continues to ca. 255 K. At approximately 328 K, the reversing heat capacity also signals an exothermic process which dominates when approaching the glass transition temperature. On heating, larger deviations between the underlying and reversing heat capacity can be seen as a separate shoulder during the end of the melting process. It is straightforward to assume that the hightemperature melting correlates to the sharp crystallization peak.
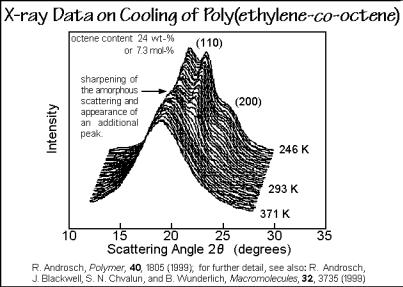
Temperature-resolved X-ray experiments on cooling are presented in Fig. 7.36. The first scans show only an amorphous halo. The copolymer is melted. At 321 K, the 110 and 200 orthorhombic crystal interferences appear. The peaks are shifted to lower values compared to the polyethylene homopolymer. The calculated lattice constant ao of 0.766 nm is expanded, as discussed with Fig. 7.32. At slightly lower temperatures, the shape of the amorphous halo changes abruptly and acquires a
Fig. 7.36
superimposed peak, indicative of the hexagonal phase. Cooling the sample further, results in an increase of the 110 and 200 orthorhombic interferences, as well as the hexagonal diffraction peak. At low temperature the LLDPE consists, thus, of at least three phases, orthorhombic and hexagonal crystals and amorphous glass or melt. More details of the LLDPE system were generated by studying a wider range of compositions, as shown in Figs. 7.37 and 7.38. Again, the structure was first set by cooling and analyzed by standard DSC.
To estimate the ratio of the reversing to irreversible melting at a chosen temperature, the specific reversibility, TMDSC results were compared to standard
