

crack the case
.pdfBlueblood Distribution |
Case Pack: 001 |
|
I
Pages
7 - 13


 Case Answers and Interviewer Notes
Candidates should not read through this pack until completing the case. Remove pages 3 and 4 before beginning the case.
Interviewer
•Prep time: This case is rated 1 star in terms of difficulty and has few complexities. Expect to invest at least 5 minutes preparing. Review the following:
-Interviewer Fact Sheet (p. 7)
-Case at a Glance (p. 8)
-Handout (p. 9-10)
-Data Distribution (p. 11)
-Re-routers and Heavy Lifting (p. 12)
-Candidate’s “Mine for the Answer” sheet (p. 18)
•Giving the case: Start the interview realistically - greet, shake hands, chat and introduce the case. To make the interview more challenging consider taking on an interviewer personality. For tips look at p. 16. Fill out the Interview Feedback sheet and discuss strengths and weaknesses with the candidate.
C
Pages 14 - 20
Candidate
•Working with an interviewer: Remove pages 3 through 6 to take notes and do your
work. Give the rest of the pack to your interviewer. Interviewer prep is about 10-15 minutes for this case.
•After the interview: Rate yourself using the Self Assessment sheet in the back of the case pack. Review the feedback score and comments from your interviewer and discuss ways to improve. Review the suggested answers in the case.
•Self-study: Remove pages 3 through 6 to take notes and do your work. Remove any data handouts and place them face down. Follow the three Self Study Steps listed on these sheets. This self study method will help you form your plan, practice asking good questions and improve your ability to pull insights from the data slides. Keep in mind that you will benefit most from working with an interviewer who can evaluate your performance objectively.
Throughout these notes references will be made to the MVM™ (Maximum Value Model) and the FRAME Method™, the building blocks of the One Model/One Method™ approach to case interviews. Full descriptions of these unique tools, as well as additional cases, can be found in the book, Crack the Case: How to Conquer Your Case Interviews, available at www.consultingcase.com.
The facts of this case, company names and answers are completely fictitious. Any resemblance to actual people, places, companies and strategic outcomes is entirely coincidental.
Purchase additional cases and the book Crack the Case: How to Conquer Your Case Interviews at |
2 |
www.consultingcase.com. Copyright © 2004 Turtle Hare Media |
|


Blueblood Distribution |
I |
Pack: 001 page 7 of 20
Interviewer Fact Sheet
CaseCaseQuestionQuestion
BluebloodBluebloodDistributionDistributionisisaa$$300M,300M,nationwidenationwidedistributordistributorofofwineswinesandandspiritsspirits.. TheirTheirmainmain customerscustomersarearewinewineandandspiritspiritretailers,retailers,majormajorgrocerygrocerystoresstoresandandfoodfood--martsmarts.. PresentlyPresentlytheytheyownown 2222distributiondistributionsitessitesandandarearetryingtryingtotodeterminedeterminewhatwhatfactorsfactorsmakemakesomesomesitessitesmoremoreprofitableprofitablethanthan othersothers.. WhatWhatmetricsmetricswouldwouldyouyouuseusetotocomparecomparedistributiondistributionsites?sites? WhichWhichmetricsmetricswouldwouldbebethethe mostmostinsightful?insightful?
AAFewFewTipsTipsfromfromDavidDavid
•This case is designed as a warm-up for future tough ones. Your job here is to help the Candidate explore her own ideas fully before looking at the slide.
•On a practical note, these are the most critical metrics for many distribution facilities. This data should be helpful for similar cases in the future.
IntroIntro FactsFacts
(Tell(Te lthetheCandidateCandidateififAsked)Asked)
•• OwnershipOwnership––EachEachlocationlocationisis“owned”“owned”byby the Regional VP, a company employee with the Regional VP, a company employee with incentive compensation consisting of 75% incentive compensation consisting of 75% fromfromregionalregionalperformanceperformanceandand25%25%fromfrom overallovera lcorporatecorporateperformanceperformance.. AnAn additionaladditionalbonusbonusisisavailableavailabletotothethetoptop55 performingperformingregionsregions..
•• SalesSalesforceforce––EachEachdistributiondistributionsitesiteisis responsibleresponsibleforforgeneratinggeneratingsalessalesnearnearthethe sitesitewithwithgrocerygrocerychains,chains,restaurantsrestaurantsandand winewineandandspiritspiritretailersretailers..
•• RegionsRegions––ThereTherewaswaslittlelittleplanningplanningaroundaround howhoweacheachregionregionwaswasdeveloped;developed;thethe RegionalRegionalVPVPdetermineddeterminedmostmostofofthethe regionalregionallocationslocationsaccordingaccordingtotohis/herhis/her preferences.
preferences.
•• InformationInformationsharingsharingacrossacrossregionsregions–– DistributionDistributioncenterscentersareareencouragedencouragedtotoshareshare best practices to increase the overall
best practices to increase the overa l performance of the company. performance of the company.
On-Track Indicators
 Structures the discussion – directs the conversation into relevant areas
 Pulls out insights – does a good job of “connecting the dots” between various topics
 Creative – thinks of innovative ways to collect data and measure distribution center performance
Keyey InsightsInsights
(Do(DoNotNotTellTe lthetheCandidate)Candidate)
Common Sense Review
Common Sense Review
ThisThiscasecaseisisnotnotcomplicated,complicated,butbutititdoesdoes requirerequirethetheCandidateCandidatetotothinkthinkclearlyclearlyaboutabout
whichwhichmetricsmetricswillwi lhavehavethethemostmostimpactimpact.. There is not enough information to draw There is not enough information to draw statisticalstatisticalsignificancesignificancebetweenbetweeneacheachmetricmetric
andandthethebottombottomlinelineperformance,performance,butbutsomesome metricsmetricsdodoappearappeartotobebemoremoreimportantimportantthanthan othersothers..
44KeyKeyMetricsMetrics
TheseThesefourfourmetricsmetricshavehavethethebiggestbiggestimpactimpactonon performance:performance: inventoryinventoryturns,turns,limitinglimitingthethe
numbernumberofofSKU’s,SKU’s,routeroutedensitydensityandandrelativerelative market share (RMS). Sites that are the bottom market share (RMS). Sites that are the bottom performersperformerstendtendtotoperformperformmuchmuchworseworseonon
thesethese.. SinceSinceyouyoustartstartoffoffwithwithaadiscussiondiscussion first,first,seeseehowhowthetheCandidate’sCandidate’sinitialinitialthoughtsthoughts comparecomparetotothethefinalfinalanswersanswers..
Off-Track Indicators
 Sticks on one topic too long – this is a wide open question that requires discussion in multiple areas
 Avoids data – talks a good game about metrics, but has no idea how to build them or interpret them
 Thinks of impractical solutions – wants to review metrics that are difficult to collect
Purchase additional cases and the book Crack the Case: How to Conquer Your Case Interviews at |
7 |
www.consultingcase.com. Copyright © 2004 Turtle Hare Media |
|
Blueblood Distribution |
I |
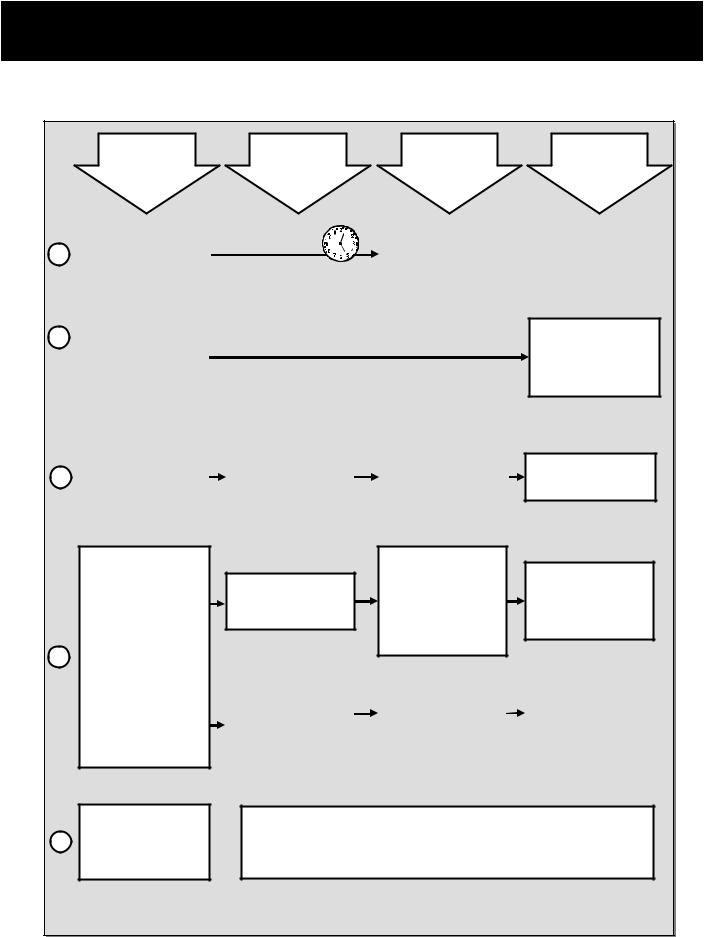
Case at a Glance
Pack: 001 page 8 of 20
1
2
3
4
Typical Case |
|
Interviewer |
Candidate |
||||||||
|
Questions & |
Questions & |
|||||||||
Flow |
|
||||||||||
|
Comments |
Answers |
|||||||||
|
|
||||||||||
|
|
|
|
|
|
|
|
|
|
|
|
Present main |
|
|
|
|
|
|
|
|
|
|
|
question. Candidate |
|
|
|
|
|
|
|
|
|
|
Candidate takes notes, |
|
|
|
|
|
|
|
|
|
|
||
takes notes, asks for a |
|
|
|
|
|
|
|
|
|
|
asks for a minute, forms |
minute, forms a plan and |
|
|
~0:01 min. |
|
a plan and presents it. |
||||||
presents it. |
|
|
|
|
|
|
|
|
|
|
|
|
|
|
|
|
|
|
|
|
|
|
|
|
|
|
|
|
|
|
|
|
|
|
|
Answer any basic fact |
|
|
|
|
|
|
|
|
|
|
|
questions. This case |
|
|
|
|
|
|
|
|
|
|
|
has a large brainstorming |
|
|
|
|
|
|
|
|
|
|
|
component so it would be |
|
|
|
|
|
|
|
|
|
|
|
easy to slide into that |
|
|
|
|
|
|
|
|
|
|
|
discussion. Hold off |
|
|
|
|
|
|
|
|
|
|
|
though and wait to fully |
|
|
|
|
|
|
|
|
|
|
|
understand her Plan. |
|
|
|
|
|
|
|
|
|
|
|
|
|
|
|
|
|
|
|
|
|
|
|
|
|
|
|
|
|
|
|
|
|
|
|
|
|
|
|
|
|
|
|
|
|
|
Look for clear |
|
|
“Tell me more about |
|
|
|||||||
Ask for clarification if |
|
|
|
connections between |
|||||||
|
this area (you choose). |
|
|
||||||||
|
|
|
each part of the plan and |
||||||||
necessary. Be sure to |
|
What are you thinking |
|
|
|||||||
|
|
|
an understanding of how |
||||||||
make him explain |
|
about here.” or “Tell |
|
|
|||||||
|
|
|
each part contributes to |
||||||||
anything you do not fully |
|
me how the parts of |
|
|
|||||||
|
|
|
the whole. Look for solid |
||||||||
understand. |
|
your structure link to |
|
|
|||||||
|
|
|
logic on how this plan will |
||||||||
|
|
each other.” |
|
|
|||||||
|
|
|
|
get some answers. |
|||||||
|
|
|
|
|
|
|
|
|
|
|
|
Data &
Answers to
Provide
See Intro Facts on the Interviewer Fact Sheet. Also review potential questions on the Mine for the Answer sheet (p. 18).
No handouts yet. Ask questions about her approach.
Guide the discussion through the brainstorming and the handout. Metrics as a topic come up all the time in business. Here is a chance for your Candidate to think through the kind of metrics that matter most to a distribution site. After talking about the metrics, hand out some performance data. This is all the information that the Candidate needs to do well on the case.
“What metrics matter the most to distribution companies?”
Candidates typically come up with the obvious ones like inventory turns and number of SKU’s but need a little help with ones like the picking and packing process time.
No handouts yet. Use the Data Distribution sheet to prompt the interviewer for more ideas.
“Looking at the data on |
|
|
|
|
|
Good answers include: |
|
|
|
this sheet, tell me what |
|
average turns, number of |
|
|
|
|
Handout A. Use your |
||
you see.” After |
|
SKU’s, relative market |
|
|
discussing her insights |
|
share and route density. |
|
judgment as to when to |
ask, “Which metrics are |
|
|
hand it out. |
|
|
The other metrics do not |
|
||
the most insightful? |
|
|
|
|
|
vary that much by site. |
|
|
|
|
|
|
||
Why?” |
|
|
|
|
|
|
|
|
|
|
|
|
|
|
|
|
|
|
|
Ask for a recommendation at the
5end. Gauge whether it is  data driven and based on
the facts of the case.
•Options going forward should reference the data from the case.
•The Candidate should be looking for ways to gather more detailed data and want to confirm with rigor that these numbers are correct.
•There may be other metrics that could be measured that would be even more meaningful, like the experience of the distribution site leader.
Purchase additional cases and the book Crack the Case: How to Conquer Your Case Interviews at |
8 |
www.consultingcase.com. Copyright © 2004 Turtle Hare Media |
|

Blueblood Distribution |
I |
Pack: 001 page 11 of 20
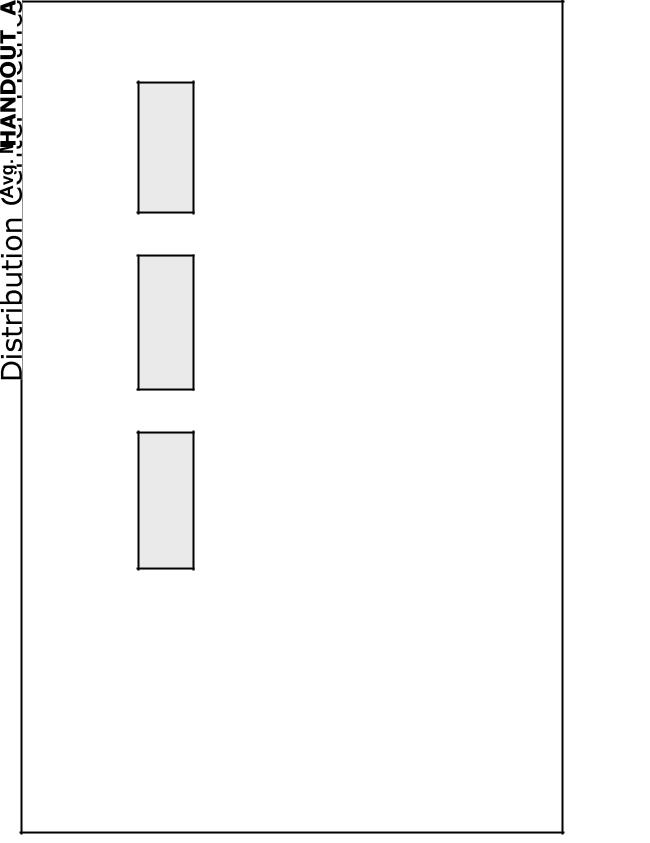
Data Distribution
Additional metrics candidate may mention. Provide data if appropriate.
First, discuss the metrics
Facilitate a discussion about metrics in a distribution facility. Ask questions about which metrics are most meaningful, and how you gather such metrics. If the candidate gets stuck, offer a few of these:
Receiving – bringing shipments of wine into the warehouse quickly, safely (without breakage) and consistently
Picking and Packing – minimizing the time to print an order, pick a product and pack it in a box
Inventory Turns – ensuring breadth of product while “turning” popular sku’s often
Admin/ Accounting – streamlining all internal processes and minimizing personnel
SKU Management – keeping the number of products down
Sales per Customer – trying to increase the average order size and frequency of order
Delivery Costs – Minimizing the internal cost per order by building route density
Route Density – Routing trucks to maximize the number of customers in the shortest distance
Relative Market Share – Increasing dominance by distribution region to better control pricing. RMS = Blueblood’s market share compared to next competitor or leader. For example, if RMS = 2, BB has 2x the share of the next competitor; if RMS = .5, BB is has half the market share as the leader
Second, give Handout A (with the following metrics and data) to the candidate.
Each column reflects some portion of the 22 sites. Ask the candidate to explain which metrics appear to be the most valuable. Also ask whether his/her initial thoughts will change now that s/he has some facts.
|
|
Top |
|
Middle of |
|
Bottom |
|
|
|
Top |
|
Middle of |
|
Bottom |
|
|
|
Performer |
|
the Road |
|
Performer |
|
|
|
Performer |
|
the Road |
|
Performer |
|
|
|
|
|
|
|
|
|
Annual Revenue |
$20M |
|
$15M |
|
$11M |
||
Average Turns |
|
|
|
|
|
|
|
8x per year |
|
6x per year |
|
|
2x per year |
||
Order to Pack Time |
33 min. |
|
28 min. |
|
24 min. |
||
Avg. Miles per Delivery |
.3 miles |
|
.5 miles |
|
1.2 miles |
||
Number of SKU’s |
|
|
|
|
|||
2,500 |
3,100 |
|
6,200 |
||||
RMS |
|
|
|
|
|
|
|
1.5 |
1.1 |
|
.6 |
||||
Route Density |
|
|
|
|
|
|
|
32 sites/ 8 hrs |
|
27 sites/ 8 hrs |
|
|
12 sites/ 8 hrs |
||
Personnel Costs |
$223,000 |
$190,00 |
|
$200,000 |
|||
Purchase additional cases and the book Crack the Case: How to Conquer Your Case Interviews at |
11 |
www.consultingcase.com. Copyright © 2004 Turtle Hare Media |
|

Blueblood Distribution |
I |
Pack: 001 page 12 of 20
Re-routers and Heavy Lifting
Re-routers
Questions To Keep Things On Track
What other metrics would you consider?
Competitive intensity, measured in relative market share (RMS) is often forgotten
Route efficiency, measured by mileage between deliveries and number of deliveries per day
Of the metrics you’ve mentioned thus far, which one or two capture the most important drivers of the business?
RMS is critical to controlling customer relationships and setting price for a region.
Route density and average miles per delivery are good measures of how well the sales team is selling along the routes
Which metrics can we gather the most easily?
Heavy Lifting
Questions To Make the Case More Difficult
If you had to eliminate 5 of the 22 sites and could only use one metric to do it, which one would you use?
RMS indicates market strength, an important indicator of pricing power and relationships with customers (my choice)
High inventory turns indicates a focused, well chosen set of sku’s
Route density gives insight on how costly it is to deliver to customers
If you had to fix a “poor performer” what would you look to do first?
Streamline the sku’s, pump up inventory turns, and re-route the deliveries. Changing RMS takes time and would be a medium term goal.
Purchase additional cases and the book Crack the Case: How to Conquer Your Case Interviews at |
12 |
www.consultingcase.com. Copyright © 2004 Turtle Hare Media |
|

Blueblood Distribution |
I |
Interviewer Feedback
Pack: 001 page 13 of 20
Planning & Logic |
Excellent |
|
|
|
|
Poor |
|
|||
1 |
2 |
3 |
4 |
5 |
6 |
|
||||
1. |
I understood your plan to solve this case. |
|
||||||||
|
|
|
|
|
|
|
||||
|
|
|
|
Very clear |
|
|
Fuzzy |
|
Not clear at all |
|
|
|
|
|
|
|
|
|
|
|
|
2. |
Your plan was MECE. |
1 |
2 |
3 |
4 |
5 |
6 |
|
||
|
|
(Mutually exclusive, collectively exhaustive) |
No overlaps |
|
|
|
Several overlaps |
|
||
|
|
|
|
and gaps |
|
|
|
and full of gaps |
|
|
|
|
|
|
|
|
|
|
|
|
|
3. |
You trusted your plan and referred to it often. |
1 |
2 |
3 |
4 |
5 |
6 |
|
||
|
|
|
|
Used it, |
|
|
|
|
You basically |
|
|
|
|
|
referred to it often |
|
|
|
forgot about it |
|
|
|
|
|
|
|
|
|
|
|
||
Communication & Composure |
|
|
|
|
|
|
|
|||
4. |
You were calm and collected. |
1 |
2 |
3 |
4 |
5 |
6 |
|
||
|
|
|
|
Calm, confident |
|
Off and on |
|
Sweaty, shaky |
|
|
|
|
|
|
and client ready |
nervousness |
|
mess |
|
||
|
|
|
|
|
|
|
|
|
|
|
5. |
You carried the discussion well. |
1 |
2 |
3 |
4 |
5 |
6 |
|
||
|
|
|
|
Just the right |
|
Occasionally |
|
I’d avoid you |
|
|
|
|
|
|
amount of back |
|
awkward |
|
at cocktail |
|
|
|
|
|
|
and forth |
|
|
|
|
parties |
|
6. You drove the case.
1 2
Clearly in control, you took the case to a conclusion
3 |
4 |
5 |
6 |
You took control |
|
Adrift at sea |
|
sometimes, but |
|
|
|
then let me drive |
|
|
|
Analytics
7. You analyzed the data well on a piece by piece basis.
1 |
2 |
3 |
4 |
5 |
6 |
Quick to insights, |
|
Slow on the |
Lots of mistakes, |
||
no math errors |
|
uptake, some |
|
you didn’t get |
|
|
|
|
math mistakes |
|
the insights |
8. You integrated data well and reached insights (saw the big picture).
1 |
2 |
3 |
4 |
5 |
6 |
Quick to “connect |
You missed |
You missed all the |
|||
the dots” and see |
|
some |
linkages between |
||
how it all ties |
|
connections |
|
the data |
|
Recommendation
9. Your final recommendation was to the point and data driven.
1 |
2 |
3 |
4 |
5 |
6 |
Used facts and |
|
|
You seemed to |
||
data to back up |
|
|
|
solve the case |
|
your thoughts |
|
|
|
from your gut |
|
10. You were persuasive in making your final points.
1 |
2 |
3 |
4 |
5 |
6 |
Persuasive points, |
|
|
You couldn’t even |
||
passion and a |
|
|
convince yourself, |
||
bottom-line tone |
|
|
|
zero passion |
|
Total Score:
(10-60)
Before giving your score, have the candidate do the Self Assessment at the back of the case pack. What can you tell the candidate that will help him or her prioritize his prep going forward?
Purchase additional cases and the book Crack the Case: How to Conquer Your Case Interviews at |
13 |
www.consultingcase.com. Copyright © 2004 Turtle Hare Media |
|