

Fundamentals Of Wireless Communication
.pdf128 Cellular systems
which it could originate and the channel variations. But due to the fact that the interfering user can be at a wide range of locations, the variance of I is quite high.
We see that the SINR is a random parameter leading to an undesirably poor performance. There is an appreciably high probability of unreliable transmission of even a small and fixed data rate in the frame. In Chapter 3, we focused on techniques that impart channel diversity to the system; for example, antenna diversity techniques make the channel less variable, improving performance. However, there is an important distinction in the variability of the SINR here that cannot be improved by the diversity techniques of Chapter 3. The randomness in the interference I due to the interferer’s location is inherent in this system and remains. Due to this, we can conclude that narrowband systems are unsuitable for universal frequency reuse. To reduce the randomness in the SINR, we would really like the interference to be averaged over several simultaneous lower-powered transmissions from the neighboring cell instead of coming from one user only. This is one of the important underlying themes in the design of the next two systems that have universal frequency reuse.
Summary 4.1 Narrowband systems
Orthogonal narrowband channels are assigned to users within a cell.
Users in adjacent cells cannot be assigned the same channel due to the lack of interference averaging across users. This reduces the frequency
reuse factor and leads to inefficient use of the total bandwidth.
The network is decomposed into a set of high SINR point-to-point links, simplifying the physical-layer design.
Frequency planning is complex, particularly when new cells have to be added.
4.3 Wideband systems: CDMA
In narrowband systems, users are assigned disjoint time-frequency slots within the cell, and users in adjacent cells are assigned different frequency bands. The network is decomposed into a set of point-to-point non-interfering links. In a code division multiple access (CDMA) system design, the multiple access and interference management strategies are different. Using the directsequence spread-spectrum technique briefly mentioned in Section 3.4.3, each user spreads its signal over the entire bandwidth, such that when demodulating any particular user’s data, other users’ signals appear as pseudo white noise.
129 |
4.3 Wideband systems: CDMA |
Thus, not only all users in the same cell share all the time-frequency degrees of freedom, so do the users in different cells. Universal frequency reuse is a key property of CDMA systems.
Roughly, the design philosophy of CDMA systems can be broken down into two design goals:
•First, the interference seen by any user is made as similar to white Gaussian noise as possible, and the power of that interference is kept to a minimum level and as consistent as possible. This is achieved by:
•Making the received signal of every user as random looking as possible, via modulating the coded bits onto a long pseudonoise sequence.
•Tight power control among users within the same cell to ensure that the received power of each user is no more than the minimum level needed for demodulation. This is so that the interference from users closer to the base-station will not overwhelm users further away (the so-called near–far problem).
•Averaging the interference of many geographically distributed users in nearby cells. This averaging not only makes the aggregate interference look Gaussian, but more importantly reduces the randomness of the interference level due to varying locations of the interferers, thus increasing link reliability. This is the key reason why universal frequency reuse is possible in a wideband system but impossible in a narrowband system.
•Assuming the first design goal is met, each user sees a point-to-point wideband fading channel with additive Gaussian noise. Diversity techniques introduced in Chapter 3, such as coding, time-interleaving, Rake combining and antenna diversity, can be employed to improve the reliability of these point-to-point links.
Thus, CDMA is different from narrowband system design in the sense that all users share all degrees of freedom and therefore interfere with each other: the system is interference-limited rather than degree-of-freedom-limited. On the other hand, it is similar in the sense that the design philosophy is still to decompose the network problem into a set of independent point-to-point links, only now each link sees both interference as well as the background thermal noise. We do not question this design philosophy here, but we will see that there are alternative approaches in later chapters. In this section, we confine ourselves to discussing the various components of a CDMA system in the quest to meet the two design goals. We use the IS-95 standard to discuss concretely the translation of the design goals into a real system.
Compared to the narrowband systems described in the previous section, CDMA has several potential benefits:
•Universal frequency reuse means that users in all cells get the full bandwidth or degrees of freedom of the system. In narrowband systems, the number of degrees of freedom per user is reduced by both the number of users sharing the resources within a cell as well as by the frequency-reuse
130 |
Cellular systems |
factor. This increase in degrees of freedom per user of a CDMA system however comes at the expense of a lower signal-to-interference-plus-noise ratio (SINR) per degree of freedom of the individual links.
•Because the performance of a user depends only on the aggregate interference level, the CDMA approach automatically takes advantage of the source variability of users; if a user stops transmitting data, the total interference level automatically goes down and benefits all the other users. Assuming that users’ activities are independent of each other, this provides a statistical multiplexing effect to enable the system to accommodate more users than would be possible if every user were transmitting continuously. Unlike narrowband systems, no explicit re-assignment of time or frequency slots is required.
•In a narrowband system, new users cannot be admitted into a network once the time–frequency slots run out. This imposes a hard capacity limit on the system. In contrast, increasing the number of users in a CDMA system increases the total level of interference. This allows a more graceful degradation on the performance of a system and provides a soft capacity limit on the system.
•Since all cells share a common spectrum, a user on the edge of a cell can receive or transmit signals to two or more base-stations to improve reception. This is called soft handoff, and is yet another diversity technique, but at the network level (sometimes called macrodiversity). It is an important mechanism to increase the capacity of CDMA systems.
In addition to these network benefits, there is a further link-level advantage over narrowband systems: every user in a CDMA experiences a wideband fading channel and can therefore exploit the inherent frequency diversity in the system. This is particularly important in a slow fading environment where there is a lack of time diversity. It significantly reduces the fade margin of the system (the increased SINR required to achieve the same error probability as in an AWGN channel).
On the cons side, it should be noted that the performance of CDMA systems depends crucially on accurate power control, as the channel attenuation of nearby and cell edge users can differ by many tens of dBs. This requires frequent feedback of power control information and incurs a significant overhead per active user. In contrast, tight power control is not necessary in narrowband systems, and power control is exercised mainly for reducing battery consumption rather than managing interference. Also, it is important in a CDMA system that there be sufficient averaging of out-of-cell interference. While this assumption is rather reasonable in the uplink because the interference comes from many weak users, it is more questionable in the downlink, where the interference comes from a few strong adjacent base-stations.3
3 In fact, the downlink of IS-95 is the capacity limiting link.
131 4.3 Wideband systems: CDMA
A comprehensive capacity comparison between CDMA and narrowband systems depends on the specific coding schemes and power control strategies, the channel propagation models, the traffic characteristics and arrival patterns of the users, etc. and is beyond the scope of this book. Moreover, many of the advantages of CDMA outlined above are qualitative and can probably be achieved in the narrowband system, albeit with a more complex engineering design. We focus here on a qualitative discussion on the key features of a CDMA system, backed up by some simple analysis to gain some insights into these features. In Chapter 5, we look at a simplified cellular setting and apply some basic information theory to analyze the tradeoff between the increase in degrees of freedom and the increase in the level of interference due to universal frequency reuse.
In a CDMA system, users interact through the interference they cause each other. We discuss ways to manage that interference and analyze its effect on performance. For concreteness, we first focus on the uplink and then move on to the downlink. Even though there are many similarities in their design, there are several differences worth pointing out.
4.3.1 CDMA uplink
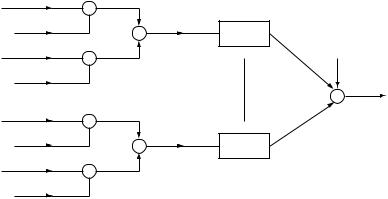
The general schematic of the uplink of a CDMA system with K users in the system is shown in Figure 4.3. A fraction of the K users are in the cell and the rest are outside the cell. The data of the kth user are encoded into two BPSK sequences4 aIkm and aQk m, which we assume to have equal amplitude for all m. Each sequence is modulated by a pseudonoise sequence, so that the transmitted complex sequence is
xkm = aIkm skI m + jaQk m skQm m = 1 2 (4.1)
where skI m and skQm are pseudonoise sequences taking values ±1. Recall that m is called a chip time. Typically, the chip rate is much larger than the data rate.5 Consequently, information bits are heavily coded and the coded sequences aIkm and aQk M have a lot of redundancy. The transmitted sequence of user k goes through a discrete-time baseband equivalent multipath channel h k and is superimposed at the receiver:
K |
|
|
|
h k m xkm − + w m |
|
|
|
||||
y m = k |
1 |
|
(4.2) |
||
= |
|
|
|
|
|
The fading channels h k are assumed to be independent across users, in addition to the assumption of independence across taps made in Section 3.4.3.
4 Since CDMA systems operate at very low SINR per degree of freedom, a binary modulation alphabet is always used.
5 In IS-95, the chip rate is 1.2288 MHz and the data rate is 9.6 kbits/s or less.
132
Figure 4.3 Schematic of the CDMA uplink.
Cellular systems
{a1I[m]}
{s1I[m]}
Q
{a1[m]}
Q
{s1[m]}
{aKI [m]}
{sKI [m]} {aKQ[m]} {sKQ[m]}
×
+ |
h (1) |
{w[m]}
×
Σ
×
+ |
h(K ) |
×
The receiver for user k multiplies the I and Q components of the output sequence y m by the pseudonoise sequences skI m and skQm respectively to extract the coded streams of user k, which are then fed into a demodulator to recover the information bits. Note that in practice, the users’ signals arrive asynchronously at the transmitter but we are making the idealistic assumption that users are chip-synchronous, so that the discrete-time model in Chapter 2 can be extended to the multiuser scenario here. Also, we are making the assumption that the receiver is already synchronized with each of the transmitters. In practice, there is a timing acquisition process by which such synchronization is achieved and maintained. Basically, it is a hypothesis testing problem, in which each hypothesis corresponds to a possible relative delay between the transmitter and the receiver. The challenge here is that because timing has to be accurate to the level of a chip, there are many hypotheses to consider and efficient search procedures are needed. Some of these procedures are detailed in Chapter 3 of [140].
Generation of pseudonoise sequences
The pseudonoise sequences are typically generated by maximum length shift registers. For a shift register of memory length r, the value of the sequence at time m is a linear function (in the binary field of 0 1 ) of the values at time m − 1 m − 2 m − r (its state). Thus, these binary 0−1 sequences are periodic, and the maximum period length is p = 2r − 1, the number of non-zero states of the register.6 This occurs when, starting from any nonzero state, the shift register goes through all possible 2r − 1 distinct non-zero states before returning to that state. Maximum length shift register (MLSR) sequences have this maximum periodic length, and they exist even for r very
6Starting from the zero state, the register will remain at the zero state, so the zero state cannot be part of such a period.
133 |
4.3 Wideband systems: CDMA |
large. For CDMA applications, typically, r is somewhere between 20 and 50, thus the period is very long. Note that the generation of the sequence is a deterministic process, and the only randomness is in the initial state. An equivalent way to say this is that realizations of MLSR sequences are random shifts of each other.
The desired pseudonoise sequence s m can be obtained from an MLSR sequence simply by mapping each value from 0 to +1 and from 1 to −1. This pseudonoise sequence has the following characteristics which make it look like a typical realization of a Bernoulli coin-flipped sequence ([52, 140]):
•
1 |
p |
1 |
|
|
|
|
|
|
|
|
|
|
p |
m=1 s m = − |
p |
|
(4.3) |
i.e., the fraction of 0’s and 1’s is almost half-and-half over the period p.
• For all =0:
1 |
p |
1 |
|
|
|
|
|
|
|
|
|
|
p |
m=1 s m s m + = − |
p |
|
(4.4) |
i.e., the shifted versions of the pseudonoise sequence are nearly orthogonal to each other.
For memory r = 2, the period is 3 and the MLSR sequence is 110110110 … The states 11, 10, 01 appear in succession within each period. 00 does not appear, and this is the reason why the sum in (4.3) is not zero. However, this imbalance is very small when the period p is large.
If we randomize the shift of the pseudonoise sequence (i.e., uniformly chosen initial state of the shift register), then it becomes a random process. The above properties suggest that the resulting process is approximately like an i.i.d. Bernoulli sequence over a long time-scale (since p is very large). We will make this assumption below in our analysis of the statistics of the interference.
Statistics of the interference
In a CDMA system, the signal of one user is typically demodulated treating other users’ signals as interference. The link level performance then depends on the statistics of the interference. Focusing on the demodulation of user 1, the aggregate interference it sees is
|
|
|
h k m xkm − |
|
I m = k>1 |
|
(4.5) |
I m has zero mean. Since the fading processes are circular symmetric, the process I m is circular symmetric as well. The second-order statistics
134 Cellular systems
are then characterized |
by |
I m I m + for = 0 1 They |
can be |
||||
computed as |
|
|
|
|
|
|
|
I m 2 |
= |
kc |
I m I m + = 0 for =0 |
(4.6) |
|||
k>1 |
|||||||
|
|
|
|
|
|
||
where |
|
|
|
|
|
|
|
|
|
kc = xkm 2 |
h k m 2 |
(4.7) |
|||
is the total average energy received per chip from the kth user due to the multipath. In the above variance calculation, we make use of the fact thatxkm xkm+ = 0 (for =0), due to the random nature of the spreading sequences. Note that in computing these statistics, we are averaging over both the data and the fading gains of the other users.
When there are many users in the network, and none of them contributes to a significant part of the interference, the Central Limit Theorem can be invoked to justify a Gaussian approximation of the interference process. From the second-order statistics, we see that this process is white. Hence, a reasonable approximation from the point of view of designing the point-to-point link for user 1 is to consider it as a multipath fading channel with white Gaussian
noise of power |
k>1 kc + N0.7 |
|
We have |
made the assumption that none of the users contributes a large |
|
|
|
|
part of the interference. This is a reasonable assumption due to two important mechanisms in a CDMA system:
•Power control The transmit powers of the users within the cell are controlled to solve the near–far problem, and this makes sure that there is no significant intra-cell interferer.
•Soft handoff Each base-station that receives a mobile’s signal will attempt to decode its data and send them to the MSC (mobile switching center) together with some measure of the quality of the reception. The MSC will select the one with the highest quality of reception. Typically the user’s power will be controlled by the base-station which has the best reception. This reduces the chance that some significant out-of-cell interferer is not power controlled.
We will discuss these two mechanisms in more detail later on.
Point-to-point link design
We have already discussed to some extent the design issues of the point-to- point link in a DS spread-spectrum system in Section 3.4.3. In the context
7This approach is by no means optimal, however. We will see in Chapter 6 that better performance can be achieved by recognizing that the interference consists of the data of the other users that can in fact be decoded.

135 |
4.3 Wideband systems: CDMA |
of the CDMA system, the only difference here is that we are now facing the aggregation of both interference and noise.
The link level performance of user 1 depends on the SINR:
SINRc |
|
|
|
1c |
(4.8) |
|
|
|
|
|
|
||
= k>1 |
|
|||||
|
|
kc + N0 |
|
|||
Note that this is the SINR per chip. The first observation is that typically the SINR per chip is very small. For example, if we consider a system with K perfectly power controlled users in the cell, even ignoring the out-of-cell interference and background noise, SINRc is 1/ K −1 . In a cell with 31 users, this is −15 dB. In IS-95, a typical level of out-of-cell interference is 0.6 of the interference from within the cell. (The background noise, on the other hand, is
often negligible in CDMA systems, which are primarily interference-limited.) This reduces the SINRc further to −17 dB.
How can we demodulate the transmitted signal at such low SINR? To see this in the simplest setting, let us consider an unfaded channel for user 1 and consider the simple example of BPSK modulation with coherent detection discussed in Section 3.4.3, where each information bit is modulated onto a pseudonoise sequence of length G chips. In the system discussed here which uses a long pseudonoise sequence s m (cf. Figure 4.3), this corresponds to repeating every BPSK symbol G times, aI1 Gi + m = aI1 Gi m = 1 G − 1.8 The detection of the 0th information symbol is accomplished by projecting the in-phase component of the received signal onto the sequence u = s1I 0 s1I 1 s1I G − 1 t, and the error probability is
pe |
|
Q |
|
|
2 u 2 1c |
|
Q |
|
|
2G 1c |
|
|
Q |
# |
2 b |
|
|
|
||||
= |
|
|
= |
|
|
+ |
N0 = |
|
|
+ |
(4.9) |
|||||||||||
|
|
k>1 kc |
+ |
N0 |
|
k>1 kc |
|
kc |
||||||||||||||
|
|
# |
|
|
|
# |
|
|
|
k>1 |
|
N0 |
||||||||||
where b = G 1c is the received energy per bit for user 1. Thus, we see that while the SINR per chip is low, the SINR per bit is increased by a factor of G, due to the averaging of the noise in the G chips over which we repeat the information bits. In terms of system parameters, G = W/R, where W Hz is the bandwidth and R bits/s is the data rate. Recall that this parameter is called the processing gain of the system, and we see its role here as increasing the effective SINR against a large amount of interference that the user faces. As we scale up the size of a CDMA system by increasing the bandwidth W
and the number of users in the system proportionally, but keeping the data
rate of each user R fixed, we see that the total interference k>1 kc and the
8As mentioned, a pseudonoise sequence typically has a period ranging from 220 to 250 chips, much larger than the processing gain G. In contrast, short pseudonoise sequences are used in the IS-95 downlink to uniquely identify the individual sector or cell.
136 |
Cellular systems |
Forward Link
Data
9.6 kbps
4.8 kbps Rate = 1/3, K = 9
2.4 kbps |
Convolutional |
|
Encoder |
||
1.2 kbps |
||
|
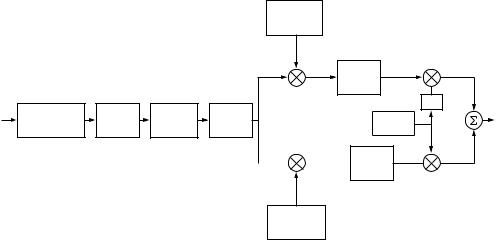
Figure 4.4 The IS-95 uplink.
IS-95 link design
PN Code
Generator for I channel
1.2288 Mchips/s
Baseband
Shaping
Filter
|
64-ary |
|
|
|
–90˚ |
|
Block |
Repetition |
1.2288 Mchips/s |
Carrier |
Output |
||
Orthogonal |
CDMA |
|||||
Interleaver |
×4 |
|||||
Modulator |
|
Generator |
Signal |
|||
|
|
|
28.8
ksym / s Baseband 
 Shaping
Filter
1.2288 Mchips/s
PN Code
Generator for Q channel
processing gain G increase proportionally as well. This means that CDMA is an inherently scalable multiple access scheme.9
The above scheme is based on repetition coding. By using more sophisticated low-rate codes, even better performance can be achieved. Moreover, in practice the actual channel is a multipath fading channel, and so techniques such as time-interleaving and the Rake receiver are important to obtain time and frequency diversity respectively. IS-95, for example, uses a combination of convolutional coding, interleaving and non-coherent demodulation of M-ary orthogonal symbols via a Rake receiver. (See Figure 4.4.) Compressed voice at rate 9.6 kbits/s is encoded using a rate 1/3, constraint length 9, convolutional code. The coded bits are time-interleaved at the level of 6-bit blocks, and each of these blocks is mapped into one of 26 = 64 orthogonal Hadamard sequences,10 each of length 64. Finally, each symbol of the Hadamard sequence is repeated four times to form the coded sequence aIm. The processing gain is seen to be 3 · 64/6 · 4 = 128, with a resulting chip rate of 128 · 9 6 = 1 2288 Mchips/s.
Each of the 6-bit blocks is demodulated non-coherently using a Rake receiver. In the binary orthogonal modulation example in Section 3.5.1, for each orthogonal sequence the non-coherent detector computes the correlation
9 But note that as the bandwidth gets wider and wider, channel uncertainty may eventually become the bottleneck, as we have seen in Section 3.5.
10The Hadamard sequences of length M = 2J are the orthogonal columns of the M by M matrix HM , defined recursively as H1 = 1 and for M ≥ 2:
HM/2 |
HM/2 |
|
HM = HM/2 |
−HM/2 |

137 4.3 Wideband systems: CDMA
along each diversity branch (finger) and then forms the sum of the squares. It then decides in favor of the sequence with the largest sum (the squarelaw detector). (Recall the discussion around (3.147).) Here, each 6-bit block should be thought of as a coded symbol of an outer convolutional code, and we are not interested in hard decision of the block. Instead, we would like to calculate the branch metric for each of the possible values of the 6-bit block, for use by a Viterbi decoder for the outer convolutional code. It happens that the sum of the squares above can be used as a metric, so that the Rake receiver structure can be used for this purpose as well. It should be noted that it is important that the time-interleaving be done at the level of the 6-bit blocks so that the channel remains constant within the chips associated with each such block. Otherwise non-coherent demodulation cannot be performed.
The IS-95 uplink design employs non-coherent demodulation. Another design option is to estimate the channel using a pilot signal and perform coherent demodulation. This option is adopted for CDMA 2000.
Power control
The link-level performance of a user is a function of its SINR. To achieve reliable communication, the SINR, or equivalently the ratio of the energy per bit to the interference and noise per chip (commonly called b/I0 in the CDMA literature), should be above a certain threshold. This threshold depends on the specific code used, as well as the multipath channel statistics. For example, a typical b/I0 threshold in the IS-95 system is 6 to 7 dB. In a mobile communication system, the attenuation of both the user of interest and the interferers varies as the users move, due to varying path loss and shadowing effects. To maintain a target SINR, transmit power control is needed.
The power control problem can be formulated in the network setting as follows. There are K users in total in the system and a number of cells (base-stations). Suppose user k is assigned to base-station ck. Let Pk be the transmit power of user k, and gkm be the attenuation of user k’s signal to basestation m.
The received energy per chip for user k at base-station m is simply given by Pkgkm/W . Using the expression (4.8), we see that if each user’s target b/I0 is , then the transmit powers of the users should be controlled such that
GPkgk ck |
≥ k = 1 K |
(4.10) |
n=k Pngn ck + N0W |
where G = W/R is the processing gain of the system. Moreover, due to constraints on the dynamic range of the transmitting mobiles, there is a limit of the transmit powers as well:
P |
k ≤ ˆ |
k |
= |
1 |
K |
(4.11) |
P |
|
|