

Fin management materials / 1 P4AFM-Session02_j08
.pdfSESSION 02 – SECURITY VALUATION AND THE COST OF CAPITAL 
OVERVIEW
Objective
¾To develop a model for the valuation of shares and bonds.
¾To use this model to estimate the cost of equity and the cost of debt.
¾To consider the relationship between short and long term interest rates.
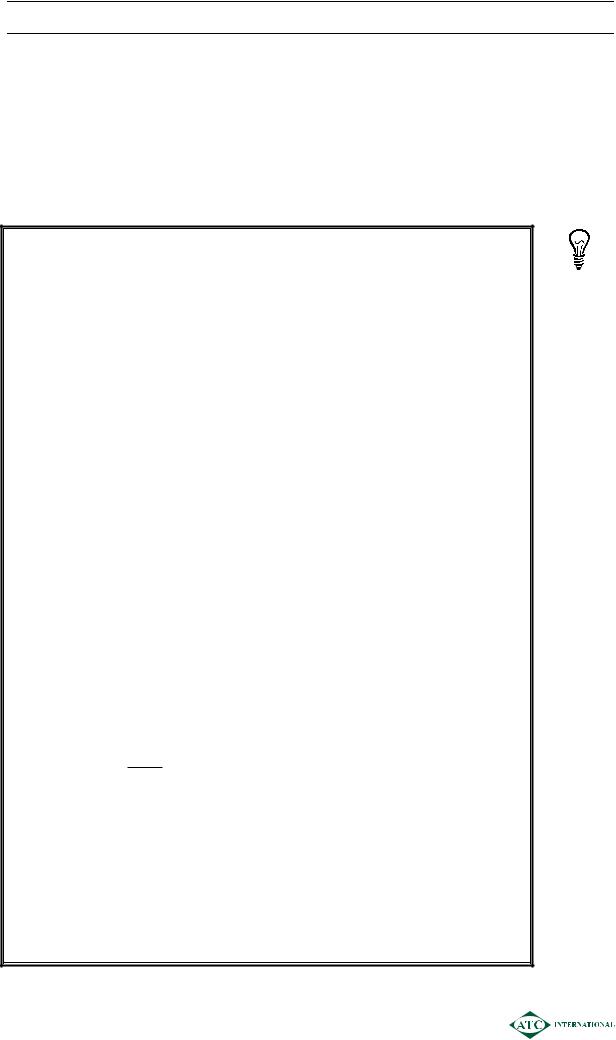
EFFICIENT
MARKETS
HYPOTHESIS
|
|
|
|
|
|
|
DIVIDEND |
|
|
BOND |
|
|
VALUATION |
|
|
VALUATION |
|
|
MODEL |
|
|
MODEL |
|
|
|
|
COST OF EQUITY
COST OF DEBT
TERM STRUCTURE
OF INTEREST
RATES
0201

SESSION 02 – SECURITY VALUATION AND THE COST OF CAPITAL
1CAPITAL MARKET EFFICIENCY
1.1Introduction
An efficient market is one in which the market price of all securities traded on it reflects all the available information. A perfect market is one which responds immediately to the information made available to it.
An efficient and perfect market will ensure that quoted share prices are as fair as possible, in that they accurately and quickly reflect a company’s financial position with respect to both current and future profitability.
Efficiency can be looked at in four ways:
¾Allocative efficiency:
Does the market attract funds to the best companies?
¾Operational efficiency:
Does the market have low transaction costs and a convenient trading platform? These promote a “deep” market with high liquidity i.e. a high volume of transactions.
¾Informational efficiency:
Is all relevant information available to all investors at low cost?
¾Pricing efficiency:
Do share prices quickly and accurately reflect all known information about the company? This is also referred to as information-processing efficiency.
Most research on market efficiency has focused on pricing efficiency. The most well-known model is the Efficient Market Hypothesis.
1.2The Efficient Market Hypothesis
The value of a share is based upon expectations of future cash flows from that share in the form of dividends (or share buy-backs).
The strength of the link between the performance of the company and the share price will depend upon the pricing efficiency of the capital markets.
0202

SESSION 02 – SECURITY VALUATION AND THE COST OF CAPITAL
The Efficient Market Hypothesis (EMH) considers three potential levels of efficiency.
¾Weak-form efficiency:
Share prices reflect all the information contained in the record of past prices. Share prices therefore follow a “random walk” and will move up or down depending on what information next reaches the market.
If this level of efficiency has been achieved it should not be possible to forecast price movements by reference to past trends i.e. “chartists” (also known as technical analysts) should not be able to consistently out-perform the market.
The way to consistency “beat” a weak-from efficient market is by analysis of publicly available information such as financial statements. i.e. fundamental analysis.
¾Semi-strong form efficiency:
Share prices reflect all information currently publicly available. Therefore the price will alter only when new information is published.
If this level of efficiency has been reached, price movements can only be forecast by using “inside” information i.e. materials non-public information. This is known as insider trading which is illegal in most markets and is unethical in any market.
¾Strong-form efficiency:
Share prices reflect all information, published and unpublished, that is relevant to the company.
If this level of efficiency has been reached, share prices cannot be predicted and gains through insider dealing are not possible as the market already knows everything!
In major markets such as the London or New York Stock Exchanges there are strict rules outlawing insider dealing. Therefore such markets are regarded as semi-strong efficient.
1.3The implications for financial managers
The level of efficiency of the stock market has implications for financial managers:
¾The timing of new issues:
Unless the market is fully efficient the timing of new issues remains important. This is because the market does not reflect all the relevant information, and hence advantage could be obtained by making an issue at a particular point in time just before or after additional information becomes available to the market.
¾Project evaluation:
If the market is not fully efficient, the price of a share is not fair, and therefore the rate of return required from that company by the market cannot be accurately known. If this is the case, it is not easy to decide what rate of return to use to evaluate new projects.
0203

SESSION 02 – SECURITY VALUATION AND THE COST OF CAPITAL
¾Creative accounting:
Unless a market is fully efficient creative accounting can still be used to mislead investors.
¾Mergers and takeovers:
Where a market is fully efficient, the price of all shares is fair. Hence, if a company is taken over at its current share value the purchaser cannot hope to make any gain unless economies can be made through scale or rationalisation when operations are merged. Unless these economies are very significant an acquirer should not be willing to pay a significant premium over the current share price.
¾Validity of current market price:
If the market is fully efficient, the share price is fair. In other words, an investor receives a fair risk/return combination for his investment and the company can raise funds at a fair cost. If this is the case, there should be no need to discount new issues to attract investors.
2DIVIDEND VALUATION MODEL
2.1The general model
¾The dividend valuation model states that:
“the market value of a share or other security is equal to the present value of the future expected cash flows from the security discounted at the investor’s required rate of return”.
¾A security is any traded investment e.g. shares and bonds.
2.2Constant Dividend
¾The formula for share valuation can be developed as follows:
Ex-div market value at time 0 |
= |
Present value of the future dividends |
|
|
discounted at the shareholders’ |
|
|
required rate of return |
¾Ex-div market value is the market value assuming that a dividend has just been paid.
¾Let:
Po |
= Current ex-div market value |
|
Dn |
= |
Dividend at time n |
ke |
= |
Shareholders’ required rate of return/company’s cost of equity |
0204

SESSION 02 – SECURITY VALUATION AND THE COST OF CAPITAL
¾ The model then becomes: |
|
|
|
|
||||||
Po |
= |
|
D1 |
+ |
D2 |
+ |
D3 |
..... |
Dn |
|
(1 |
+ ke) |
(1+ke)2 |
(1+ke)3 |
(1+ke)n |
||||||
|
|
|
|
|
||||||
¾ If the dividend is assumed to be constant to infinity this becomes the present value of a perpetuity which simplifies to:
Po |
= |
D |
ke |
¾This version of the model can be used to determine the theoretical value of a share which pays a constant dividend e.g. a preference share or an ordinary share in a zero growth company.
2.3Constant growth in dividends
¾If dividends are forecast to grow at a constant rate in perpetuity, where g = growth rate
Po =
where
D0(1 +g) |
= |
D1 |
|
ke −g |
ke −g |
||
|
Do = most recent dividend D1 = dividend in one year
The formula is published in the exam in the following format:
Po = |
|
DO (1+ g) |
|
|
(re − g) |
|
|
|
|
||
where |
re = required return of equity investors i.e. ke |
||
2.4Assumptions behind the dividend valuation model
¾rational investors
¾all investors have the same expectations and therefore the same required rate of return
¾perfect capital market assumptions, e.g.:
no transactions costs
large number of buyers and sellers of shares
no individual can affect the share price
all investors have all available information
¾dividends are paid just once a year and one year apart
¾dividends are either constant or are growing at a constant rate.
0205
SESSION 02 – SECURITY VALUATION AND THE COST OF CAPITAL
2.5Uses of the dividend valuation model
¾The model can be used to estimate the theoretical fair value of shares in unlisted companies where a quoted market price is not known.
¾However if the company is listed, and the share price is therefore known, the model can be used to estimate the required return of shareholders i.e. the company’s cost of equity finance.
Illustration 1
Suppose that a share has a current ex-div market value of 80 cents and investors expect a dividend of 10 cents per share to be paid each year as has been the case for the past few years.
Using the dividend valuation model the required return of the investors for this share can be determined:
Po |
= |
|
D |
|
|
|
ke |
||||
|
|
|
|||
80c |
= |
|
10c |
|
|
|
ke |
||||
|
|
|
|||
ke |
= |
|
10c |
|
|
|
80c |
||||
|
|
|
|||
ke |
= |
12.5% |
|||
Investors will all require this return from the share as the model assumes they all have the same information about the risk of this share and they are all rational.
If investors think that the dividend is due to increase to 15 cents each year then at a price of 80 cents the share is giving a higher return than 12.5%. Investors will therefore buy the share and the price will increase until, according to the model, the value will be:
Po |
= |
15c |
= |
120 cents |
0.125 |
Alternatively suppose that the investors' perception is that the dividend will remain at 10 cents per share but that the risk of the share has increased thereby requiring a return of 15%. If the share only gives a return of 12.5% (on an 80 cents share price) then investors will sell and the price will fall. The fair value of the share according to the model will be:
Po |
= |
10c |
= |
66.7 cents |
|
0.15 |
|||||
|
|
|
|
0206

SESSION 02 – SECURITY VALUATION AND THE COST OF CAPITAL
2.6Practical factors affecting share prices
¾The dividend valuation model gives a theoretical value, under the assumptions of the model, for any security.
¾In practice there will be many factors other than the present value of cash flows from a security that play a part in its valuation. These are likely to include:
interest rates
market sentiment
expectation of future events
inflation
press comment
speculation and rumour
currency movements
takeover and merger activity
political issues.
The dividend valuation model helps us to understand how a change in these variables should affect the market value of the security.
¾Share prices change, often dramatically, on a daily basis. The dividend valuation model will not predict this, but will give an estimate of the underlying fair value of the shares.
3COST OF EQUITY
3.1Shareholders required rate of return
¾The basic dividend valuation model is:
Po = |
D |
|
ke |
||
|
¾This can be rearranged to find ke:
ke = |
D |
|
Po |
||
|
¾If ke is the return required by the shareholders in order for the share value to remain constant then ke is also the return that the company must pay to its shareholders. Therefore ke also equates to the cost of equity of the company.
¾Therefore the cost of equity for a company with a constant annual dividend can be estimated as the dividend divided into the ex-div share price i.e. the dividend yield.
¾The ex-div market value is the market value of the share assuming that the current dividend has just been paid. A cum-div market value is one which includes the value of the dividend just about to be paid. If a cum-div market value is given then this must be adjusted to an ex div market value by taking out the current dividend.
0207

SESSION 02 – SECURITY VALUATION AND THE COST OF CAPITAL
Example 1
A company’s shares have a market value of $2.20 each. The company is just about to pay a dividend of 20c per share as it has every year for the last ten years.
What is the company’s cost of equity?
Solution
3.2Dividend with constant growth
¾The model can also deal with a dividend that is growing at a constant annual rate of g.
¾The formula for valuing the share is as seen earlier:
Po |
= |
|
D0 (1 + g) |
= |
D1 |
|
|
ke −g |
|
ke −g |
|||
where |
D0 |
= most recent dividend |
|
|
||
|
D1 |
= dividend in one year |
|
|
||
¾Rearranged this becomes
k = |
D0(1 +g) |
+g |
|
||
e |
Po |
|
|
|
where g = growth rate (assumed constant in perpetuity).
where Po = ex div market value
¾Therefore the cost of equity = dividend yield + estimated growth rate
0208

SESSION 02 – SECURITY VALUATION AND THE COST OF CAPITAL
Illustration 2
Do = 12c, Po (ex div) = $1.75, g = 5%.
What is ke?
ke |
= |
0.12 (1.05) |
+ 0.05 |
|
1.75 |
||||
|
|
|
=12.2%
¾The growth rate of dividends can be estimated using either of two methods.
Two methods
Extrapolation of |
Gordon’s growth model |
past dividends |
|
3.3Growth from past dividends
¾Look at historical growth and use this to predict future growth. If you have specific information about future growth, use that.
If dividends have grown at 5% in each of the last 20 years, predicted future growth = 5%.
Uneven but steady growth – take an average overall growth rate.
Discontinuity in growth rate – take the most recent evidence.
New company with very high growth rates – take care! It is unlikely to produce such high growth in perpetuity.
No pattern – do not use this method (i.e. dividends up one year, down the next).
0209

SESSION 02 – SECURITY VALUATION AND THE COST OF CAPITAL
Example 2
A company has paid the following dividends over the last five years.
|
Cents per share |
19X0 |
100 |
19X1 |
110 |
19X2 |
125 |
19X3 |
136 |
19X4 |
145 |
Estimate the growth rate and the cost of equity if the current (19X4) ex div market value is $10.50 per share.
Solution
3.4Gordon’s growth model
¾Gordon’s growth model states that growth is achieved by retention and reinvestment of funds.
g = bre
b= proportion of profits retained
re = |
return on equity |
¾Take an average of r and b over the preceding years to estimate future growth.
re |
= |
Profit after tax |
= |
Profit after tax |
||
Shareholders'funds |
Net assets |
|||||
|
|
|
||||
b |
= |
Retained profit |
|
|
||
|
|
|
|
|||
Profit after tax |
|
|
||||
|
|
|
|
|||
¾These figures can be obtained from the statement of financial position (balance sheet) and income statement.
0210