

Pressure unites two regimes of fluid breakup
Bubbles of xenon near the gas’s critical point are so dense that they behave like drops of water, not bubbles of air.
When a water droplet falls from a leaky faucet, it dangles from a narrow conical filament of water that lengthens and narrows before it finally breaks. Socalled droplet pinch-off has been extensively studied,1 both theoretically and experimentally—in part due to its applicability to processes such as ink-jet printing but also because of its interest to mathematical physicists (see PHYSICS TODAY, September 1997, page 11). It was long thought that the reverse setup—a bubble of air released from an underwater nozzle—would behave in much the same way. But that turns out not to be the case: Bubbles and droplets differ qualitatively in both the shape of the pinch-off region and the time dependence of the process.2
Now, Justin Burton and Peter Taborek of the University of California, Irvine, have produced both bubble-like and droplet-like behavior in a single continuously variable system: xenon bubbles in liquid water over a range of pressures (and hence xenon densities).3 They’ve thus been able to observe the transition between bubble and droplet pinch-off, which has previously eluded both theoretical and experimental treatment. And they’ve found that the boundary between the bubble and droplet regimes is sharp.
The pinch-off of liquid droplets is driven by surface tension and opposed by either the liquid’s viscosity or its inertia. When the inertial contribution dominates the viscous one, as it does in water droplets at length scales of more than a few nanometers, viscosity does not matter at all. For water and other inviscid (or low-viscosity) fluids, the width w at the neck of the pinch-off region depends only on surface tension γ, density ρ, and time t—and must therefore be proportional to (γt2/ρ)1/3, because no other combination of those three quantities has units of length. That dimensional-analysis argument is borne out by experiments, which have verified that w ~ t2/3, where t = 0 at the moment the droplet breaks away, so w decreases as t becomes less negative.
For water droplets in air or air bubbles in water, the surface tension at the air–water interface is the same. The sur- face-tension mechanism might therefore be expected to also produce a scaling exponent of 2⁄3 for bubble pinch-off. But it doesn’t, because there is another
|
|
|
|
|
|
|
|
a |
|
5 mm |
|
|
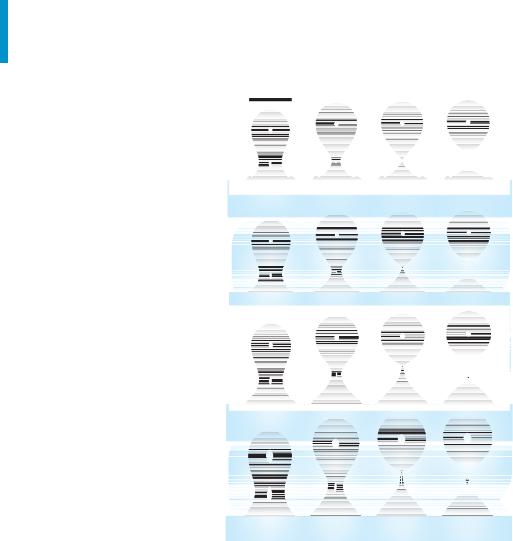
Figure 1. Time-sequence |
|
|
|
|
|
|
photographs of xenon bub- |
|
|
|
|
|
|
bles released from an |
|
|
|
|
|
|
underwater nozzle. (a) At a |
|
|
|
|
|
|
pressure below 1 atmos- |
|
|
|
|
|
|
phere, the ratio D of the |
|
|
|
|
|
|
xenon density to water den- |
|
|
|
|
|
|
sity is 0.0007, and the xenon |
|
|
|
|
|
|
|
|
b |
bubble looks like an air |
||||
|
|
|
|
|
|
bubble, with the neck of the |
|
|
|
|
|
|
pinch-off region displaying |
|
|
|
|
|
|
top-to-bottom symmetry. |
|
|
|
|
|
|
When the pressure is |
|
|
|
|
|
|
increased so that (b) |
|
|
|
|
|
|
D = 0.05 and (c) D = 0.2, the |
|
|
|
|
|
|
asymmetry of the pinch-off |
|
c |
region is increasingly more |
||||
|
pronounced. (d) At a pres- |
|||||
|
|
|
|
|
|
|
|
|
|
|
|
|
sure of 68 atmospheres, |
|
|
|
|
|
|
D = 0.7, and the xenon bub- |
|
|
|
|
|
|
ble looks like an upside- |
|
|
|
|
|
|
down water droplet, with a |
|
|
|
|
|
|
pronounced neck at the |
|
|
|
|
|
|
instant before pinch off. The |
|
d |
system is illuminated from |
||||
|
|
|
|
|
|
behind, causing the xenon |
|
|
|
|
|
|
to appear black on a light- |
|
|
|
|
|
|
colored background. The |
|
|
|
|
|
|
spots in the middle of the |
|
|
|
|
|
|
images are optical artifacts |
|
|
|
|
|
|
due to lensing. (Adapted |
|
|
|
|
|
|
from ref. 3.) |
|
|
|
|
|
|
|
mechanism that works faster. Surface tension helps to start the pinch-off process, but once it gets going, it’s driven by the pressure difference between the air bubble and the surrounding water. Theory predicts a scaling exponent of 1⁄2, but with a slowly converging logarithmic correction. As a result, over the time scales probed by experiments, the exponent appears to be about 0.57.
The two air–water systems are special cases of one inviscid fluid breaking up inside another. The continuum of possibilities can be parameterized by D, the ratio of the inner fluid’s density to the outer fluid’s—for bubbles, D is nearly zero, and for droplets, nearly infinite. When D = 1, theory predicts droplet-like behavior,4 so the boundary between the bubble and droplet regimes must occur at D < 1. In 2003 David Leppinen and John Lister, then both at the University of Cambridge in
the UK, simulated inviscid pinch-off over a range of D values.5 For D > 0.16, their simulations followed the dropletlike surface-tension mechanism. For smaller values of D, the mechanism was the same, but the simulated fluids were subject to instabilities that produced jagged fractal-like shapes in the fluid interface.
An experimental search for the bub- ble–droplet transition requires at least one fluid whose density can be continuously varied over a wide range. Liquids don’t fit the bill. And most gases require dangerously high pressures to reach the necessary densities—if they don’t condense into liquids first. Xenon is suitable because its critical point lies at around 17 °C, which means that at room temperature it does not undergo a gas–liquid phase transition, and its density increases faster under pressure than an ideal gas’s would. At 68 atmos- pheres—the highest practical pressure
14 January 2009 Physics Today |
www.physicstoday.org |

for the experiment, since above that pressure xenon forms a solid clathrate with water—xenon is 70% as dense as water, whereas an ideal gas with xenon’s mass would be just 36% as dense as water.
Housing the bubbles
Burton and Taborek built their own high-pressure xenon source from which they could bubble the gas into a stainless steel cell filled with water. But taking highly magnified pictures of the xenon formations under such large pressures was a challenge. The camera needed to sit within 2 cm of the bubbles and yet remain outside the cell. So the researchers fitted their cell with two parallel sapphire windows—one for illuminating the bubbles and the other for imaging them—which could withstand the pressure but were less than a centimeter thick.
The available range of densities from D ≈ 0 to D = 0.7 allowed the researchers to observe both bubble-like and droplet-like pinch-off behavior, as shown in figure 1. “We were initially hoping to see evidence of the instabilities that were predicted in the numerical simulations,” says Burton. But the droplet profiles they observed, as far as they could tell, were perfectly smooth. The researchers speculate that perhaps the instabilities were damped out by viscous effects on the small but nonzero viscous length scales of xenon and water.
The shapes of the pinch-off regions
α |
0.68 |
|
|
|
|
|
|
Figure 2. The scaling |
|
|
|
|
|
|
|
exponent α describes the |
|
EXPONENT |
0.66 |
|
|
|
|
|
|
|
|
|
|
|
|
|
|||
|
|
|
|
|
|
pinch-off neck width w as a |
||
0.64 |
|
|
|
|
|
|
function of time t: w is pro- |
|
0.62 |
|
|
|
|
|
|
portional to tα. In the experi- |
|
|
|
|
|
|
|
|||
|
|
|
|
|
|
ments on xenon bubbles in |
||
SCALING |
0.60 |
|
|
|
|
|
|
water, when the xenon-to- |
|
|
|
|
|
|
water density ratio was less |
||
|
|
|
|
|
|
|
||
0.58 |
|
|
|
|
|
|
than about 0.25, α = 0.57, |
|
0.56 |
|
|
|
|
|
|
the same as for air bubbles |
|
|
|
|
|
|
|
|
||
|
|
|
|
|
|
|
in water. At higher density |
|
|
|
|
|
|
|
|
|
|
|
|
|
|
|
|
|
|
|
|
0.001 |
0.01 |
0.1 |
|
|
1 ratios, α = 2⁄3, the same as for |
||
|
|
|
DENSITY RATIO |
|
water droplets in air. The |
|||
|
|
|
|
|
|
|
|
error bars are much larger in |
the droplet-like regime because the xenon bubble sometimes obscures the narrowest point of the pinch-off region. Even subject to that limitation, the sharp boundary between bubble-like and droplet-like scaling is evident. (Adapted from ref. 3.)
appeared to vary continuously from the symmetric profile of the bubble-like regime to the tapered filament of the droplet-like regime. But the scaling exponent that describes the neck width as a function of time was another story, as shown in figure 2. “You might expect to see a smooth, linear transition from 0.57 to 2⁄3,” explains Burton. “But that’s not the case.” To the researchers’ surprise, what they saw instead was a nearly constant value of 0.57 for low values of D, a nearly constant value of 0.66 for high values of D, and an abrupt transition near D = 0.25.
Theoretical understanding of Burton and Taborek’s results—why the transition is so sharp and why it occurs at D = 0.25—has yet to come. Burton and
Taborek themselves are now working on numerical simulations to help them understand what they’ve seen. But they’re also looking experimentally at droplet and bubble formation in electrically charged fluids and non-Newton- ian fluids—further exploring the zoo of pinch-off possibilities.
Johanna Miller
References
1.J. Eggers, E. Villermaux, Rep. Prog. Phys. 71, 036601 (2008).
2.J. Eggers et al., Phys. Rev. Lett. 98, 094502 (2007).
3.J. C. Burton, P. Taborek, Phys. Rev. Lett. 101, 214502 (2008).
4.Y.-J. Chen, P. H. Steen, J. Fluid Mech. 341, 245 (1997).
5.D. Leppinen, J. R. Lister, Phys. Fluids 15, 568 (2003).
These items, with supplementary material, first appeared at http://www.physicstoday.org.
Measuring soil moisture with cosmic-ray neutrons. Through its influence on evaporation rates, humidity levels, and other factors, the moisture content of soil has a significant impact on weather. Accurate measurements of that content, though important for meteorological, hydrological, and ecological forecasting, are difficult to make. Extrapolating point measurements to larger areas is inaccurate, and satellite-based remote-sensing methods are hindered by ground cover, surface roughness, and other limitations. A team from the University of Arizona and the Southwest Watershed Research Center in Tucson has shown that just above the ground surface, so-called fast neutrons with energies on the order of an MeV are quantifiably correlated with soil moisture and thus provide a noninvasive means for measuring the average moisture levels over regions several hundred meters wide and tens of centimeters deep. The neutrons are generated by cosmic rays. Upon collision with atmospheric nuclei, cosmic rays create showers of high-energy secondary particles, and those that reach Earth’s surface can penetrate it, collide with nuclei there, and pro-
duce among their debris fast neutrons, some of which escape back into the atmosphere. Marek Zreda and colleagues discovered that hydrogen, mostly found in water, dominates soil’s ability to moderate fast neutrons and that a strong inverse correlation, independent of soil chemistry, exists between moisture content and the intensity of the fast neutrons that escape out of the ground. The team demonstrated that with an independent measurement of the moisture
|
CONTENT,WT.% |
20 |
|
|
Cosmic-ray probe |
|||||
SOILMOISTURE |
|
|
|
Soil samples |
|
|
||||
15 |
|
|
|
|
|
|
|
|
||
10 |
|
|
|
|
|
|
|
|
||
5 |
|
|
|
|
|
|
|
|
||
|
|
|
|
|
|
|
|
|
||
|
|
0 |
|
|
|
|
|
|
|
|
SOILMOISTURE |
CONTENT,VOL.% |
25 |
|
|
|
|
|
|
TDR |
|
20 |
|
|
|
|
|
|
|
|
||
15 |
|
|
|
|
|
|
|
|
||
10 |
|
|
|
|
|
|
|
|
||
|
|
|
|
|
|
|
|
|
||
|
|
5 |
|
|
|
|
|
|
|
|
|
(mm) |
40 |
|
|
|
|
|
|
|
|
|
|
|
|
|
|
|
|
|
|
|
|
RAINFALL |
20 |
|
|
|
|
|
|
|
|
|
0 |
8 |
9 |
10 11 12 |
1 |
2 |
3 |
4 |
5 |
|
|
|
7 |
||||||||
MONTH IN 2007–08
www.physicstoday.org |
January 2009 Physics Today 15 |

content for calibration, a neutron detector a few meters above the ground can give precise measurements of soil moisture on the time scale of minutes to a few hours. As the figure shows, the hourly soil moisture determined by a cosmic-ray neutron detector (top) agrees with that determined by time-domain reflectometry probes (middle) and with the monitored daily precipitation (bottom). (M. Zreda et al., Geophys. Res. Lett. 35, L21402, 2008, doi:10.1029/2008GL035655.) —RJF
Signs of dark matter? Two groups of cosmic-ray observers have reported unexpectedly large fluxes of high-energy electrons and positrons. Those excesses suggest either that there are undiscovered astrophysical sources such as radio-quiet pulsars surprisingly nearby or that the positrons and electrons are annihilation products of WIMPs—weakly interacting dark-matter particles hundreds of times more massive than the proton. Standard cos-
|
|
|
|
mology |
pre- |
|
) |
|
|
|
|||
2 |
1000 |
|
|
dicts |
|
that |
GeV |
|
|
|
|||
|
|
|
|
|||
|
|
|
dark |
|
non- |
|
−1 |
|
|
|
|
||
|
|
|
baryonic mat- |
|||
sr |
|
|
|
|||
−1 |
|
|
|
ter dominates |
||
s |
|
|
|
|||
−2 |
100 |
|
|
the |
material |
|
(m |
|
|
||||
|
|
|
content |
of |
||
e |
|
|
|
|||
E |
|
|
|
the |
cosmos. |
|
dN/d |
|
|
|
|||
|
|
|
But |
its |
con- |
|
|
|
|
stituent parti- |
|||
3.0 e |
10 |
|
|
|||
E |
10 |
100 |
1000 |
cles have yet |
||
|
||||||
|
|
ENERGY (GeV) |
to be identi- |
|||
|
|
|
|
fied. The ATIC |
||
|
|
|
|
|||
balloon collaboration, led by John Wefel of Louisiana State University, reports a significant enhancement in the spectrum of cos- mic-ray electrons, peaking near 600 GeV (see the figure). The peak suggests that 600-GeV WIMPs of the kind predicted by extradimensional extensions of standard particle theory might be annihilating with each other to create e+e– pairs in very dense concentrations of dark matter not far from our solar system. The ATIC detector cannot distinguish positrons from the much more abundant cosmic-ray electrons. But the magnetic spectrometer aboard the orbiting PAMELA satellite can. Positrons are routinely produced in collisions between cosmic rays and ordinary interstellar matter. The ratio of such positrons to cosmic-ray electrons was expected to fall steeply with increasing energy. Instead, the PAMELA collaboration, led by Piergiorgio Picozza of the University of Rome “Tor Vergata,” reports that the positron fraction grows steadily with energy from 10 GeV to 100 GeV. So it appears that there must be some additional source of high-energy positrons. The collaboration will continue taking data for at least another year, hoping to find spectral structure suggestive of WIMPs or anisotropy pointing to a nearby astrophysical source. Both WIMP annihilations and pulsars are expected to produce high-energy gamma rays. So for the moment, all eyes are on the recently launched Fermi Gamma-ray Space Telescope (originally called GLAST), which is designed to pinpoint gamma-ray sources and spectral features but can also confirm the ATIC electron result with higher statistics. (J. Chang et al., ATIC collaboration, Nature 456, 362, 2008; O. Adriani et al., PAMELA collaboration, http://arxiv.org/ abs/0810.4995.) —BMS
Ultrasound’s role in wire bonding. In almost all integrated circuit chips, the wires that connect the internal circuitry to the external packaging are attached by a process called wire bonding. In that technique, ultrasound is used in combination with heat and pressure to weld the tip of the wire, usually gold, to the surfaces to be connected. It’s been known for 40 years that ultra-
sound can make metals easier to work, an effect called acoustic softening. But the process of working the metal can have its own impact on the metal’s hardness. Thus it’s been difficult until now to get a clear picture of what’s going on, and wire bonding has remained a largely empirical process. By placing gold microballs under different levels of applied force and ultrasound and measuring their resulting deformation, a team of researchers from the University of Waterloo in Canada and Tsinghua University in Beijing has succeeded in separating the softening contributions of the ultrasound from the effects of the mechanical force. The researchers were also able to quantify the residual effects of ultrasound on gold, and they found residual softening that increased with greater ultrasound amplitude above a certain threshold. They attribute the residual effects to the net balance between ultrasound’s dynamic annealing and its potential opposing effect on activating and multiplying dislocations. (I. Lum et al., J. Appl. Phys., in press.) —RJF
A catalyst caught in the act. Catalysts are ubiquitous in today’s chemical industry, but there remains much to be learned about the specific mechanisms by which many of them work. Though such knowledge could lead to improved or new catalysts, obtaining atomic-scale information about in situ chemical changes in a hot environment at atmospheric pressure has presented a difficult challenge. A Dutch team led by Frank de Groot and Bert Weckhuysen of Utrecht University has recently demonstrated the potential of a new approach to imaging catalysts at work: scanning transmission x-ray microscopy. As a catalyst and reactants interact, the valence states and chemical bonding of the participating atoms evolve. STXM detects those changes by looking at the absorption of x rays by the atoms’ inner electron shells. The researchers demonstrated the technique by looking at the iron-based catalyst for the Fischer–Tropsch process, in which hydrogen and carbon monoxide are converted to hydrocarbon chains. Soft x rays used in STXM are strongly attenuated in matter, so the research team used a nanoreactor of thickness 50 μm; the reactor was connected to gas lines and mounted on an adapter that was scanned in 35-nm steps through the focus of a monochromatic x-ray beam. In that way, two-dimensional absorption maps at various x-ray energies could be recorded.
1
2
50 nm
The researchers paid particular attention to energies near the absorption edges of carbon, oxygen, and iron. Analyzing the maps they obtained, the researchers could extract the carbon hybridization states and determine the extent to which the iron atoms, which started off in iron oxide, had been reduced, formed other oxides, or reacted with the silicon dioxide substrate or with carbon. The figure maps the distribution of the inferred iron compounds, each represented by a different color. With better optics and detection techniques, the team hopes to
16 January 2009 Physics Today |
www.physicstoday.org |
improve on its current 40-nm resolution and perhaps provide time-resolved and 3D imaging of complex chemical reactions in situ. (E. de Smit et al., Nature 456, 222, 2008.) —RJF
In-ground carbon dioxide capture. As concern over global warming continues to grow, pressure and funding are increasing to find ways to reduce the growth and, in time, the actual levels of atmospheric carbon dioxide (see PHYSICS TODAY, August 2008, page 26). Peter Kelemen and Jürg Matter of Columbia University’s Lamont-Doherty Earth Observatory have proposed a new approach for CO2 sequestration: accelerating the natural carbonation of exposed mantle rock. In many places around the globe—perhaps most dramatically in Oman—sections of the upper mantle have been raised through subduction or tectonic spreading. The resulting outcrops, termed ophiolites, are rich in peridotite, a rock primarily composed of the minerals olivine and pyroxene. (For more on the Oman ophiolite, see PHYSICS TODAY, January 2005, page 21.) Strongly out of chemical equilibrium with the atmosphere, the mantle rock naturally reacts with water and CO2 to form silicates, carbonates, and iron oxides. Kelemen and Matter find that atmospheric CO2 reacts with peridotite surprisingly quickly, at a rate of about 4 × 10⁷ kg/yr for the 500-km-long Oman ophiolite. The researchers suggest several options for boosting that reaction rate even higher, starting with increasing the interaction volume by drilling and fracturing the peridotite. Some fracturing will happen spontaneously as the hydration and carbonation reactions expand the rock volume and give off heat. When the two scientists incorporate into their model the effects of raising the CO2 concentration near the rock and elevating the peridotite temperature, they estimate a potential increase of 109 in the reaction rate, or 2 × 10⁹ tons of CO2 captured and sequestered each year per cubic kilometer of ophiolite. The researchers call for further modeling and field testing of what could be a permanent storage solution. (P. B. Kelemen, J. Matter, Proc. Natl. Acad. Sci. USA 105, 17295, 2008.) —RJF
Vortices spontaneously arise as a Bose–Einstein condensate forms. In an emptying bathtub, water forms a whirlpool around the drain. But circular flow can’t persist to the very center of the vortex; there must be a water-free funnel. In 1985 Wojciech Zurek, following on work of Tom Kibble, suggested that “topological defects” analogous to the whirlpool could be generated spontaneously in a system undergoing a second-order phase transition. For a fast enough process in a large enough system, small regions independently change state, being unable to communicate with other, relatively far off regions. That independence allows parameters such as the quantum-mechanical phase angle
to arrange themselves in vortex structures. Researchers have seen spontaneous vortex formation in, for example, superfluid helium-3, nonlinear optical systems, and superconductors (see the article by Kibble, PHYSICS TODAY, September 2007, page 47). Now a new system can be added to the list: the Bose–Einstein condensate. Deliberately inducing a vortex in a BEC is nothing new, but recent joint experimental work at the University of Arizona and numerical work at the University of Queensland in Aus-
tralia represents the first study of spontaneous vortex formation in that particularly clean system. In the experiment, Chad Weiler and colleagues tweaked standard procedures to maximize the chance of their observing spontaneously formed vortices. After a trapped atomic gas transitioned to a BEC over the course of a few seconds, the group removed the trapping potential and imaged the escaping condensate. The vortices are revealed by dark, zerodensity spots in the figure; the rightmost image shows two vortices, the others a single vortex. Continuing experiment and simulation together, Weiler and colleagues hope, will shed light on the universality of spontaneous topological defect formation in phase transitions. (C. N. Weiler et al., Nature 455, 948, 2008.) —SKB
Nanotube loudspeakers. In typical loudspeakers, a coil surrounds the apex of a flexible cone; when a varying current flows through the coil, the cone moves toward and away from a fixed permanent magnet and produces pressure waves we hear as sound. But researchers from Tsinghua University and Beijing Normal University have demonstrated a radically simpler loudspeaker design based on nanotubes: They showed that a thin film of nanotubes can reproduce sounds over a wide frequency range—including the full human audible range—with high sound pressure level, low total harmonic distortion, and no magnets. The team created the film by drawing nanotubes from a so-called
superaligned array grown on a wafer, a technique the group introduced six years ago (see also PHYSICS TODAY, October 2005, page 23). The resulting film, only tens of nanometers thick but up to 10 cm wide, is transparent and has a nearly purely resistive impedance. When electrodes are placed along its ends and an alternating current is applied, the film produces clear tones that can be as loud as a conventional speaker. Moreover, since the film is flexible, the nanotube speaker can be configured into arbitrary shapes or mounted onto curved substrates; the figure shows an omnidirectional cylindrical loudspeaker 9 cm in diameter and 8.5 cm high. The film can even be stretched with essentially no degradation of the sound reproduction. The researchers attribute the sound generation not to vibration but to a thermoacoustic effect first proposed nearly a century ago: Thanks to the nanotube film’s extremely low heat capacity per unit area, changes in the current flowing through the film are reflected in the film’s temperature, and those temperature changes excite pressure waves in the surrounding air. The mechanism is independent of the sign of the current, which leads to a frequency doubling of the input signal, but that drawback can be overcome by applying a constant current bias. A movie at http://blogs.physicstoday
.org/update/acoustics shows a nanotube loudspeaker being periodically stretched with almost no noticeable effect on the sound intensity. (L. Xiao et al., Nano Lett., in press, doi:10.1021/nl802750z.) —RJF
www.physicstoday.org |
January 2009 Physics Today 17 |