

The results for the growth rates calculated using the methodologies in options 1 and 2 are not identical. For the main IUS report option 2 has been used and the results shown in Figure 3.7 thus do not reflect those published in the IUS 2010 report.
4. Performance per indicator
This section will discuss static and dynamic performance for each of the indicators. In the following plots normalised scores are also displayed. Normalised scores are obtained by transforming raw data such that the minimum value equals zero and the maximum value equals one.
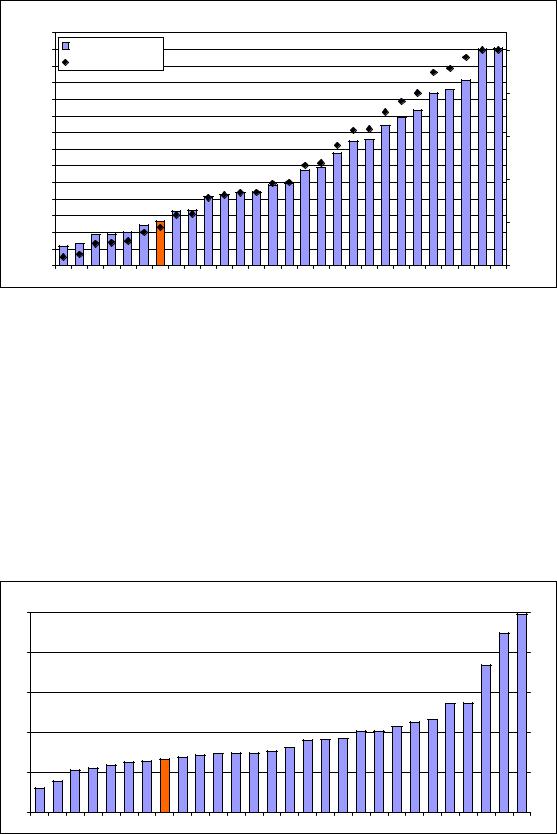
1.1.1 New doctorate graduates (ISCED6) per 1000 population aged 25-34
New doctorate graduates per 1000 population aged 25-34
|
3.5 |
|
|
|
|
|
Indicator |
1.000 |
|
|
3.0 |
Normalised scores |
|
|
|
|
|
||
|
2.5 |
|
0.800 |
Normalised scores |
Indicator |
2.0 |
|
0.600 |
|
|
|
|||
1.5 |
|
|
||
|
|
0.400 |
||
1.0 |
|
|
||
|
|
|
|
|
|
0.5 |
|
0.200 |
|
|
|
|
|
|
|
0.0 |
|
0.000 |
|
LUCYMTMKTR LV IS BGRSHUEEHR LTGRESROPL SI BECZFR IE EU IT DKNL SKNOATUKDE FI PTSECH
Statistical outliers: Sweden, Switzerland
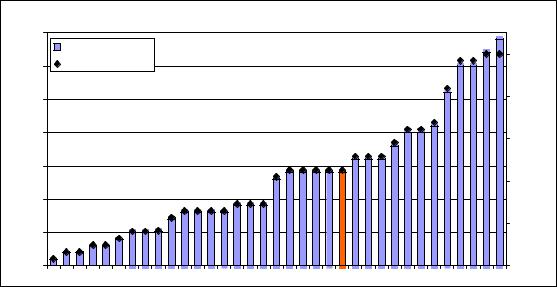
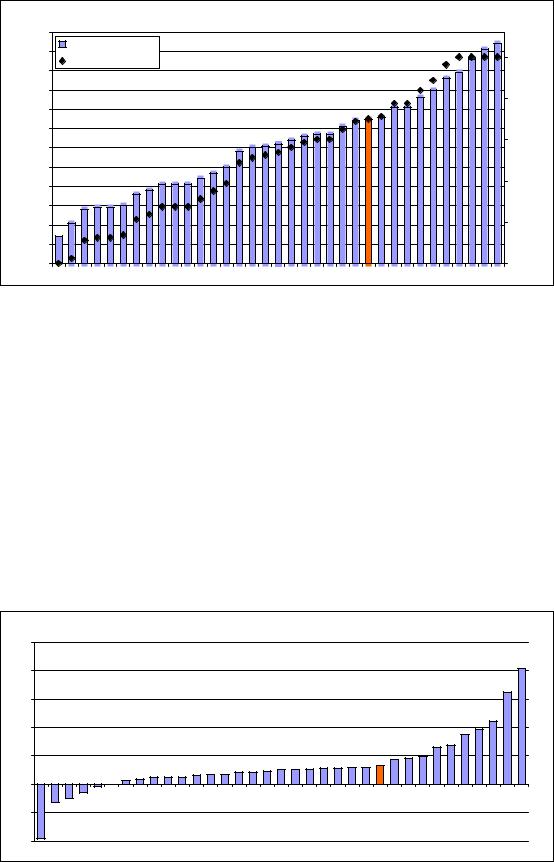
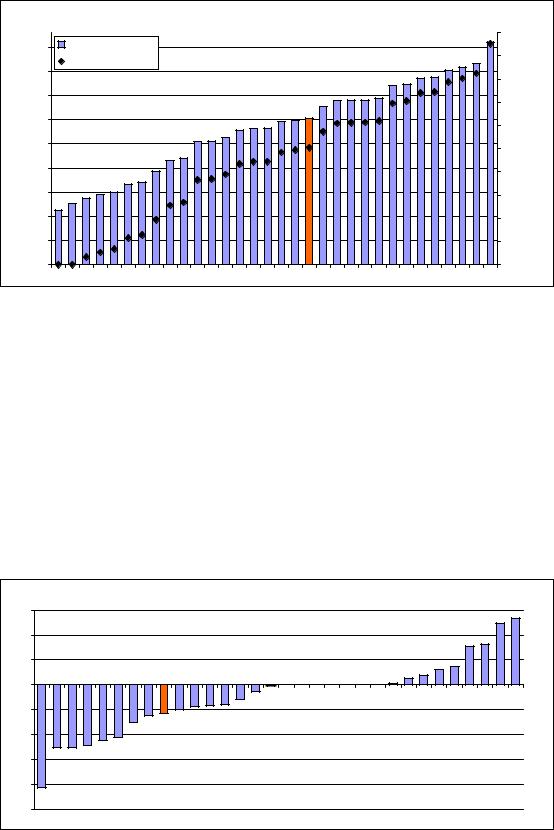
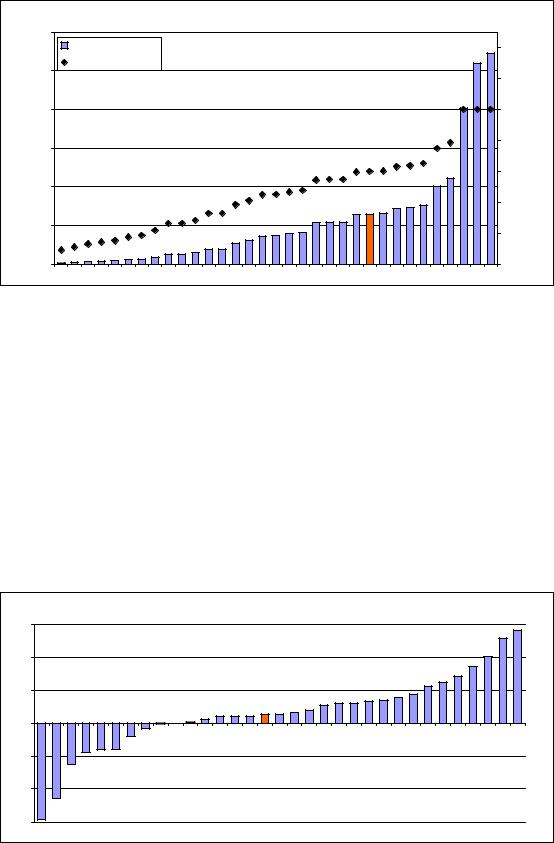
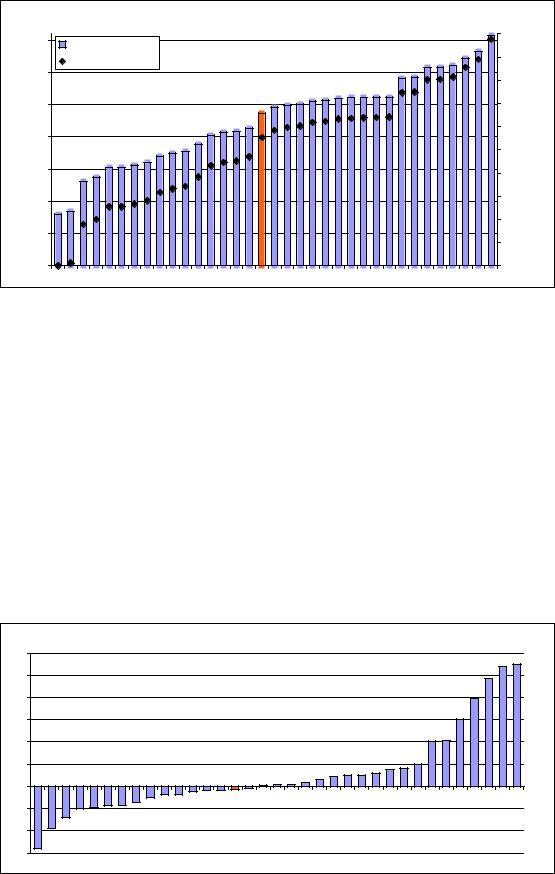
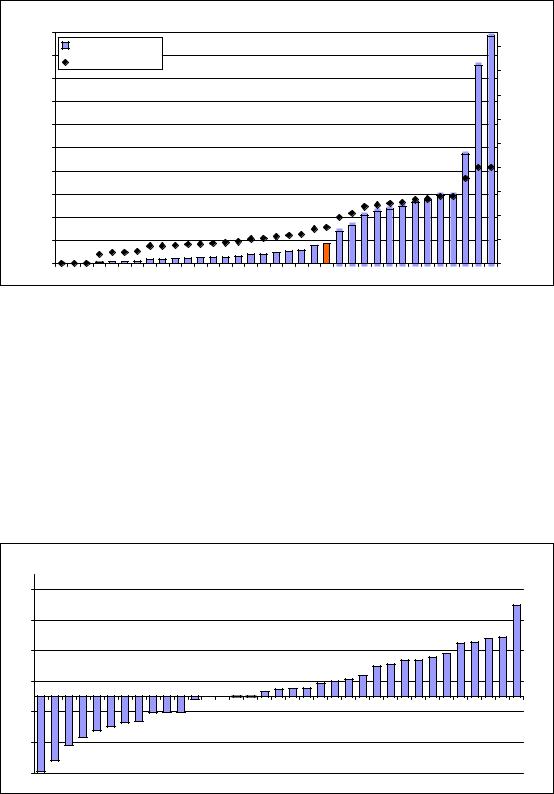
The indicator is a measure of the supply of new second-stage tertiary graduates in all fields of training. For most countries ISCED 6 captures PhD graduates only, with the exception of Finland, Portugal and Sweden where also non-PhD degrees leading to an award of an advanced research qualification are included.
In 2008 more than 3 new PhD graduates per 1000 people aged 25 to 34 were awarded in Finland, Portugal, Sweden and Switzerland. The average rate for the EU27 was 1.4 and in 8 countries this rate was below 0.5.
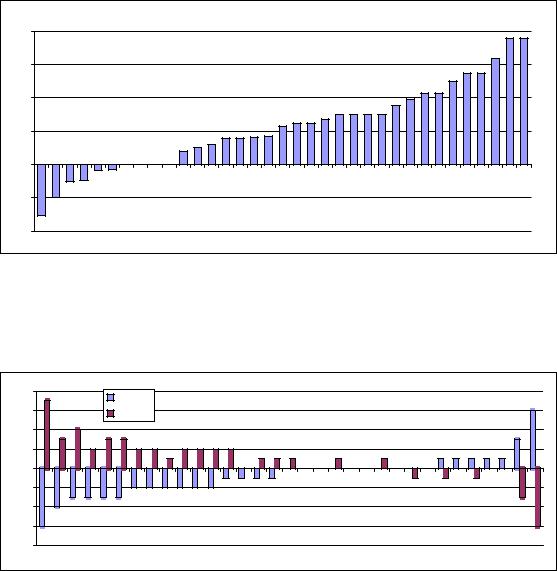
Growth performance
Malta and Iceland have been rapidly increasing their graduation rates over the last 5 years. Graduation rates have declined in Austria, Estonia, Finland, Poland, Spain and Sweden.
27
New doctorate graduates per 1000 population aged 25-34
20% |
15% |
10% |
5% |
0% |
-5% |
-10% |
EE ES PL AT FI SE EUGRCY LU SI UKRO FR HUCH DE PT BE IE RS LV LT NL HR CZ DKMK TR IT BGNOSK MT IS
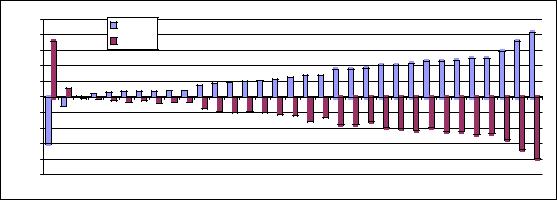
Gender balance
The graph below shows the gender balance for this indicator. In Finland and Portugal graduation rates are considerably higher among women. In 16 other countries, and particularly in Czech Republic, Germany and Switzerland, graduation rates are higher among men.
0.8 |
Female |
|
|
0.6 |
|
|
|
Male |
|
|
|
|
|
|
|
0.4 |
|
|
|
0.2 |
|
|
|
0.0 |
|
|
|
-0.2 |
|
|
|
-0.4 |
|
|
|
-0.6 |
|
|
|
-0.8 |
|
|
|
|
CH CZ DE SE NL AT DK UK IS BE FR NO GR MT HU EU LU CY TR EE HR PL SI |
IE |
IT SK LV BG LT ES RO FI PT |
28
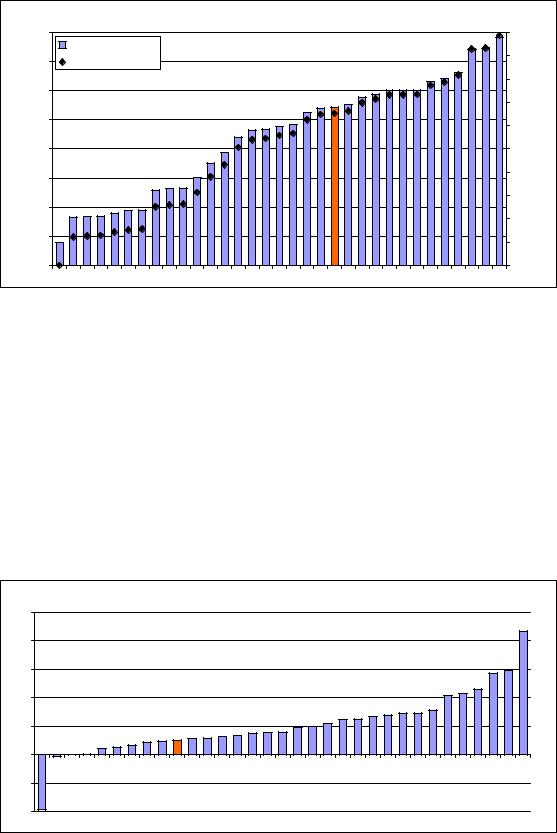
1.1.2 Percentage population aged 30-34 having completed tertiary education
Population aged 30-34 having completed tertiary education
|
50 |
Indicator |
1.000 |
|
|
45 |
0.900 |
|
|
|
Normalised scores |
|
||
|
|
|
|
|
|
40 |
|
0.800 |
|
|
35 |
|
0.700 |
Normalised scores |
Indicator |
30 |
|
0.600 |
|
25 |
|
0.500 |
||
20 |
|
0.400 |
||
15 |
|
0.300 |
||
|
|
|
||
|
10 |
|
0.200 |
|
|
5 |
|
0.100 |
|
|
0 |
|
0.000 |
|
MKTRROCZSK IT RSHRMTPT ATHUGRBGDE LV SI EU PL EEES NL LT UK IS BE FRCHSECY FI LUNODK IE
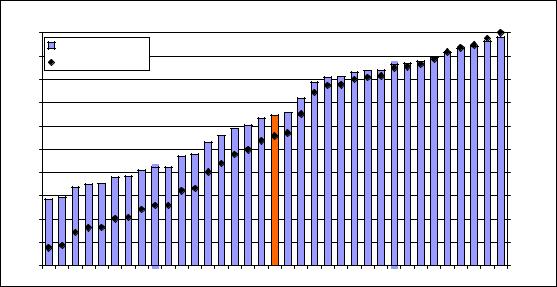
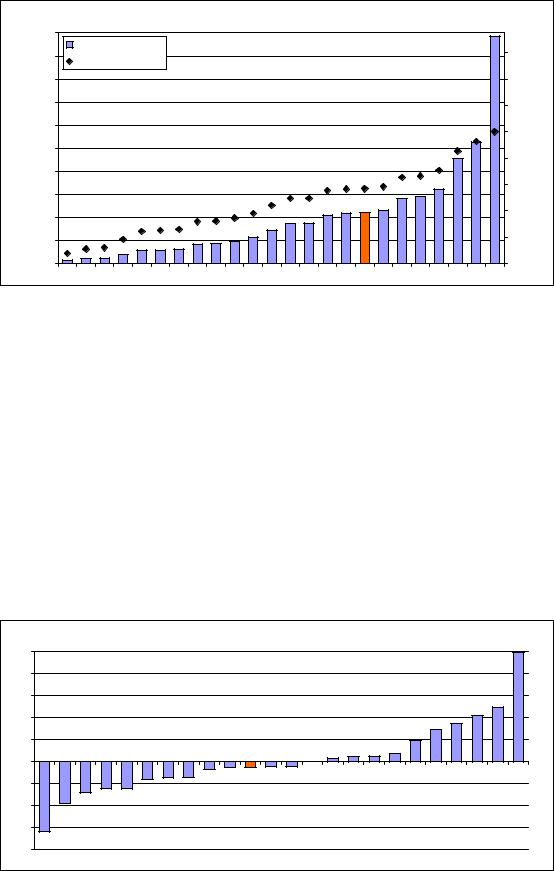
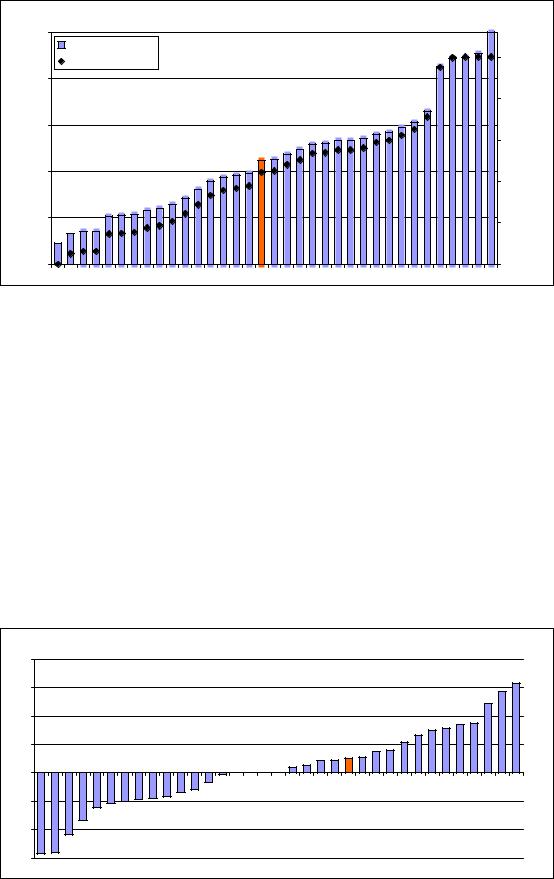
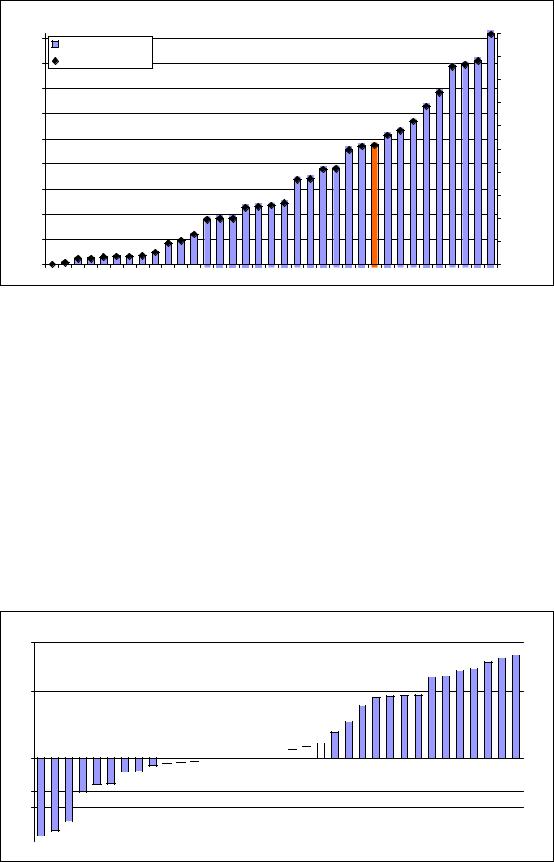
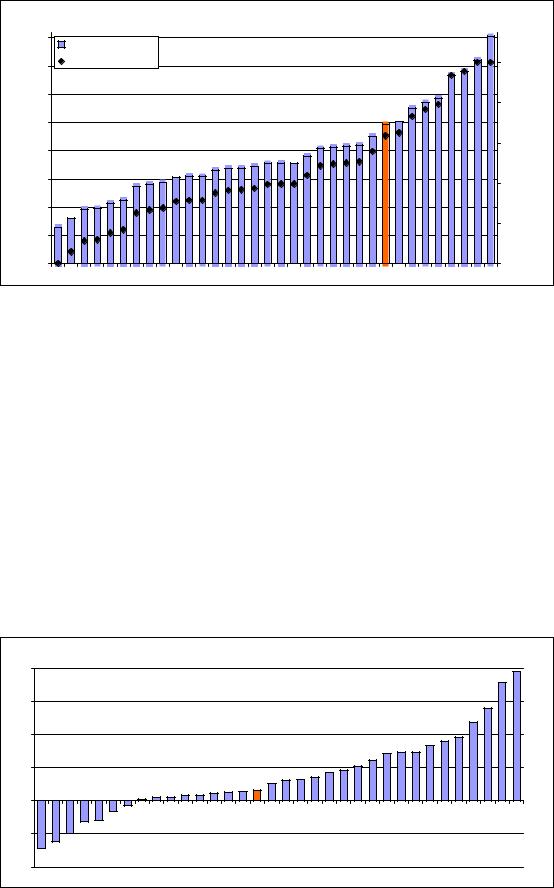
This is a general indicator of the supply of advanced skills. It is not limited to science and technical fields because the adoption of innovations in many areas, in particular in the service sectors, depends on a wide range of skills. International comparisons of educational levels however are difficult due to large discrepancies in educational systems, access, and the level of attainment that is required to receive a tertiary degree. The indicator focuses on a narrow share of the population aged 30 to 34 and it will more easily and quickly reflect changes in educational policies leading to more tertiary graduates.
On average 32% of the EU27 population between age 30 and 34 have completed tertiary education. But there is room for improvement as shown by the large differences between Member States with more than 45% having completed tertiary education in Denmark, Finland, Ireland and Luxembourg and less than 20% in Czech Republic, Italy, Romania and Slovakia.
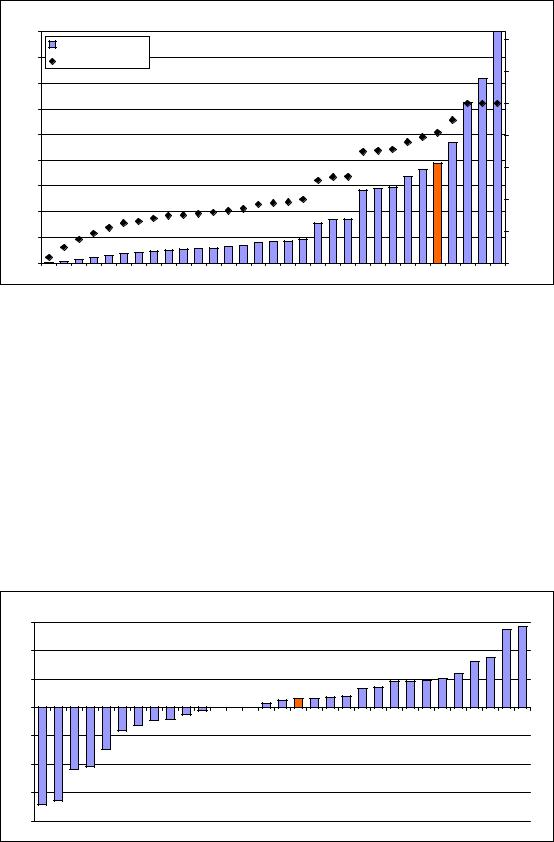
Growth performance
An increasing share of the European population aged 30 to 34 has completed tertiary education. On average this rate has been increasing at 3.6% but in some countries the increase is spectacular. In Poland and Romania it is close to 10% and in Latvia it is almost 13%. Of concern is the situation of Italy, Malta, Austria, Greece and Bulgaria for which both growth and level performances are below European average.
29
Population aged 30-34 having completed tertiary education
14% |
12% |
10% |
8% |
6% |
4% |
2% |
0% |
LU IS ES GR FI LT BE CY DK IT BGNO DE AT MT FR EU NL SE EE RS HR PT UK SK MK TR IE SI CHHU CZ PL RO LV |
Gender balance
The graph below shows the gender balance for this indicator. Only in Luxembourg, Switzerland and Turkey relatively more men have completed tertiary education. In all other countries, and particularly in Finland, Latvia and Norway, relatively more women have completed tertiary education.
15.0 |
Female |
|
10.0 |
Male |
|
|
5.0 |
|
0.0 |
|
-5.0 |
|
-10.0 |
|
-15.0 |
|
|
CH TR LU DE AT UK CZ MT RO NL SK GR HR EU PT IT FR IS CY HU ES PL BE IE EE SE DK SI BG LT NO FI LV |
30
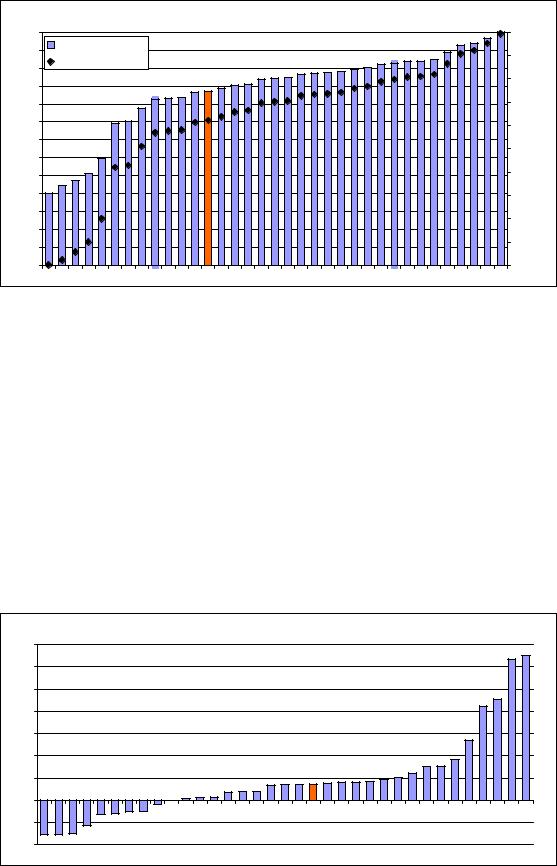
1.1.3 Percentage youth aged 20-24 having attained at least upper secondary level education
Youth aged 20-24 having attained upper secondary education
|
95 |
Indicator |
1.000 |
|
|
90 |
0.900 |
|
|
|
Normalised scores |
|
||
|
85 |
|
||
|
|
|
||
|
|
0.800 |
|
|
|
80 |
|
|
|
|
|
|
|
|
|
75 |
|
0.700 |
Normalised scores |
Indicator |
70 |
|
0.600 |
|
|
|
|||
65 |
|
0.500 |
||
60 |
|
|||
|
|
|||
55 |
|
0.400 |
||
|
|
|||
50 |
|
0.300 |
||
|
|
|
||
|
45 |
|
0.200 |
|
|
40 |
|
|
|
|
|
0.100 |
|
|
|
35 |
|
|
|
|
|
|
|
|
|
30 |
|
0.000 |
|
TRMT IS PT ESNODKDE IT NL LUROEUUKCH LVMKGREEBE FRBGHURS FI AT SE LT IE CY SI PL CZSKHR
Statistical outlier: Turkey
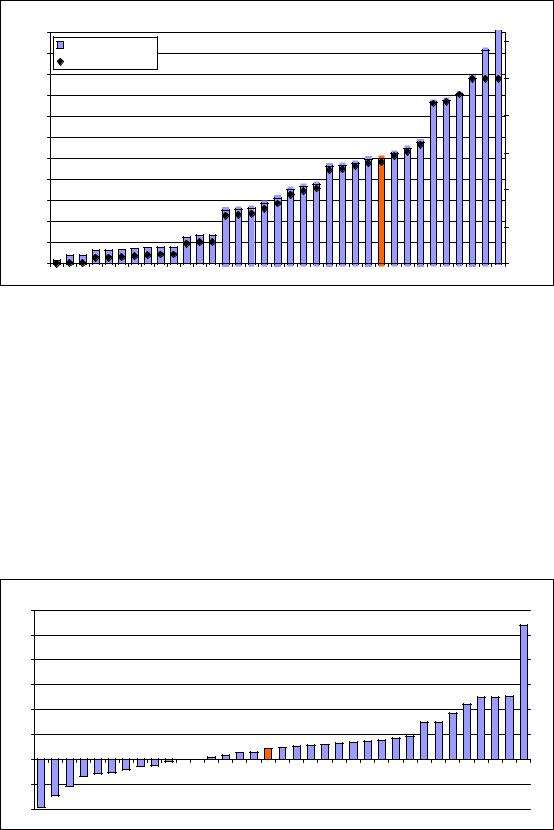
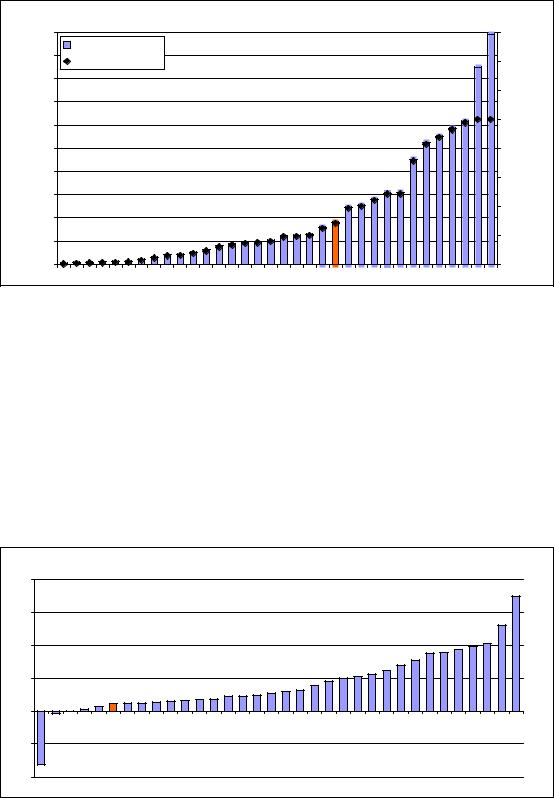
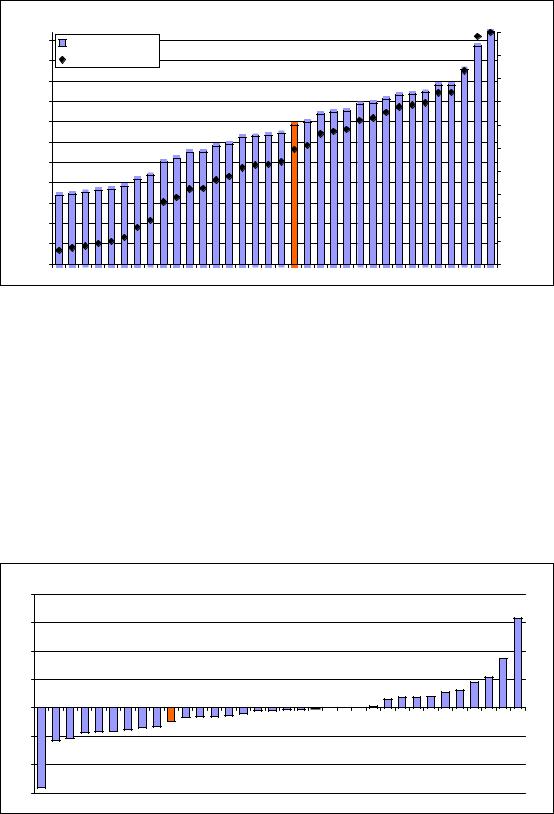
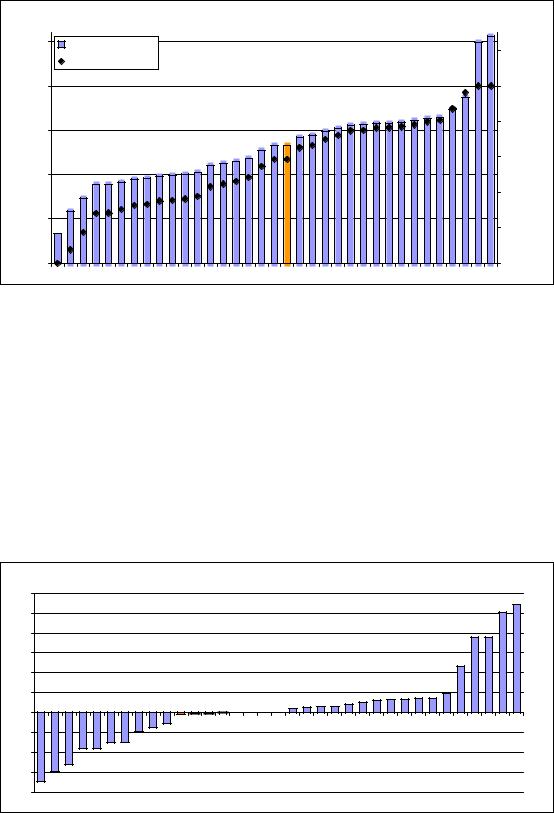
The indicator measures the qualification level of the population aged 20-24 years in terms of formal educational degrees. It provides a measure for the “supply” of human capital of that age group and for the output of education systems in terms of graduates. Completed upper secondary education is generally considered to be the minimum level required for successful participation in a knowledge-based society and is positively linked with economic growth.
Almost 80% of EU27 youth has attained at least upper secondary education. But in some countries these shares are still too low, in particular in Iceland, Malta, Portugal, Spain and Turkey where only between 50% and 60% have attained such education.
Growth performance
The youth share having attained at least upper secondary education has been growing at a high rate of more than 2% per year in Bulgaria, Cyprus, Portugal and Turkey. Worrying is the fact that this share has been declining in 8 countries, in particular in Greece, Malta and Spain.
Youth aged 20-24 having attained upper secondary education
3.5% |
3.0% |
2.5% |
2.0% |
1.5% |
1.0% |
0.5% |
0.0% |
-0.5% |
-1.0% |
ES MKMTGRSE SI LT DK EE LU AT PL FR HU LV CZ NL HR IE EU UKNO SK RS BE FI CHRODE IT IS CY BG PT TR |
31
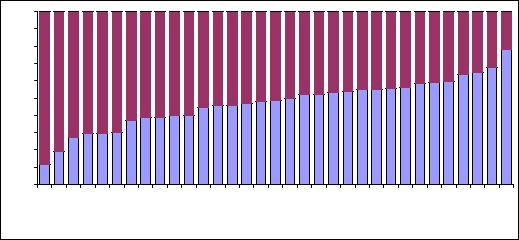
Gender balance
The graph below shows the gender balance for this indicator. In most countries, and in particular in Denmark, Portugal and Spain, relatively more women have attained at least upper secondary education. In Bulgaria, and in particular Turkey, more men have attained at least upper secondary education.
10.0 |
Female |
|
8.0 |
Male |
|
|
6.0 |
|
|
|
|
|
|
|
4.0 |
|
|
|
2.0 |
|
|
|
0.0 |
|
|
|
-2.0 |
|
|
|
-4.0 |
|
|
|
-6.0 |
|
|
|
-8.0 |
|
|
|
-10.0 |
|
|
|
|
TR BG AT CZ RO SK HR CH LU FI SE HU PL UK DE FR BE CY EU IE |
IT |
SI LT EE LV MT NL GR NO IS PT ES DK |
32
1.2.1 International scientific co-publications per million population
International scientific co-publications per million population
|
1400 |
Indicator |
|
|
|
1300 |
1.000 |
|
|
|
1200 |
Normalised scores |
|
|
|
1100 |
|
0.800 |
|
|
1000 |
|
Normalised scores |
|
|
|
|
||
|
900 |
|
|
|
Indicator |
800 |
|
0.600 |
|
700 |
|
|||
|
|
|||
600 |
|
0.400 |
||
500 |
|
|||
400 |
|
|
||
|
|
|
|
|
|
300 |
|
0.200 |
|
|
200 |
|
|
|
|
|
|
|
|
|
100 |
|
|
|
|
0 |
|
0.000 |
|
|
|
RO LV PL BG LT MT EU HU SK IT CZ GR ES PT EE FR DE CY SI LU UK IE AT BE NL FI DK SE |
|
|
Statistical outliers: Denmark, Sweden
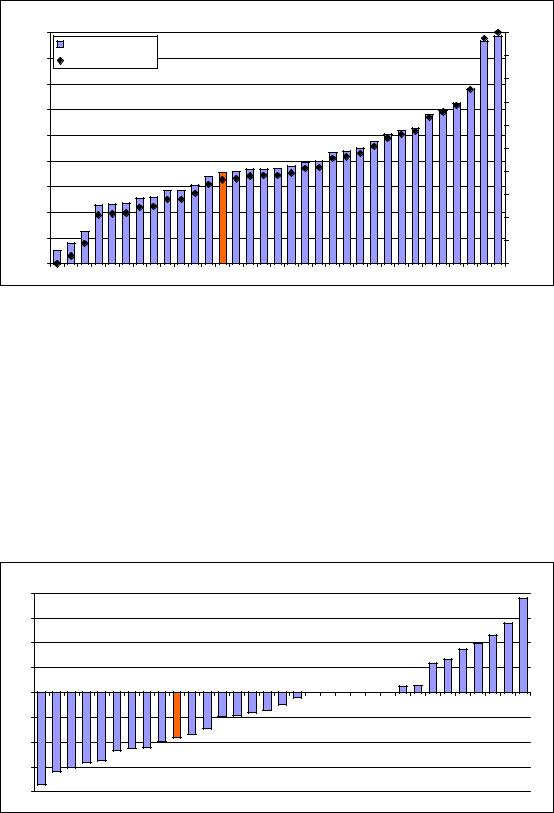
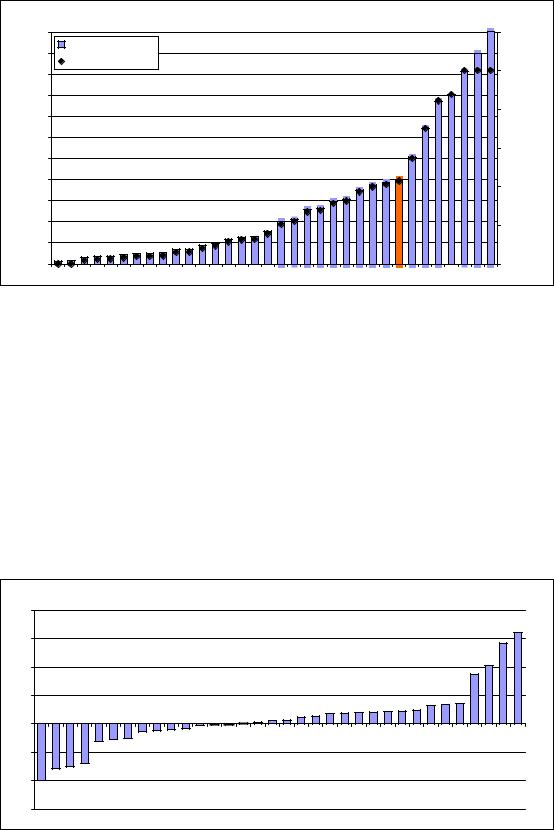
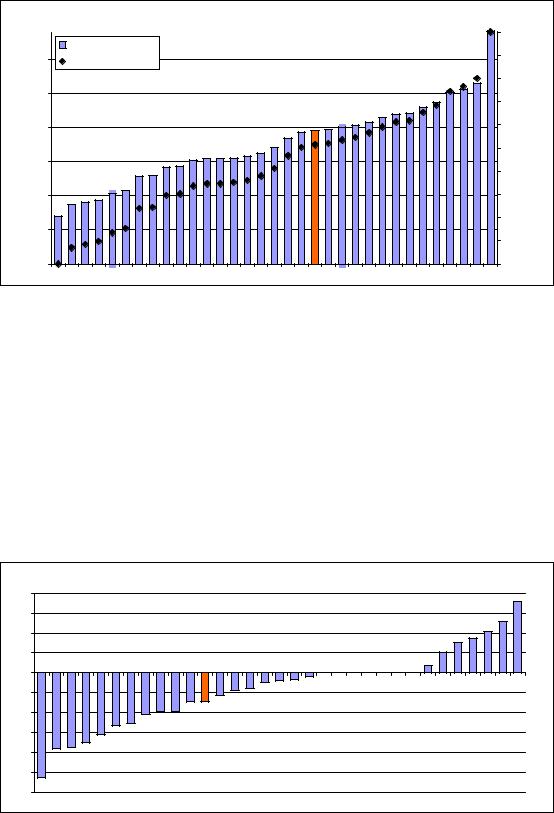
International scientific co-publications are a proxy for the quality of scientific research as collaboration increases scientific productivity. Data availability for this indicator is limited to the EU27 Member States.
Belgium, Denmark, Finland, Netherlands and Sweden have more than 1000 copublications per million population. These are all relatively small countries where researchers prefer to publish in international journals. International research cooperation is less well developed in Latvia and Romania. The EU average is relatively low as here only co-publications with non-EU countries are included.
Growth performance
The number of international scientific co-publications has been increasing at high rates. For almost all countries the annual rate of increase has been higher than 5% and in 3 smaller countries these rates have been exceptionally high (18% in Cyprus, 22% in Malta and 25% in Luxembourg).
International scientific co-publications per million population
25% |
|
|
|
|
|
|
|
|
|
20% |
|
|
|
|
|
|
|
|
|
15% |
|
|
|
|
|
|
|
|
|
10% |
|
|
|
|
|
|
|
|
|
5% |
|
|
|
|
|
|
|
|
|
0% |
|
|
|
|
|
|
|
|
|
PL HU BG SE SK DE FR EU UK NL |
FI |
IT |
DK LV BE AT CZ |
LT |
ES GR EE |
IE |
RO PT |
SI |
CY MT LU |
33
1.2.2 Scientific publications among the top-10% most cited publications worldwide as % of total scientific publications of the country
Scientific publications among top 10% most cited worldwide
|
0.16 |
Indicator |
1.000 |
|
|
|
0.900 |
|
|
|
0.14 |
Normalised scores |
|
|
|
|
|
||
|
0.12 |
|
0.800 |
|
|
|
0.700 |
|
|
|
|
|
Normalised scores |
|
Indicator |
0.10 |
|
0.600 |
|
|
|
|||
0.08 |
|
0.500 |
||
0.06 |
|
0.400 |
||
|
|
|||
|
|
0.300 |
||
|
0.04 |
|
|
|
|
|
0.200 |
|
|
|
|
|
|
|
|
0.02 |
|
0.100 |
|
|
|
|
|
|
|
0.00 |
|
0.000 |
|
LV SKHRBGRO LT PL CZHUMTTR SI EEGRPT CY ES IT FR LU EU FI NOAT DE IE SE IS UK BE NL DKCH
The indicator is a proxy for the efficiency of the research system as highly cited publications are assumed to be of higher quality. There could be a bias towards small or English speaking countries given the coverage of Scopus’ publication data. Countries like France and Germany, where researchers publish relatively more in their own language, are more likely to underperform on this indicator as compared to their real academic excellence.
The best performance is observed for Denmark, Netherlands and Switzerland. Performance in Latvia is poor and, to a lesser extent, also in Bulgaria, Croatia, Lithuania, Poland, Romania and Slovakia.
Growth performance
The poor performance in Latvia is partly due to a strong decline over the past 5 years of almost 10% per year. Except for Denmark and Hungary, the indicator has been increasing in all countries, in particular in Luxembourg, Malta and Turkey.
Scientific publications among top 10% most cited worldwide
25% |
20% |
15% |
10% |
5% |
0% |
-5% |
-10% |
LV HU DK FI UK SE CH NL AT EU IS DE CY FR BE IT NO LT RO CZ EE PL GR ES IE BG PT SI HR SK MT TR LU |
34
1.2.3 Non-EU doctorate students as % of total doctorate students of the country
Non-EU doctorate students as a % of all students
|
45 |
Indicator |
|
1.400 |
|
|
|
|
|
||
|
40 |
|
|
|
|
|
Normalised scores |
|
|
|
|
|
|
|
1.200 |
|
|
|
35 |
|
|
|
|
|
|
|
|
|
|
|
30 |
|
|
1.000 |
Normalised scores |
|
|
|
|
||
Indicator |
25 |
|
|
0.800 |
|
20 |
|
|
0.600 |
||
|
|
|
|||
15 |
|
|
0.400 |
||
|
|
|
|||
|
10 |
|
|
|
|
|
|
|
|
|
|
|
5 |
|
|
0.200 |
|
|
|
|
|
|
|
|
0 |
|
|
0.000 |
|
|
|
LT LV SK GR CY EE RO PL HR TR MT HU CZ MK BG IT |
FI |
SI PT AT RS DK IS SE ES BE EU NO FR UK CH |
|
Statistical outliers: France, Switzerland, UK. Indicator skewed and a square-root transformation has been used for deriving the normalised scores.
The share of non-EU doctorate students reflects the mobility of students as an effective way of diffusing knowledge. Attracting high-skilled foreign doctorate students will add to creating a net brain gain and will secure a continuous supply of researchers.
The average share of non-EU doctorate students is almost 20%; in France and UK this share is close to 30% and 35%, respectively. In Switzerland almost 1 out of 2 doctorate students is a non-Swiss student. In the New Member States the shares of non-EU doctorate students are still small at rates below 5%.
Growth performance
Growth performance is diverse with increases over time in 16 countries and decreases in 11 countries. Growth has been very strong in Estonia and Italy with annual increases close to 14%. The share of non-EU doctorate students has been declining rapidly in the Czech Republic and Lithuania.
Non-EU doctorate students as a % of all students
15% |
10% |
5% |
0% |
-5% |
-10% |
-15% |
-20% |
CZ LT RO SK MT BG PL TR HR BE DK MK GR RS AT IS EU CH CY FI FR SE ES NO HU PT LV UK SI EE IT |
35
1.3.1 Public R&D expenditures as % of GDP
Public R&D expenditure as % of GDP
|
1.20 |
Indicator |
|
|
|
1.10 |
1.000 |
|
|
|
Normalised scores |
|
||
|
1.00 |
|
||
|
|
|
||
|
|
|
|
|
|
0.90 |
|
0.800 |
|
|
0.80 |
|
Normalised scores |
|
|
|
|
||
Indicator |
0.70 |
|
0.600 |
|
0.60 |
|
|||
|
|
|||
0.50 |
|
0.400 |
||
0.40 |
|
|||
|
|
|||
|
|
|
||
|
0.30 |
|
|
|
|
0.20 |
|
0.200 |
|
|
0.10 |
|
|
|
|
0.00 |
|
0.000 |
|
MKMTSK LVROCYBGRSGRPLTRLUHUHR IT IE CZBE LT SI ESUKPTCHEUEEFRATNODENLDKSE FI IS
Statistical outlier: Iceland
R&D expenditure represents one of the major drivers of economic growth in a knowledge-based economy. As such, trends in the R&D expenditure indicator provide key indications of the future competitiveness and wealth of the EU. Research and development spending is essential for making the transition to a knowledge-based economy as well as for improving production technologies and stimulating growth.
Public R&D expenditure is close to or above 1% of GDP in Finland, Iceland and Sweden. The average intensity is 0.67% for the EU27. In Bulgaria, Cyprus, Luxembourg, Malta and Slovakia R&D intensities are below half that of the EU27.
Growth performance
Public R&D expenditures have been increasing most rapidly in Estonia, Latvia, Luxembourg, Portugal and Romania. The Innovation Union has renewed the 3% R&D target towards 2020 but more progress needs to be made as the average increase for the EU27 is too weak partly due to decreases in major R&D spending countries as Finland, France and the Netherlands.
Public R&D expenditure as % of GDP
25% |
20% |
15% |
10% |
5% |
0% |
-5% |
-10% |
MK LV IS HUHRBGGRCY PL TR FR UK NL LT RS CH AT SE MT BE IT SI SK FI EU DE CZ NO ES DK IE RO EE PT LU |
36
1.3.2 Venture capital (% of GDP)
Venture capital as a % of GDP
|
0.500 |
Indicator |
|
|
|
|
|
|
|
|
|
0.450 |
|
|
|
|
|
|
1.600 |
|
|
|
Normalised scores |
|
|
|
|
|
|
|
||
|
|
|
|
|
|
|
|
|
|
|
|
0.400 |
|
|
|
|
|
|
|
1.400 |
|
|
0.350 |
|
|
|
|
|
|
|
1.200 |
Normalised scores |
Indicator |
0.300 |
|
|
|
|
|
|
|
1.000 |
|
|
|
|
|
|
|
|
|
|||
0.250 |
|
|
|
|
|
|
|
0.800 |
||
0.200 |
|
|
|
|
|
|
|
|||
|
|
|
|
|
|
|
0.600 |
|||
0.150 |
|
|
|
|
|
|
|
|||
|
|
|
|
|
|
|
|
|||
|
|
|
|
|
|
|
|
|
|
|
|
0.100 |
|
|
|
|
|
|
|
0.400 |
|
|
|
|
|
|
|
|
|
|
|
|
|
0.050 |
|
|
|
|
|
|
|
0.200 |
|
|
0.000 |
|
|
|
|
|
|
|
0.000 |
|
|
|
SK GR CZ HU AT BG |
IE |
RO PL |
IT |
DE ES DK |
PT NO NL EU FR BE |
FI |
CH SE UK LU |
|
Statistical outlier: Luxembourg. Two-year averages have been used to reduce volatility rates. Indicator skewed and a square-root transformation has been used for deriving the normalised scores.
The amount of venture capital is a proxy for the relative dynamism of new business creation. In particular for enterprises using or developing new (risky) technologies venture capital is often the only available means of financing their (expanding) business. A broader definition including early-stage, expansion and replacement would provide a better picture on the availability of a domestic venture capital industry and would also decrease volatility.
For several countries data are not available as the domestic Venture Capital markets are too small to collect such data. The availability of venture capital differs widely in Europe. Only in Luxembourg, Sweden and the UK venture capital represents more than 0.2% of GDP.
Growth performance
Growth performance is diverse with increases over time in 10 countries and decreases in 12 countries plus the EU27. Growth has been very strong in Belgium with an annual increase above 20% and in particular in Greece with an annual growth close to 50%. The availability of venture capital has been declining rapidly in Austria, Denmark, Hungary, Ireland and Spain.
Venture capital as a % of GDP
50% |
|
|
|
|
|
|
|
|
|
|
|
|
|
|
|
|
|
|
|
|
|
|
|
40% |
|
|
|
|
|
|
|
|
|
|
|
|
|
|
|
|
|
|
|
|
|
|
|
30% |
|
|
|
|
|
|
|
|
|
|
|
|
|
|
|
|
|
|
|
|
|
|
|
20% |
|
|
|
|
|
|
|
|
|
|
|
|
|
|
|
|
|
|
|
|
|
|
|
10% |
|
|
|
|
|
|
|
|
|
|
|
|
|
|
|
|
|
|
|
|
|
|
|
0% |
|
|
|
|
|
|
|
|
|
|
|
|
|
|
|
|
|
|
|
|
|
|
|
-10% |
|
|
|
|
|
|
|
|
|
|
|
|
|
|
|
|
|
|
|
|
|
|
|
-20% |
|
|
|
|
|
|
|
|
|
|
|
|
|
|
|
|
|
|
|
|
|
|
|
-30% |
|
|
|
|
|
|
|
|
|
|
|
|
|
|
|
|
|
|
|
|
|
|
|
-40% |
|
|
|
|
|
|
|
|
|
|
|
|
|
|
|
|
|
|
|
|
|
|
|
HU |
DK |
AT |
IE |
ES |
PT |
CZ |
PL |
SE |
NO |
EU |
NL |
UK |
SK |
DE |
LU |
IT |
FR |
BG |
FI |
RO |
CH |
BE |
GR |
37
2.1.1 Business R&D expenditures (% of GDP)
Business R&D expenditure as % of GDP
|
2.75 |
Indicator |
1.200 |
|
2.50 |
||
|
|
||
|
Normalised scores |
|
|
|
2.25 |
|
|
|
|
1.000 |
|
|
|
|
|
|
2.00 |
|
|
|
1.75 |
|
0.800 |
|
1.50 |
|
|
|
1.25 |
|
0.600 |
Indicator |
|
0.400Normalisedscores |
|
1.00 |
|
||
0.75 |
|
||
|
|
|
|
|
0.50 |
|
0.200 |
|
|
|
|
|
0.25 |
|
|
|
0.00 |
|
0.000 |
MKRSCYBGGRLV PLROLT SKTRMTHREE IT HUES PT NL CZNOUK IE SI LUEUBEFR IS DEATDKCHSE FI
Statistical outliers: Finland, Sweden
The indicator captures the formal creation of new knowledge within firms. It is particularly important in the science-based sector (pharmaceuticals, chemicals and some areas of electronics) where most new knowledge is created in or near R&D laboratories.
The R&D intensity is above 2% of GDP in only 3 countries: Finland, Sweden and Switzerland. The average R&D intensity for the EU27 is 1.21% and for 12 countries the intensity is below 0.50%.
Growth performance
The Innovation Union has renewed the 3% R&D target towards 2020 but more progress needs to be made as the average increase for the EU27 is too weak partly due to decreases in major R&D spending countries as France and the Netherlands. Only Estonia, Hungary, Portugal and Turkey have managed to significantly increase their business R&D expenditures.
Business R&D expenditure as % of GDP
30% |
25% |
20% |
15% |
10% |
5% |
0% |
-5% |
-10% |
RS LV SK NL GRMT LU HRRO SE CH PL IS CZ FR BE EU UK CY DE SI AT DK FI NO IT ES MK LT IE EE BG TR HU PT
38
2.1.2 Non-R&D innovation expenditures as % of total turnover
Non-R&D innovation expenditure as % of turnover
|
1.80 |
Indicator |
1.000 |
|
|
1.60 |
0.900 |
|
|
|
Normalised scores |
|
||
|
1.40 |
|
0.800 |
|
|
|
|
|
|
|
1.20 |
|
0.700 |
Normalised scores |
|
|
|
||
Indicator |
1.00 |
|
0.600 |
|
|
0.500 |
|||
0.80 |
|
|||
|
0.400 |
|||
|
|
|||
0.60 |
|
0.300 |
||
|
|
|||
|
|
|
|
|
|
0.40 |
|
0.200 |
|
|
|
|
|
|
|
0.20 |
|
0.100 |
|
|
0.00 |
|
0.000 |
|
NOTR LU ES FR AT DK NL FI BE IT PT EU SKGRSE HU LT SI RSHR DEMKBG IE CZ MTCH LV PL ROCY EE
This indicator measures non-R&D innovation expenditure as percentage of total turnover. Several of the components of innovation expenditure, such as investment in equipment and machinery and the acquisition of patents and licenses, measure the diffusion of new production technology and ideas. The indicator does not include intramural and extramural R&D expenditures and does not overlap with the indicator on business R&D expenditures.
On average 0.7% of total turnover is spent non-R&D innovation in Europe. In Cyprus and Estonia this share is almost 1.8%, while in Luxembourg, Norway and Turkey it is close to or below 0.2%.
Growth performance
The share of non–R&D innovation expenditures has increased most in Croatia, Netherlands and Spain and has declined most in Greece, Luxembourg and Slovakia. For the EU27 this share has declined with almost 10%.
Non-R&D innovation expenditure as % of turnover
20% |
15% |
10% |
5% |
0% |
-5% |
-10% |
-15% |
-20% |
SK GR LU BE IT LT PT NO CY EU SI CZ DE IE HU DK PL SE MK LV AT FI TR RS EE RO CH MT FR BG ES NL HR |
39
Correlation with the indicator on business R&D expenditure
|
|
|
|
|
|
|
|
|
|
Indicators |
2.1.1 |
and |
|||
|
2.00 |
|
|
|
|
|
|
|
|
2.1.2 |
both |
|
measure |
||
|
1.80 |
|
EE |
|
|
|
|
|
|
investment |
|
|
in |
||
expenditure |
CY |
|
|
|
|
|
|
innovation |
activities: |
||||||
|
|
|
|
|
|
|
|||||||||
|
PL |
|
|
|
|
|
|
|
second |
in |
|
non-R&D |
|||
|
1.60 |
|
|
|
|
|
|
|
|
the |
first |
in |
R&D |
||
|
1.40 |
RO |
|
|
|
|
|
|
|
activities |
|
and |
the |
||
|
|
|
|
|
|
|
|
|
|
|
|
|
|
||
|
|
|
|
|
|
|
|
|
|
|
|
|
|
|
|
innovation |
1.20 |
LV |
HU |
|
|
|
CH |
SE |
|
activities |
|
as |
the |
||
|
GR |
|
|
|
|
|
purchase |
of |
advanced |
||||||
|
1.00 |
MT |
|
CZ |
IE |
|
|
|
|
||||||
|
|
BG |
|
|
|
DE |
|
|
|
machinery |
|
|
and |
||
|
0.80 |
RS HR |
|
|
SI |
|
|
|
equipment. |
|
|
The |
|||
|
|
LT |
|
|
|
|
|
|
|
|
|
||||
R&D- |
0.60 |
SK |
IT PT |
|
|
|
|
|
indicator |
on |
non-R&D |
||||
|
BE |
|
|
|
FI |
||||||||||
|
|
ES |
NL |
AT |
|
|
innovation expenditure |
||||||||
|
|
FR |
|
|
|
||||||||||
Non |
0.40 |
|
|
|
DK |
|
|
|
|
|
|
|
|
|
|
|
|
|
LU |
|
|
|
|
is not |
correlated |
with |
|||||
0.20 |
|
|
|
|
|
|
|
the |
indicator |
on |
|||||
|
TR |
|
|
|
|
|
|
||||||||
|
|
|
NO |
|
|
|
|
|
business |
|
|
|
R&D |
||
|
0.00 |
|
|
|
|
|
|
|
|
|
|
||||
|
|
|
|
|
|
|
|
|
expenditure. |
|
|
One |
|||
|
0.00 |
0.50 |
1.00 |
1.50 |
2.00 |
2.50 |
|
3.00 |
|
|
|||||
|
|
explanation |
is |
that for |
|||||||||||
|
|
|
|
|
|
|
|
|
|
||||||
|
|
|
Business R&D expenditure |
|
|
|
both |
|
|
indicators |
|||||
|
|
|
|
|
|
|
|
|
|
different |
denominators |
||||
have been used. Business R&D expenditure is expressed as a percentage of total GDP whereas non-R&D innovation expenditure is expressed as a percentage of turnover of business firms only. The latter only represents part of GDP as it excludes e.g. mining, construction and the public sector.
40
2.2.1 SMEs innovating in-house as % of all SMEs
SMEs innovating in-house as % of SMEs
|
|
Indicator |
1.000 |
|
|
45 |
0.900 |
|
|
|
|
Normalised scores |
|
|
|
40 |
|
|
|
|
|
0.800 |
|
|
|
|
|
|
|
|
35 |
|
0.700 |
Normalised scores |
|
|
|
||
Indicator |
30 |
|
0.600 |
|
|
|
|||
25 |
|
0.500 |
||
|
|
|||
20 |
|
0.400 |
||
|
|
|||
15 |
|
0.300 |
||
|
10 |
|
0.200 |
|
|
5 |
|
0.100 |
|
|
0 |
|
0.000 |
|
|
|
MKHU PL LV SK ROBG LT MT ES NOHR NL RS TR CH CZ FR EUGREE IT PT AT SE LU FI IE BE DK CY DE |
|
|
This indicator measures the degree to which SMEs that have introduced any new or significantly improved products or production processes have innovated inhouse. The indicator is limited to SMEs because almost all large firms innovate and because countries with an industrial structure weighted towards larger firms tend to do better.
On average 30% of SMEs innovate in-house. Much higher shares are observed for Germany where more than 45% of SMEs innovate in-house. In the Former Yugoslav Republic of Macedonia, Hungary, Latvia, Poland and Slovakia less than 15% of SMEs innovate in-house.
Growth performance
Growth performance is diverse with increases over time in 8 countries and decreases in 15 countries plus the EU27. Growth has been very strong in Cyprus and Italy. The share of SMEs innovating in-house has been declining most rapidly in Austria, Ireland and in particular Poland.
SMEs innovating in-house as % of SMEs
6% |
|
4% |
|
2% |
|
0% |
|
-2% |
|
-4% |
|
-6% |
|
-8% |
|
-10% |
|
PL AT IE CH ES EE SE NO EU LT CZ SK BE HU GR DE MK DK LV LU MT TR RS NL PT RO HR FR BG FI |
IT CY |
41
2.2.2 Innovative SMEs co-operating with others (% of all SMEs)
Innovative SMEs collaborating with others as % of SMEs
|
25 |
Indicator |
|
|
|
|
1.000 |
|
|
|
|
Normalised scores |
|
|
|
|
|
|
|
|
20 |
|
|
|
|
|
|
0.800 |
Normalised scores |
Indicator |
15 |
|
|
|
|
|
0.600 |
||
10 |
|
0.400 |
||
|
|
|||
|
|
|
||
|
5 |
|
0.200 |
|
|
|
|
|
|
|
0 |
|
0.000 |
|
ROLVRSBGMTTRESSK IT PLHULT DECHMK IE EUCZHRLU NLNOPTGRFR IS SI AT FI SECYBEEEDKUK
Statistical outliers: Denmark, UK
This indicator measures the degree to which SMEs are involved in innovation cooperation. Complex innovations, in particular in ICT, often depend on the ability to draw on diverse sources of information and knowledge, or to collaborate on the development of an innovation. This indicator measures the flow of knowledge between public research institutions and private firms and between firms and other firms. The indicator is limited to SMEs because almost all large firms are involved in innovation co-operation.
About 11% of EU27 SMEs collaborate with others. In Belgium, Cyprus, Denmark, Estonia and the UK more than 1 out 5 SMEs collaborate, whilst in Bulgaria, Latvia, Serbia and Romania this is less than 1 out of 20.
Growth performance
Growth performance is diverse with increases over time in 16 countries and decreases in 14 countries. Growth has been very strong in Greece, Portugal and the UK with an annual increase above 10%. In Ireland, Latvia and Lithuania the share of SMEs collaborating with others has decreased with more than 10% annually.
Innovative SMEs collaborating with others as % of SMEs
20% |
15% |
10% |
5% |
0% |
-5% |
-10% |
-15% |
LV LT IE PL CHRO AT SE LU SK CZ FI ES MTMK TR IS RS DE NL HUDK EUBGNO FR HRCY BE SI IT EE GRUK PT
42
2.2.3 Public-private scientific co-publications per million population
Public-private scientific co-publications per million population
|
200 |
Indicator |
1.600 |
|
|
180 |
|
|
|
|
Normalised scores |
1.400 |
|
|
|
|
|
||
|
160 |
|
1.200 |
|
|
140 |
|
|
|
|
|
|
Normalised scores |
|
Indicator |
120 |
|
1.000 |
|
|
|
|||
100 |
|
0.800 |
||
80 |
|
0.600 |
||
|
|
|||
60 |
|
|
||
|
|
0.400 |
|
|
|
40 |
|
|
|
|
|
|
|
|
|
20 |
|
0.200 |
|
|
|
|
|
|
|
0 |
|
0.000 |
|
MTTR LVBGPL LT RSROCYPTSKGRESHREEHU IT CZLU IE FREUDE SI ATBEUKNL FI NOSEDK IS CH
Statistical outliers: Iceland, Switzerland. Two-year averages have been used to reduce volatility rates.
This indicator captures public-private research linkages and active collaboration activities between business sector researchers and public sector researchers resulting in academic publications.
On average 36 co-publications are observed for the EU27. But there are large differences, with more than 160 co-publications in Iceland and Switzerland and less than 5 co-publications in Bulgaria, Latvia, Lithuania, Malta, Poland, Serbia and Turkey.
Growth performance
Public-private scientific co-publications have been increasing in almost all countries, in particular in Cyprus and Serbia. In the UK and in particular in Malta we observe a decline for this indicator.
Public-private scientific co-publications per million population
40% |
30% |
20% |
10% |
0% |
-10% |
-20% |
MT UK FR IT SE EU CH DK DE LU IS BE FI GR NL HU ES IE NO AT PT TR SI LV PL RO CZ EE HR SK LT BG CY RS |
43
2.3.1 PCT patent applications per billion GDP (in PPP€)
PCT patent applications per billion GDP
|
11 |
1.200 |
|
|
|
10 |
Indicator |
|
|
|
Normalised scores |
|
||
|
|
|
||
|
9 |
1.000 |
|
|
|
|
|
||
|
8 |
|
Normalised scores |
|
|
7 |
0.800 |
||
Indicator |
|
|||
6 |
0.600 |
|||
5 |
||||
|
||||
4 |
0.400 |
|||
|
||||
|
3 |
|
|
|
|
2 |
0.200 |
|
|
|
|
|
||
|
1 |
|
|
|
|
0 |
0.000 |
|
MKROPL LT BGGRSKCYPT LV TRHRCZ LU ESMTHUEE IT SI IE IS NOUKBEFREUAT NLDEDKCH FI SE
Statistical outliers: Finland, Sweden
The capacity of firms to develop new products will determine their competitive advantage. One indicator of the rate of new product innovation is the number of patents. This indicator measures the number of PCT patent applications.
For the EU27 on average 4 PCT patents per billion GDP have been applied for. There are large differences with 10 or more patent applications in Finland and Sweden and less than 1 application in Bulgaria, Cyprus, Czech Republic, Greece, Latvia, Lithuania, the Former Yugoslav Republic of Macedonia, Poland, Portugal, Romania, Slovakia and Turkey.
Growth performance
In Lithuania, Malta, Portugal and Turkey PCT patent applications have been growing rapidly; in Malta and Turkey at rates close to 30% per year. In several countries the indicator has been falling, in particular in Croatia, Cyprus and Iceland.
PCT patent applications per billion GDP
40% |
30% |
20% |
10% |
0% |
-10% |
-20% |
-30% |
MK CY IS HR BG RO SK UK NO NL FI LV LU PL EU DE FR DK CH GR AT SI IT HU IE BE SE EE ES CZ PT LT MT TR |
44
2.3.2 PCT patent applications in societal challenges per billion GDP (in PPP€)
PCT patent applications in societal challenges per billion GDP
|
3.0 |
|
|
|
|
|
Indicator |
1.400 |
|
|
2.5 |
Normalised scores |
|
|
|
|
1.200 |
|
|
|
|
|
|
|
|
2.0 |
|
1.000 |
Normalised scores |
Indicator |
1.5 |
|
0.800 |
|
|
|
|||
|
|
0.600 |
||
1.0 |
|
|
||
|
|
0.400 |
||
|
|
|
|
|
|
0.5 |
|
0.200 |
|
|
|
|
|
|
|
0.0 |
|
0.000 |
|
RO LT HRTRBGCY PL SK PTGRCZMT LU LV ES IT EEHUNO IS FI FR BE EU SI AT UK IE DE NL SECHDK
Statistical outliers: Denmark, Sweden, Switzerland. Indicator skewed and a square-root transformation has been used for deriving the normalised scores.
This indicator measures PCT applications in health technology and climate change mitigation. From a policy point of view the indicator on patent applications in societal challenges is highly relevant as increased number of patent applications in health technology and climate change mitigation will be necessary to meet the societal needs of an ageing European society and sustainable growth.
Denmark, Sweden and Switzerland are the countries with the highest numbers of patent applications in societal challenges. In a large number of countries such applications are very low but this can be partly explained by their overall low number of patent applications (cf. indicator 2.3.1).
Growth performance
Patent applications in societal challenges are growing in 23 countries but are also declining in 8 countries. Decline has been strong in Bulgaria and Cyprus whereas in Latvia and Portugal growth has been strongest.
PCT patent applications in societal challenges per billion GDP
30% |
20% |
10% |
0% |
-10% |
-20% |
-30% |
CY BG TR LT FI SK NO UK SI MT IS BE EE FR CZ EU DE DK IT SE RO CH IE HU AT GR NL ES HR LU PL PT LV |
45

2.3.3 Community trademarks per billion GDP (in PPP€)
Community trademarks per billion GDP
|
25 |
Indicator |
1.800 |
|
|
|
1.600 |
|
|
|
|
Normalised scores |
|
|
|
|
|
|
|
|
20 |
|
1.400 |
|
|
|
|
|
|
|
|
|
1.200 |
Normalised scores |
Indicator |
15 |
|
1.000 |
|
|
|
|||
10 |
|
0.800 |
||
|
|
|||
|
|
0.600 |
||
|
5 |
|
0.400 |
|
|
|
|
|
|
|
|
|
0.200 |
|
|
0 |
|
0.000 |
|
MKTRRSHRROSKGRNOHULVCZ LT PL SI BGFRUKPTEE IT EU FI IE BEES IS SEDKDENL ATCHCYMTLU
Statistical outliers: Cyprus, Luxembourg, Malta
Trademarks are an important innovation indicator, especially for the service sector. The Community trademark gives its proprietor a uniform right applicable in all Member States of the European Union through a single procedure which simplifies trademark policies at European level. It fulfils the three essential functions of a trademark: it identifies the origin of goods and services, guarantees consistent quality through evidence of the company's commitment vis-à-vis the consumer, and is a form of communication, a basis for publicity and advertising.
Most trademarks are applied for in Cyprus, Luxembourg and Malta. Trademark applications are low in Croatia, the Former Yugoslav Republic of Macedonia, Serbia and Turkey.
Growth performance
Trademark applications have been growing in all countries (except the Former Yugoslav Republic of Macedonia), in particular in Bulgaria, Romania and Slovenia.
Community trademarks per billion GDP
50% |
40% |
30% |
20% |
10% |
0% |
-10% |
-20% |
-30% |
MK ES UK DK EU FI IT FR GRRS DE PT SE PL IE HRHU AT TR CZ BE NL CH LU IS LV CY SK EE LT NOMTRO SI BG |
46
2.3.4 Community designs per billion GDP (in PPP€)
Community designs per billion GDP
|
9 |
Indicator |
1.000 |
|
|
|
|
||
|
|
0.900 |
|
|
|
8 |
Normalised scores |
|
|
|
|
|
||
|
7 |
|
0.800 |
|
|
|
|
|
|
|
6 |
|
0.700 |
Normalised scores |
|
|
0.600 |
||
Indicator |
5 |
|
||
|
0.500 |
|||
|
|
|||
4 |
|
0.400 |
||
|
|
|||
3 |
|
0.300 |
||
|
|
|
|
|
|
2 |
|
0.200 |
|
|
|
|
|
|
|
1 |
|
0.100 |
|
|
0 |
|
0.000 |
|
RSMK IS HRTRGRCYROLT HUNOMTBGEESKCZ IE UK SI ES LV BEFRNL PLEUSE FI PT LU IT DEDKCHAT
A design is the outward appearance of a product or part of it resulting from the lines, contours, colours, shape, texture, materials and/or its ornamentation. A product can be any industrial or handicraft item including packaging, graphic symbols and typographic typefaces but excluding computer programs. It also includes products that are composed of multiple components, which may be disassembled and reassembled. Community design protection is directly enforceable in each Member State and it provides both the option of an unregistered and a registered Community design right for one area encompassing all Member States.
Most designs are applied for Austria, Denmark, Germany and Switzerland. Design applications are low in Croatia, Cyprus, Greece, Hungary, Iceland, Lithuania, the Former Yugoslav Republic of Macedonia, Norway, Romania, Serbia and Turkey.
Growth performance
Growth performance for designs shows that these have been growing in 19 countries but declining in 13 countries. On average there is only a modest increase in the number of designs per billion GDP.
Community designs per billion GDP
35%
30% 


25% 


20%
15% 

10% 

5% 
 0%
0% 


 -5%
-5% 

 -10% -15%
-20% 
 -25%
-25% 

CY LT LU HU BE ES UK DK IT IS TRNO CZ MKRS EU NL SE CH DE FR FI AT LV MT SI IE SK PT GRBG PL HRROEE
47
3.1.1 SMEs introducing product or process innovations as % of SMEs
SMEs introducing product or process innovations
|
55 |
Indicator |
1.000 |
|
|
0.900 |
|
||
|
50 |
Normalised scores |
|
|
|
|
|
||
|
45 |
|
0.800 |
|
|
40 |
|
0.700 |
Normalised scores |
Indicator |
35 |
|
0.600 |
|
30 |
|
0.500 |
||
|
|
|||
25 |
|
0.400 |
||
20 |
|
|||
|
0.300 |
|||
15 |
|
|||
|
|
|
||
|
|
|
|
|
|
10 |
|
0.200 |
|
|
|
|
|
|
|
5 |
|
0.100 |
|
|
0 |
|
0.000 |
|
HULV PLRORSSKBG LT UKMT IE ESNOTR SI HRNL FREUCZ IT GRDKMKAT SE LU FI CYEEBE PTDECH
Statistical outlier: Switzerland
Technological innovation, as measured by the introduction of new products (goods or services) and processes, is a key ingredient to innovation in manufacturing activities. Higher shares of technological innovators should reflect a higher level of innovation activities.
Almost 35% of EU27 SMEs have innovated by introducing a new product or a new process. In Germany and Switzerland more than 50% of SMEs have introduced a new product or process, in Hungary, Latvia, Poland, Romania, Serbia and Slovakia this share is below 20%.
Growth performance
Over the last 5 years on average a smaller share of SMEs has introduced new products or new processes. In most countries shares have been declining; only in 10 countries do we observe a significant increase.
SMEs introducing product or process innovations
20% |
15% |
10% |
5% |
0% |
-5% |
-10% |
-15% |
IE PL AT DK UK LU ES LT SE EU CY BE NO EE HU SI CZ SK DE NL MK TR RS RO IT FR CH GRHR FI LV PT BG MT |
48
3.1.2 SMEs introducing marketing or organisational innovations as % of SMEs
SMEs introducing marketing or organisational innovations
|
|
Indicator |
1.000 |
|
|
|
0.900 |
|
|
|
60 |
Normalised scores |
|
|
|
|
|
||
|
|
|
0.800 |
|
|
50 |
|
0.700 |
Normalised scores |
|
|
|
||
Indicator |
40 |
|
0.600 |
|
30 |
|
0.500 |
||
|
0.400 |
|||
|
|
|||
20 |
|
0.300 |
||
|
|
|
||
|
10 |
|
0.200 |
|
|
|
0.100 |
|
|
|
|
|
|
|
|
0 |
|
0.000 |
|
LV BGRS PL HU LT MTROSK NL ESMKNOUK FI HREE SE FR EU SI DK IT IE AT PT BE CZCY TRGRLU DE
The Community Innovation Survey mainly asks firms about their technological innovation. Many firms, in particular in the services sectors, innovate through other non-technological forms of innovation. Examples of these are marketing and organisational innovations. This indicator tries to capture the extent that SMEs innovate through non-technological innovation.
Almost 40% of EU27 SMEs have innovated by introducing a new marketing or new organisational innovation. In Germany more than 60% of SMEs have introduced a new marketing or new organisational innovation, in Bulgaria, Latvia, Poland and Serbia this share is below 20%.
Growth performance
The share of SMEs that have introduced marketing or organisational innovations has been declining for the EU27 and for most countries over the last 5 years. Only in 7 countries we observe an increase.
SMEs introducing marketing or organisational innovations
8% |
|
6% |
|
4% |
|
2% |
|
0% |
|
-2% |
|
-4% |
|
-6% |
|
-8% |
|
-10% |
|
-12% |
|
DK EE PL LT IE AT HU LU CY HR NO EU RO FR NL UK PT BE MT MK LV SI |
FI SE TR RS ES IT GR DE CZ BG SK |
49
3.2.1 Employment in knowledge-intensive activities as % of total employment
Employment in knowledge-intensive activities
|
25 |
Indicator |
1.200 |
|
|
|
|
||
|
|
|
|
|
|
|
Normalised scores |
|
|
|
20 |
|
1.000 |
|
|
15 |
|
0.800 |
Normalised scores |
Indicator |
|
|
||
|
|
0.600 |
||
10 |
|
|
||
|
|
0.400 |
||
|
5 |
|
0.200 |
|
|
|
|
|
|
|
0 |
|
0.000 |
|
TRRO LT BG PT PL LV HRSK EEGRCZ ESHU SI EU IT FR BE AT CYDE NL FI NODK SEMTUK IS IE CH LU
Statistical outlier: Luxembourg
The indicator on knowledge-intensive activities replaces the European Innovation Scoreboard indicators on employment in medium-high and high-tech manufacturing and employment in knowledge-intensive services. Knowledgeintensive activities are defined as those industries where at least 33% of employment has a university degree (ISCED5 or ISCED6).
The average value for the indicator is 13%. Countries with high shares of knowledge-intensive activities include Iceland, Ireland, Luxembourg and Switzerland. In Romania and Turkey the share of knowledge-intensive activities is below or close to 5%.
Growth performance
Employment in knowledge-intensive activities has been growing for the EU27 and for most countries. The employment share has decreased with more than 1% annually in Cyprus, Hungary and the Netherlands.
Employment in knowledge-intensive activities
4% |
|
3% |
|
2% |
|
1% |
|
0% |
|
-1% |
|
-2% |
|
NL CY HU BE HR MT IT PT FI TR GR SK UK CZ EU ES DK DE SE CH AT FR BG IS NO RO LT LU IE |
SI PL EE LV |
50
3.2.2 Medium and high-technology product exports as % of total product exports
Medium and high-tech product exports
|
70 |
Indicator |
1.000 |
|
|
|
|
||
|
|
0.900 |
|
|
|
|
Normalised scores |
|
|
|
60 |
|
|
|
|
|
0.800 |
|
|
|
|
|
|
|
|
50 |
|
0.700 |
Normalised scores |
Indicator |
40 |
|
0.600 |
|
|
0.500 |
|||
|
|
|||
30 |
|
0.400 |
||
|
|
|||
20 |
|
0.300 |
||
|
|
|
||
|
|
|
|
|
|
|
|
0.200 |
|
|
10 |
|
0.100 |
|
|
|
|
|
|
|
0 |
|
0.000 |
|
NO IS BGRSMKLVGRLT EELU PTTRNLDKHRCYEUESBEROPL IT UK IE SEAT FI FR SI SKCZDECHHUMT
Statistical outlier: Norway. Medium and High-tech exports include exports of the following SITC Rev.3 products: 266, 267, 512, 513, 525, 533, 54, 553, 554, 562, 57, 58, 591, 593, 597, 598, 629, 653, 671, 672, 679, 71, 72, 731, 733, 737, 74, 751, 752, 759, 76, 77, 78, 79, 812, 87, 88 and 891.
The indicator measures the technological competitiveness of the EU i.e. the ability to commercialize the results of research and development (R&D) and innovation in the international markets. It also reflects product specialization by country. Creating, exploiting and commercializing new technologies are vital for the competitiveness of a country in the modern economy. This is because medium and high technology products are key drivers for economic growth, productivity and welfare, and are generally a source of high value added and well-paid employment.
Export shares are very high in Hungary, Malta and Switzerland and very low in Iceland and Norway.
Growth performance
The share of medium and high-tech product exports has been growing rapidly in Latvia, Norway and Romania. On average there is a small decline and in Cyprus, Estonia and the Netherlands this decline has been strongest.
Medium and high-tech product exports
12% |
10% |
8% |
6% |
4% |
2% |
0% |
-2% |
-4% |
-6% |
CY EE NL UK ES PT DE SE FI HU DK FR AT IE EU TR IT BE MT LT CHHR IS CZGR LU SI PL SK BG RSNOMK LV RO
51
3.2.3 Knowledge-intensive services exports as % of total services exports
Knowledge-intensive services exports
|
80 |
Indicator |
|
|
|
|
|
|
|
|
70 |
Normalised scores |
1.000 |
|
|
|
|
|
|
|
60 |
|
0.800 |
Normalised scores |
|
|
|
||
Indicator |
50 |
|
|
|
40 |
|
0.600 |
||
|
|
|||
30 |
|
0.400 |
||
|
|
|||
|
|
|
||
|
20 |
|
|
|
|
10 |
|
0.200 |
|
|
|
|
|
|
|
0 |
|
0.000 |
|
LT HRTR IS BGSK SI HUMKPL PT ATMTCHFRRSCZNL IT LV BE FI SEEEROEUCYNOGRDEDKUK IE LU
Statistical outliers: Ireland, Luxembourg. Exports of knowledge-intensive services are measured by the sum of credits in EBOPS (Extended Balance of Payments Services Classification) 207, 208, 211, 212, 218, 228, 229, 245, 253, 254, 260, 263, 272, 274, 278, 279, 280 and 284.
The indicator measures the competitiveness of the knowledge-intensive services sector. The indicator is comparable to the indicator manufacturing export performance. Knowledge-intensive services are defined as NACE classes 61-62 and 64-72. These can be related to the above-mentioned EBOPS classes using the correspondence table between NACE, ISIC and EBOPS as provided in the UN Manual on Statistics of International Trade in Services (UN, 2002).
At EU level about half of the total services exports are knowledge-intensive. Export shares are around 70% in Denmark, Ireland and UK, and about 80% in Luxembourg; whilst they are very low, below 20%, in Croatia, Iceland, Lithuania and Turkey.
Growth performance
The export share of knowledge-intensive services has been growing at an average rate of 1.5% for the EU27. High growth rates above 10% are observed for Finland, Hungary and Malta. Export shares have declined in Iceland, Lithuania and Sweden at a rate above 5%.
Knowledge-intensive services exports
20% |
15% |
10% |
5% |
0% |
-5% |
-10% |
IS LT SE RS NL BE CH FR DK IE LV UK NO LU RO EU AT IT DE HR CZ GR PL EE PT SK TR SI BG CY HU MT MK FI |
52
3.2.4 Sales of new-to-market and new-to-firm innovations as % of turnover
Sales of new-to-market and new-to-firm innovations
|
25 |
Indicator |
1.200 |
|
|
|
Normalised scores |
|
|
|
|
|
|
|
|
20 |
|
1.000 |
|
Indicator |
15 |
|
0.800 |
Normalised scores |
|
|
|||
|
|
0.600 |
||
10 |
|
|
||
|
|
0.400 |
||
|
|
|
|
|
|
5 |
|
0.200 |
|
|
|
|
|
|
|
0 |
|
0.000 |
|
NOLVUKNL LUSEBE LT PLMKRSEE IE ATDK IT IS FREUBGHRROMTPT FI SKTRESCY SI HUDECZCHGR
Statistical outliers: Greece, Norway, Switzerland
This indicator measures the turnover of new or significantly improved products and includes both products which are only new to the firm and products which are also new to the market. The indicator thus captures both the creation of state-of- the-art technologies (new to market products) and the diffusion of these technologies (new to firm products).
The average score for the EU27 is 13% but in Greece and Switzerland these shares are close to or above 25%. In Norway the sales share of new or significantly improved products is below 5%.
Growth performance
Sales of new-to-market and new-to-firm innovations have shown a strong increase in Cyprus, Greece Hungary and Switzerland. In Luxembourg, Norway and the UK these sales have been falling most.
Sales of new-to-market and new-to-firm innovations
30% |
25% |
20% |
15% |
10% |
5% |
0% |
-5% |
-10% |
-15% |
-20% |
NOUK LU SE MT PL BE SK EE ROEU DE LT IT MK TR IS RS DK FI NL AT IE HR FR BG SI LV ES CZ PT GRCHHU CY
53
New-to-market versus new-to-firm sales
Sales of new-to-market products capture the creation of state-of-the-art technologies. Sales of new-to-firm products capture the diffusion of these technologies. In some countries sales of new-to-market products represents a much higher share than sales of new-to-firm products. The share of new-to- market products is above 60% in Greece, Hungary, Latvia, Malta and Norway. The share due to new-to-firm products is above 70% in Cyprus, Germany, Romania, Serbia, Turkey and the UK.
100% |
90% |
80% |
70% |
60% |
50% |
40% |
30% |
20% |
10% |
0% |
CY DE UKRO TR RS EU IS LU EE FI IE SI PL ES IT AT LT BE FR SK HRBG PT CZ SE NL DKNOHUGR LV MT |

 New to market
 New to firm
54
3.2.5 License and patent revenues from abroad as % of GDP
License and patent revenues from abroad
|
2.5 |
Indicator |
|
|
|
2.3 |
2.250 |
|
|
|
Normalised scores |
|
|
|
|
|
2.000 |
|
|
|
2.0 |
|
|
|
|
|
|
|
|
|
1.8 |
|
1.750 |
Normalised scores |
|
|
|
||
Indicator |
1.5 |
|
1.500 |
|
|
|
|||
1.3 |
|
1.250 |
||
|
|
|||
1.0 |
|
1.000 |
||
|
|
|||
0.8 |
|
0.750 |
||
|
0.5 |
|
0.500 |
|
|
0.3 |
|
0.250 |
|
|
0.0 |
|
0.000 |
|
TR IS LTGRBGLV PLCZ IT CYMKHRPTES SI RSSKROEENOATEUFRDEBELUUKHUNL FI DK IE SEMTCH
Statistical outliers: Malta, Netherlands, Switzerland. Indicator skewed and a square-root transformation has been used for deriving the normalised scores.
License and patent revenues from abroad capture disembodied technology acquisition. Technology exports reflect the successful commercialization of close- to-the-frontier technological activities.
These revenues are very high in Malta, Netherlands and Switzerland between 2% and 2.5% of GDP. In most countries these revenues represent less than 0.5% of GDP and in Iceland, Lithuania and Turkey they are close to zero.
Growth performance
License and patent revenues from abroad particular in Estonia, Malta and Poland. In decreased relative to GDP.
have increased in 20 countries, in 10 countries these revenues have
License and patent revenues from abroad
35% |
25% |
15% |
5% |
-5% |
-15% |
-25% |
LV HR LT GRCY SK NL LU HU IT NOROTR IS UK EUCHBG FI PL FR DK SE BE ES AT MK CZ DE SI MT IE RS PT EE
55