

ius-2013_en
.pdfInnovation
Union
Scoreboard
2013
Enterprise
and Industry

Legal notice:
The views expressed in this report, as well as the information included in it, do not necessarily reflect the opinion or position of the European Commission and in no way commit the institution.
Europe Direct is a service to help you find answers to your questions about the European Union
Freephone number (*): 00 800 6 7 8 9 10 11
(*) Certain mobile telephone operators do not allow access to 00 800 numbers or these calls may be billed.
This report was prepared by:
Hugo Hollanders and Nordine Es-Sadki from the
Maastricht Economic and Social Research Institute on Innovation and Technology (UNU-MERIT).
With inputs from:
Stefano Tarantola, DG JRC G3 - Econometrics and applied statistics,
European Commission
Coordinated and guided by:
Bonifacio Garcia Porras, Head of Unit, and Tomasz Jerzyniak
Unit B3 – Innovation Policy for Growth
Directorate B – Sustainable Growth and EU 2020
Directorate-General for Enterprise and Industry,
European Commission
More information on the European Union is available on the Internet (http://europa.eu)
Cataloguing data can be found at the end of this publication.
Cover picture: Fotolia_4679488 © nfrPictures_L
© European Union, 2013
Reproduction is authorised provided the source is acknowledged.
Printed in Belgium
PRINTED ON CHLORINE FREE PAPER

Innovation Union
Scoreboard 2013
The Innovation Union Scoreboard report and annexes and the indicators’ database are available at http://ec.europa.eu/enterprise/policies/innovation/facts-figures-analysis/innovation-scoreboard/index_en.htm

TABLE OF CONTENTS
4 |
|
EXECUTIVE SUMMARY |
8 |
1 |
INTRODUCTION |
10 |
2 |
INNOVATION UNION SCOREBOARD: FINDINGS FOR MEMBER STATES |
102.1 Innovation performance
112.2 Growth performance 2008-2012
14 |
2.3 |
Performance changes since the launch of the Europe 2020 strategy |
16 |
2.4 |
Innovation dimensions |
193 COMPARISON OF EU27 INNOVATION PERFORMANCE WITH KEY BENCHMARK COUNTRIES
193.1 A comparison with other European countries
203.2 A comparison with global competitors
28 |
4 |
COUNTRY PROFILES |
|
62 |
5 |
INNOVATION AT THE REGIONAL LEVEL |
|
62 |
|
5.1 |
Regional Innovation Scoreboard |
64 |
|
5.2 |
Regional innovation and socio-economic performance |
645.3 Regional research cooperation patterns of SMEs
656 TECHNICAL ANNEX
656.1 Calculating composite scores
666.2 Calculating growth rates
666.3 International benchmarking
67ANNEX A Definitions of indicators
70 |
ANNEX B |
Current performance |
72 |
ANNEX C |
Growth performance |
74 |
ANNEX D |
Country abbreviations |
74ANNEX E Summary Innovation Index (SII) time series
75ANNEX F Performance scores per dimension
76 |
ANNEX G |
Gender data |
|
|
|
|
|
|
4 |
Innovation Union Scoreboard 2013 |
|
|
|
|
Executive summary
Innovation Union Scoreboard 2013: the first edition reflecting the impact of the economic crisis
This year's edition offers a unique opportunity to measure the first effects of the economic crisis on the research and innovation landscape in Europe. It uses the most recent available data from Eurostat and other internationally recognised sources with data referring to 2011 for 12 indicators and 2010 for 9 indicators and to less recent years for only 3 indicators. Six indicators are derived from the recently published Community Innovation Survey 2010, which investigated the innovation activity of the European enterprises during the crisis years 2008-2010.
Croatia, Iceland, the Former Yugoslav Republic of Macedonia, Norway, Serbia, Switzerland and Turkey. It also includes comparisons between the EU27 and 10 global competitors. The overall ambition of the Innovation Union Scoreboard is to inform policy discussions at national and EU level, by tracking progress in innovation performance within and outside the EU over time. The Innovation Union Scoreboard is accompanied by the Regional Innovation Scoreboard 2012, the pilot European Public Sector Innovation Scoreboard and analytical reports on among others regional research cooperation patterns of European SMEs and the link between regional innovation and socio-economic performance.
The Innovation Union Scoreboard 2013 gives a comparative assessment of the innovation performance of the EU27 Member States and the relative strengths and weaknesses of their research and innovation systems. It monitors innovation trends across the EU27 Member States, as well as
Member States analysed by eight innovation dimensions and 25 indicators…
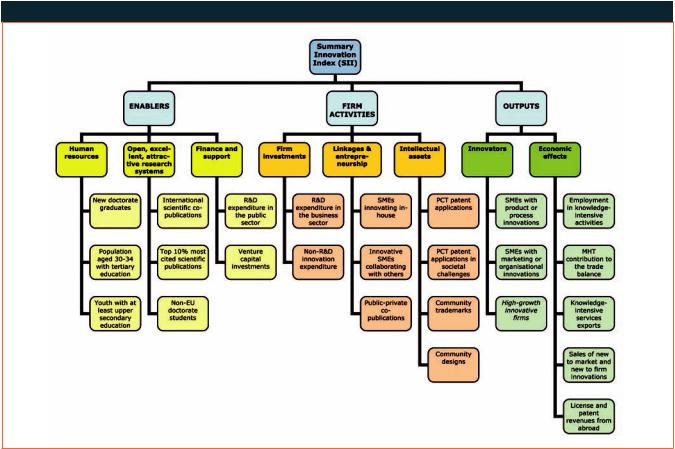
The measurement framework used in the Innovation Union Scoreboard distinguishes between 3 main types of indicators and 8 innovation dimensions, capturing in total 25 different indicators (Figure 1).
Figure 1: Measurement framework of the Innovation Union Scoreboard
Innovation Union Scoreboard 2013 |
5 |
|
The Enablers capture the main drivers of innovation performance external to the firm and cover 3 innovation dimensions: Human resources, Open, excellent and attractive research systems as well as Finance and support. Firm activities capture the innovation efforts at the level of the firm, grouped in 3 innovation dimensions: Firm investments, Linkages & entrepreneurship and Intellectual assets. Outputs cover the effects of firms’ innovation activities in 2 innovation dimensions: Innovators and Economic effects.
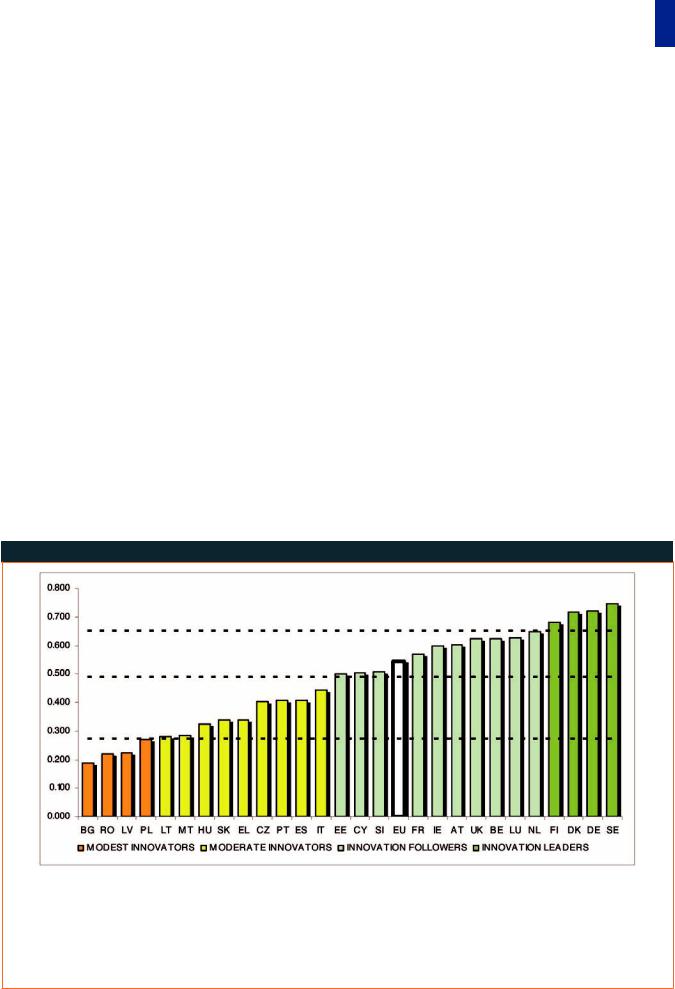
show a performance above or close to that of the EU27 average. These countries are the ‘Innovation followers’.
•The performance of Czech Republic, Greece, Hungary, Italy, Lithuania, Malta, Portugal, Slovakia and Spain is below that of the EU27 average. These countries are ‘Moderate innovators’.
•The performance of Bulgaria, Latvia, Poland and Romania is well below that of the EU27 average. These countries are ‘Modest innovators’.
…and based on their average innovation performance are put into four performance groups.
•The performance of Denmark, Finland, Germany and Sweden is well above that of the EU27 average. These countries are the ‘Innovation leaders’.
•Austria, Belgium, Cyprus, Estonia, France, Ireland, Luxembourg, Netherlands, Slovenia and the UK all
The overall ranking remains relatively stable with Sweden confirming its innovation leadership…
Overall innovation performance ranking remains relatively stable compared to previous IUS editions with Sweden confirming its EU innovation leadership for the third time in a row. It is followed by Germany that switched ranks with Denmark. Finland closes the group of the most innovative Member States.
Figure 2: EU Member States’ innovation performance
Note: Average performance is measured using a composite indicator building on data for 24 indicators going from a lowest possible performance of 0 to a maximum possible performance of 1. Average performance reflects performance in 2010/2011 due to a lag in data availability.
The performance of Innovation leaders is 20% or more above that of the EU27; of Innovation followers it is less than 20% above but more than 10% below that of the EU27; of Moderate innovators it is less than 10% below but more than 50% below that of the EU27; and for Modest innovators it is below 50% that of the EU27.
6 |
Innovation Union Scoreboard 2013 |
|
|
|
|
… but several changes inside the performance groups take place.
Though, there are several upward and downward movements inside each of the performance groups. The Netherlands becomes the top innovation follower and Italy remains the top innovator in the moderate performance group. The bottom end of the ranking is closed by Romania and Bulgaria both being outpaced by Latvia that occupied the last position a year ago.
Two Member States changed the performance group: Lithuania advanced to the moderate innovators and Poland moved down becoming a modest innovator. It should be however noted, that in both cases the change in performance group was due to marginal changes of the innovation performance.
The EU is increasing its innovation performance with Estonia being the unquestionable innovation growth leader…
Overall, the EU annual average growth rate of innovation performance reached 1.6% over the analysed five-year period 2008-2012.
While almost all Member States improved their innovation performance, Estonia is by far the European innovation growth leader that grew with an average annual rate of 7.1%. It is followed by Lithuania and Latvia that improved at average annual rates of 5.0% and 4.4% respectively. The lowest positive innovation growth rates were recorded in Poland (0.4%), Bulgaria (0.6%) and Sweden (0.6%). In two Member States, Greece and Cyprus, innovation performance has declined at an average annual rate of 1.7% and 0.7% respectively.
… but the innovation divide between the Member States is widening.
The results for this year show the process of convergence in innovation performance within the EU has come to a halt: Less innovative countries as a group are no longer catching-up with the most innovative countries. This means that differences in innovation performance in the European Union have started to increase signalling a possible start of a process of divergence in Member States’ innovation performance.
While SMEs and commercialisation of innovation drive the innovation growth…
When looking at individual indicators, the EU innovation performance was driven most by
Innovating SMEs collaborating with others with an annual average growth rate of 7.9% on that indicator. Other key drivers of innovation performance in Europe were License and patent revenues from abroad as well as Community trademarks with growth rates of 6.1% and 5.2% respectively. Open, excellent and attractive research systems was another driver where the indicators for Non-EU doctorate students and International scientific publications grew at annual average rates of 4.1% and 4.0% respectively.
… business and venture capital investments are dropping the most.
The economic impact has its harshest impact on
Non R&D innovation expenditures which dropped by 5.2% annually, followed by Venture capital investments that were declining at an average rate of 3.1% annually. The finance and support to innovation was cushioned by R&D expenditures in the public sector which increased at an annual average rate of 3.2%. In general, a performance decline or lack of progress was observed on indicators that are affected by short-term decisions, while performance continued to improve on indicators that reflect decisions taken a longer period ago.
The progress since the launch of the Europe2020 strategy is insufficient…
Since the launch of the Europe 2020 Innovation Union flagship initiative in 2010, most of the Member States improved their innovation performance, in particular all innovation leaders and innovation followers except the UK. However, only few of the moderate innovators (Italy, Lithuania, Slovakia and Spain) and modest innovators (Latvia) managed to improve their innovation performance since the strategy was launched. In total, the innovation index has worsened in 9 countries: with a slight decline in United Kingdom (0.2%) as well as Poland, Czech Republic, Hungary, Portugal, Romania, Greece and the most dramatic deterioration in Bulgaria (-18.7%) and Malta (-16.0%).

Innovation Union Scoreboard 2013 |
7 |
|
… as mostly strong innovators increase their innovation growth rates.
Altogether the innovation leaders and followers managed to increase their innovation growth rates over the crisis period 2008-2012 while in the groups of moderate and modest innovators growth rates plummeted. A trend of divergence emerges where the leading innovators are getting even stronger while moderate and modest innovators fail to catch up.
Key strengths of innovation leaders are business activity and higher education sector…
The most innovative countries in the EU share a number of strengths in their national research and innovation systems with a key role of business activity and the higher education sector. The business sectors of all innovation leaders perform very well as measured by Business R&D expenditures and PCT patent applications. They also share a well-developed higher education sector as shown by very high scores on New doctorates graduates, International scientific copublications and Public-private co-publications with the latter also signalling strong linkages between industry and science.
… as well as balanced national research and innovation systems.
The overall good performance of the innovation leaders reflects a balanced national research and innovation system. It means that the innovation leaders have the smallest variance in their performance across all the 8 innovation dimensions. While each country has its own specificities, policy responses should attempt not only to address relative weaknesses in national research and innovation systems, but also to have more balanced performances across all categories of indicators.
Switzerland repeatedly outperforms all EU Member States…
Taking into account European countries outside the EU, Switzerland confirms its position as the overall Innovation leader continuously outperforming all EU27 countries. Iceland is one of the Innovation followers, Croatia, Norway and Serbia are Moderate innovators and the Former Yugoslav Republic of Macedonia and Turkey are Modest innovators.
… and South Korea and the US lead in a global international comparison.
Comparing the EU27 with a selected group of major global competitors, this year's Innovation Union Scoreboard edition again confirms that the US, Japan and South Korea have a performance lead over the EU27 with South Korea joining the US as most innovative country. Although this lead has been increasing for South Korea, the EU27 has been able to close almost half of the gap with the US and Japan since 2008. The global innovation leaders US, Japan and South Korea are particularly dominating the EU27 in indicators capturing business activity as measured by R&D expenditures in the business sector, Publicprivate co-publications and PCT patents but also in educational attainment as measured by the Share of population having completed tertiary education.
The EU27 continues to have a performance lead over Australia, Canada and all BRICS countries (Brazil, Russia, India, China and South Africa). However, this lead has been declining with China, remained stable with the other BRICS countries and has been increasing compared to Australia and Canada.
8 |
Innovation Union Scoreboard 2013 |
|
|
|
|
1. Introduction
The Innovation Union Scoreboard 2013 follows the methodology of previous editions in distinguishing between 3 main types of indicators – Enablers, Firm activities and Outputs – and 8 innovation dimensions, capturing in total 24 indicators. The IUS indicators are listed in Table 1 and full definitions are presented in Annex C.
The Enablers capture the main drivers of innovation performance external to the firm and differentiates between 3 innovation dimensions. ‘Human resources’ includes 3 indicators and measures the availability of a high-skilled and educated workforce. The indicators capture new doctorate graduates, those aged 30-34 with completed tertiary education and those aged 20-24 having completed at least upper secondary education. ‘Open, excellent and attractive research systems’ includes 3 indicators and measures the international competitiveness of the science base by focusing on the international scientific co-publications, most cited publications and non-EU doctorate students. ‘Finance and support’ includes 2 indicators and measures the availability of finance for innovation projects by venture capital investments and the support of governments for research and innovation activities by R&D expenditures by universities and government research organisations.
Firm activities capture the innovation efforts at the level of the firm and it differentiates between 3 innovation dimensions. ‘Firm investments’ includes 2 indicators of both R&D and non-R&D investments that firms make in order to generate innovations. ‘Linkages & entrepreneurship’ includes 3 indicators measuring innovation capabilities by looking at SMEs with that innovate in-house and collaboration efforts between innovating firms and research collaboration between the private and public sector. ‘Intellectual assets’ captures different forms of Intellectual Property Rights (IPR) generated as a throughput in the innovation process including PCT patent applications, Community trademarks and Community designs.
Outputs capture the effects of firms’ innovation activities and it differentiates between 2 innovation dimensions.‘Innovators’includes3indicatorsmeasuring the share of firms that have introduced innovations onto the market or within their organisations, covering both technological and non-technological innovations and the presence of high-growth firms. The indicator
on innovative high-growth firms corresponds to the new EU2020 headline indicator which is under development. ‘Economic effects’ includes 5 indicators and captures the economic success of innovation in employment in knowledge-intensive activities, the contribution of medium and high-tech product exports to the trade balance, exports of knowledge-intensive services, sales due to innovation activities and license and patent revenues from selling technologies abroad.
The Innovation Union Scoreboard uses the most recent statistics from Eurostat and other internationally recognised sources as available at the time of analysis. International sources have been used wherever possible in order to improve comparability between countries. It is important to note that the data relates to actual performance in 2008 (1 indicator), 2009 (2 indicators), 2010 (9 indicators) and 2011 (12 indicators) (these are the most recent years for which data are available as highlighted by the underlined years in Table 1). As a consequence the Innovation Union Scoreboard 2013 does not capture the most recent changes in innovation performance or the impact of policies introduced in recent years which may take some time to impact on innovation performance.
Compared to the IUS 2011, three indicators have changed. For two indicators definitions have been changed. First, the definition for venture capital investment has changed due to a new definition of the venture capital phases by the European Venture Capital Association (EVCA). The indicator now includes venture capital investments in the following stages: seed stage, start-up stage, later stage venture, growth capital, rescue/turnaround capital and replacement capital. Secondly, for PCT patent applications in societal challenges measuring health and environmental patents, the latter were captured in the IUS 2011 by applications in climate change mitigation but as updates for these data are no longer made available they have been replaced with applications in environment-related technologies. Thirdly, the IUS 2011 indicator on Medium and hightech product exports as a percentage share of total product exports has been replaced with an indicator measuring the Contribution of medium and high-tech product exports to the trade balance. These changes limit the direct comparability between the results of the current and last IUS editions.