

Учебное пособие 1944
.pdfIssue № 2(30), 2016 |
ISSN 2075-0811 |
On a sample area the subbase consisted of six base layers: semisolid or solid soil, clayey silt, sandy-argillaceous and solid clay.
Three characteristics were investigated: an average water content W, %, liquid limit WL, %, rolling limitation period WР, %. A relative humidity of a soil used in designing was given by the formula
a |
W . |
(1) |
|
W |
|
|
L |
|
The results of the study of the properties of soils show that the humidity of a soil, liquid limit, rolling limitation period change considerably.
A statistical processing of the experimental data on a water content of sandy-argillaceous soils was performed using the known method [7].
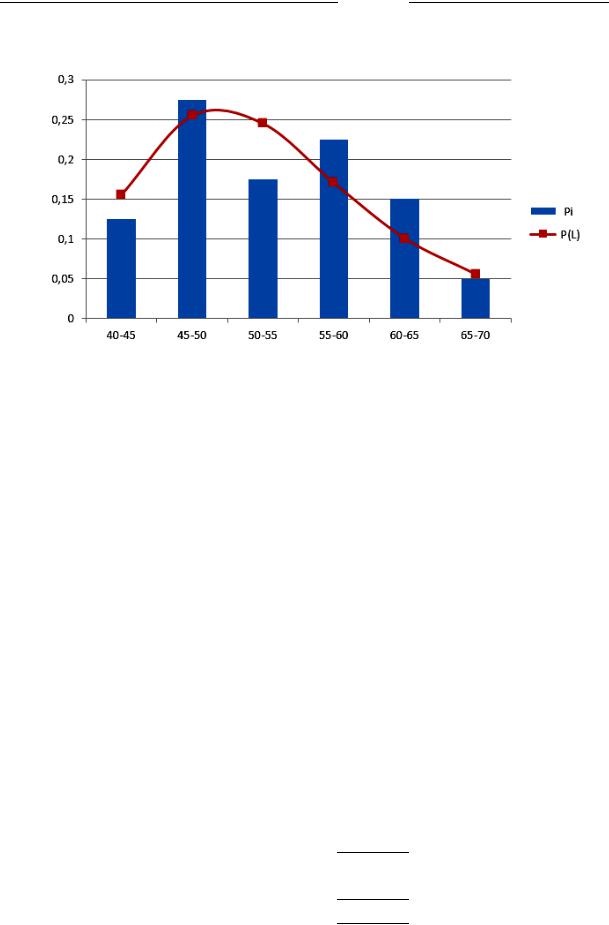
Based on the analysis of a histogram in Fig. 2, it was assumed that a water content is random in relation to the Weibull distribution which is generally the following:
F w n n (w c)n 1 e n t c n , |
(2) |
where w is a random variable; с is a parameter of a position determining the position of the beginning of a distribution in relation to the reference point; μ is the scale parameter; n is the shape parameter.
The probability of that was checked against the Pearson criterion Х2:
|
i |
(m* m)2 |
|
|
X 2 |
m 1 |
i |
, |
|
mi |
||||
|
|
|
where mi* are experimental frequencies; mi are theoretical frequencies.
Using the calculations and special tables, experimental and theoretical frequencies probability were determined. The results of the calculations are presented in Table 1.
(3)
and
|
|
|
|
Table 1 |
|
|
Results of statistical processing of experimental data on a water content of soils |
||||
|
|
|
|
Theoretical frequencies |
|
Scales |
Theoretical |
Experimental |
Theoretical frequencies |
||
frequencies |
frequencies |
(probability) |
|||
|
|
||||
|
|
|
|
0,155 |
|
40––45 |
5 |
0,125 |
6,2 |
||
|
|
|
|
0,255 |
|
45––50 |
11 |
0,275 |
10,2 |
||
|
|
|
|
0,245 |
|
50––55 |
7 |
0,175 |
9,8 |
||
|
|
|
|
0,17 |
|
55––60 |
9 |
0,225 |
6,8 |
||
|
|
|
|
0,1 |
|
60––65 |
6 |
0,15 |
4 |
||
|
|
|
|
0,06 |
|
65––70 |
2 |
0,05 |
2,2 |
||
|
|
|
|
|
|
41
Scientific Herald of t he Voronezh State University o f Architecture and Civil Engineering. Construction and Architecture
A distribution hist gram and theoretical urve of a w ater conten t are in Fig. 2.
Scale frequencies
W ater content, W %
Fig. 2. Distributi n histogram of water conte nt Pi
and balan cing theoretical curve of th e Weibull distribution PL
In order to see whether exp rimental data is part of the Weibull distri bution, the Pearson criterio n Х2 was used with a significance level of 0,01.
The calculations u ing Formula (3) showed that the Pearson cri erion is Х2 = 2,9.
The pro bability ta ble for the Pearson dis tribution at Х2 = 2,9, number of degrees of freedom N = 4 a nd significance level α = 0,1:
P(X 2 ,Ч ) P(2,9;4) 0,557 0,1. |
(4) |
Thus the assumpti n of a random variable being par of Weibull distribution is not de |
ied. |
Using the theoretic al distribution, the limits of confidence ranges of the random variable were identifi ed for diffe rent confide nce probab ility. The calculation results are shown in Table 2. Therefo re it can be argued that with the proba bility of 9 5 % water content o sandyargillac eous soils in this area is no less th an 42,65 % and no mo re than 63,85 %.
Table 2
Confide nce ranges of water conten t of sandy-ar gillaceous soils in the Mek ong delta
Confiden ce probability Р, % |
Mutu |
al confidence |
range for water content of soils, % |
|
|
4 |
|
95 |
|
2,65 < W < 63,85 |
|
|
|
4 |
|
90 |
|
4,38 < W < 62,12 |
|
|
|
|
|
42
Issue № 2(30), 2016 |
|
ISSN 2075-0811 |
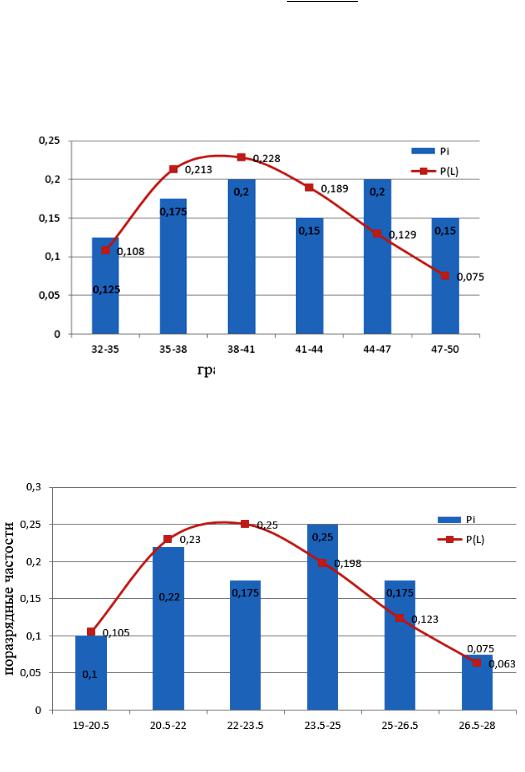
Similarly the experimental data for the liquid limit WL and rolling limitation period WP were calculated. These random variables wer e also iden ified using the Weibu ll distribution. The results of processin g are shown in Fig. 3, 4 and Table 3, 4.
Scale frequencies
 Liquid limit, %
Fig. 3. Distribution histogram of the liquid limit Pi
and balancing theoretical curve of the Weibul distribution PL
Scale frequencies
Rolling lim itation period, %
Fig. 4. Distribution histo gram of the rolling imitati on period Pi and balan cing theoretical curve of th e Weibull distribution PL
Thus it can be arg ued that wi th the prob ability of 9 5 % the liq uid limit of sandy-argillaceous soils in this area is no less than 33,85 % and no more than 48,61 %.
43

Scientific Herald of the Voronezh State University of Architecture and Civil Engineering. Construction and Architecture
|
Table 3 |
Confidence ranges of rolling limitation period of sandy-argillaceous soils in the Mekong delta |
|
|
|
Confidence probability Р, % |
Mutual confidence range of the rolling limitation period of soils, % |
|
|
95 |
33,85 < WL < 48,61 |
90 |
35 < WL < 47,5 |
|
Table 4 |
Confidence ranges of rolling limitation period of sandy-argillaceous soils in the Mekong delta |
|
|
|
Confidence probability Р, % |
Mutual confidence range of the rolling limitation period of soils, % |
|
|
95 |
19,87 < WP < 26,83 |
90 |
20,44 < WP < 26,26 |
Therefore with the probability of 95 % a rolling limitation period of sandy-argillaceous soils is no less than 19,87 % and no more than 26,26 %.
The obtained data allow one to create a database of subbases of an operating layer for designing non-rigid road pavements of the Republic of Vietnam.
Conclusions
1.We have examined information provision of computer-aided design of non-rigid road pavements of the Republic of Vietnam. Features of modern software for computer-aided design of road pavements have been investigated.
2.Based on the analysis of features of the soil of the Mekong delta, its water content was concluded to be a major consideration for research. The results of special engineering experiments have been shown to be crucial for calculation data.
3.According to the statistical processing, the distribution and confidence ranges of water contents of soils, liquid limit and rolling limitation period of sandy-argillaceous soils were obtained and checked against the Pearson criterion.
4.The results of the study are helpful in creating a database for soils of an operating layer for designing non-rigid road pavements of the Republic of Vietnam.
References
1.Gladysheva I. A. etc., Samodurova T. V., ed. Proektirovanie nezhestkikh dorozhnykh odezhd [Designing of nonrigid road clothes]. Voronezh, 2010. 156 p.
2.MODN 2-2001. Proektirovanie nezhestkikh dorozhnykh odezhd [Interstate branch road norms 2-2001 testing methods. Designing of nonrigid road clothes]. Moscow, 2002. 111 p.
3.Vermishev Yu. Kh. Osnovy avtomatizatsii proektirovaniya [Fundamentals of design automation]. Moscow, Radio i svyaz' Publ., 1988. 280 p.
44
Issue № 2(30), 2016 |
ISSN 2075-0811 |
4.Rezvantsev V. I., Bukhtoyarov A. V. Dorozhnye odezhdy na osnove mestnykh materialov. Optimizatsiya proektirovaniya [The pavement on the basis of local materials. Design optimization]. Voronezh, Izd-vo Voronezh. gos. un-ta, 2003. pp. 30—31.
5.Tyong N. V. [Weak soils on the territory of Vietnam in the Mekong Delta]. Trudy mezhdunarodnoy nauchno-prakticheskoy konferentsii «Tendentsii razvitiya tekhnicheskikh nauk» [Proc. of the international scientific-practical conference «Trends in the development of technical Sciences»]. Ufa, 2014. pp. 33—37.
6.Samodurova T. V., Tyong N. V. [The climatic features of the Republic of Vietnam in designing non-rigid pavements]. Trudy XVII Mezhdunarodnoy nauchno-prakticheskoy konferentsii «Nauchnoe obozrenie fizikomatematicheskikh i tekhnicheskikh nauk v ХХI veke». [Proceedings of the XVII International scientific and practical conference «Scientific review of physical-mathematical and technical science in XXI century»]. Moscow, 2015. pp. 87—89.
7.Zavadskiy Yu. V. Statisticheskaya obrabotka eksperimenta [Statistical treatment of experimental]. Moscow, Vysshaya shkola Publ., 1976. 270 p.
8.Samodurova T. V., Tyong N. V., Bondarev A. B. Sovershenstvovanie norm proektirovaniya transportnykh sooruzheniy dlya Respubliki V'etnam [Improving design standards of transport facilities for the Republic of Vietnam]. Nauchnyy vestnik Voronezhskogo GASU. Stroitel'stvo i arkhitektura, 2012, no. 4 (28), pp. 64—69.
9.Lenshin A. S., Kashkarov V. M., Seredin P. V., Spivak Yu. M., Moshnikov V. A. XANES and IR spectroscopy study of the electronic structure and chemical composition of porous silicon on n- and p-type substrates. Semiconductors, 2011, vol. 45, no. 9, p. 1183.
45

Scientific Herald of the Voronezh State University of Architecture and Civil Engineering. Construction and Architecture
UDC 621.9
L. V. Yankovskij
USE OF GEOMETRICAL PARAMETERS OF ROUGHNESS
FOR PREDICTING THE COEFFICIENT OF COUPLING IN ENGINEERING
CALCULATIONS OF ROUGH SURFACE TREATMENT
Perm National Research Polytechnical University
Russia, Perm, tel.: +7-912-78-59-176, e-mail: yanekperm@yandex.ru
PhD in Engineering, Assoc. Prof. of Dept. of Cars and Technological Machines
Statement of the problem. Presently the application of the rough surface treatment of pavings was widely adopted. A new edition of ODM “Recommendations on theDesign of Macrorough Pavings” assumes specification of a three-component chart for preliminary (estimated) determination of coefficient of coupling in designing new coverings with rough processing. Therefore the task of design of rough surface treatment with in advance set properties for rough pavings is becoming significant now.
Results. The three-component chart for preliminary determination of the coefficient of coupling in designing macrorough pavings is specified. The chart allows one to estimate the minimum in advance coupling coefficient which will provide rough surface treatment for specified geometrical parameters.
Conclusions. For design of a macrorough surface of a paving and a preliminary estimate its macrorouhghness it is possible to use an approximated value of coefficient of coupling with the help of the suggested specified three-component chart. This three-component chart can be a basis for creation by more exact with use of relative geometrical parameters of a macroroughness.
Keywords: coupling coefficient, macroroughness, rough surface treatment, road covering, highway, thin layers of wear.
Introduction
Macrorough road surfaces are independent construction elements of roadways and bridges which are designed in order to reduce emergency rates, improve the road safety, comfort, travelling intensity and stability thus providing required speeds and loading capacities. Surfaces should provide minimum contaminant exposure to adjacent areas as well as maintenance opportunities and long life cycles, be easy to use and cost-efficient.
© Yankovsky L. V., 2016
46
Issue № 2(30), 2016 |
ISSN 2075-0811 |
Macrorough surfaces are rough surface treatments, nielloed crushed stone into cast asphalt concrete of bridge roadways, anti-skidding, paving of pedestrian bridges, anti-ice road pavings with maximum macroroughness, access to disabled individuals, etc.
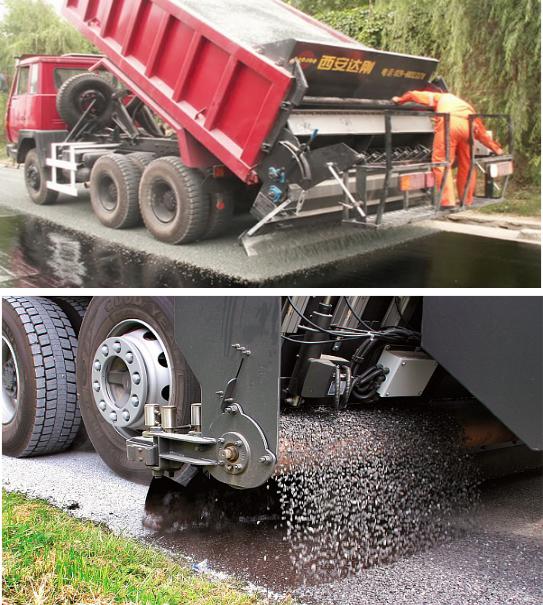
Presently a modern method for designing macrorough road surfaces is distribution of crushed stone along a road paving surface using bitumen crushed stone distributors followed by rolling with lightweight rollers. Simultaneous distribution of crushed stone and binder causes them to bond well thus providing the required operational parameters of surface treatment of a roadway paving. Bitumen crushed stone distributors can operate backwards and forward (Fig. 1).
Fig. 1. Options for the backward and forward operation of bitumen crushed stone distributors
47

Scientific Herald of t he Voronezh State University o f Architecture and Civil Engineering. Construction and Architecture
According to statistics, the adhesion of |
the wheel and surf ce contributes to fe |
er road |
accidents. The rou ghness parameters of |
a surface and adhesion coefficient φ are |
mutually |
depend ent. Effect of macroro ugh roadw ay surfaces on changes in the adhesion coefficient (given vehicle’s travelling s peed) is sho wn in Fig. 2.
Designing a macr |
rough surface is key to improvi ng the skidding resista nce of tires, which |
provides required |
adhesion co efficients. Therefore acroroughness parameters are crucial for |
road pavements. T hey make up differe nt textures with their own unique properties [1, 2]. Therefo re the issue of selecting new technologies and relevant materials involved in designing rough s urfaces is gaining m omentum. This is particularly the case for materials f rough layers of road pavements [3]. 
Sandy asphalt concrete
Rough roa d pavement
V , km/h
Fig. 2. Graph of the adhesion coefficient φ for diff rent rough surfaces of road pavements (at different travelling speeds according to Yu.N. Kuznetsov)
1. Desi gning geom etric parameters. The adhesion coefficient is an indiv dual chara cteristics of road pavements influencing dynamic properties of vehicles (speed, driving force, braking distanc , acceleration) which depend on a type of a vehicle, wheel loads, travelling speed, quality and size of tires, con dition of tracks, tire pressure a s well as type of a pavement material, its smoothness, roughness and weather c onditions ( dry, wet, s nowy, muddy, icy). Therefo re the adhesion coefficient depends on the properties o vehicles and road pa vements. It can be significa ntly increased due to a roadway component by increasi ng the tire adhesion of a roa d pavemen t material, making it reasonably rough, the surface clean and eve n and so can dyn amic characteristics of a vehicle and safety. As can be seen, it is d aunting to estimate the adhesion coefficient in particular roadway area. While designin macrorough road
48
Issue № 2(30), 2016 |
ISSN 2075-0811 |
surfaces, it is necessary to provide appropriate adhesion coefficients. This takes four stages: [3, 4]:
1)collecting and analyzing original data;
2)designing major constructional and operational properties of a surface layer;
3)designing a technology of laying a surface layer;
4)developing guidelines for maintenance of a surface layer of roadways.
In a new project “Guidelines on Macrorough Road Surfaces” developed under the author’s supervision as part of a task designed by the Federal Road Agency there is a table of adhesion coefficients depending on a specified macroroughness level (Table 1).
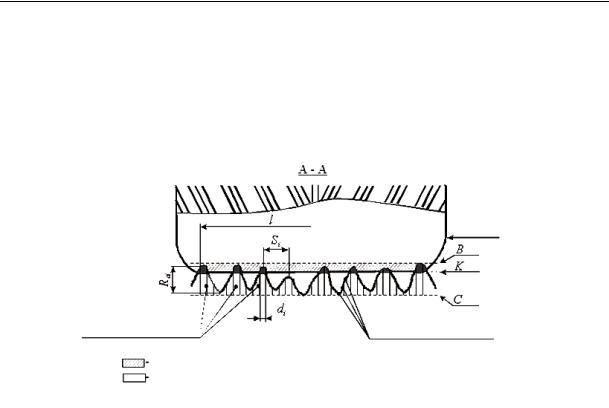
Elements and geometric parameters of roughness are in Fig. 3 [5].
Table 1
Classification of road pavements according to macroroughness levels
|
|
к |
к |
square-mean-Root deviation of macroroughnessσ |
|
Transport operational characteristics |
|
|||||
|
|
|
|
|
|
|
|
|
|
|||
Macroroughnesslevel |
aofActivitymacroroughness surfaceelement(point) |
activityRelativeof a contact Q |
densityRelativeof a contact N |
aofDensitymacroroughness elementρ |
|
for adverse conditions of a surface |
|
|||||
|
|
|
|
|
|
|
||||||
adhesionMinimum nocoefficient,less than |
|
resistanceTraffic nocoefficient,more than |
level,SounddB, morenothan |
travellingMaximumspeed, morenokm/h,than |
distance,Brakingm, |
thanlessno |
||||||
|
|
|
|
mm , |
|
|
|
|
|
|
|
|
|
|
|
|
аср |
|
|
|
|
|
|
|
|
|
|
|
|
|
|
|
|
|
|
|
|
|
Non-rough |
1 |
1,0 |
1,0 |
Less than |
From 0,5 |
0,35 |
|
0,05 |
50 |
90 |
|
90 |
1,0 |
to 0,7 |
|
|
|||||||||
|
|
|
|
|
|
|
|
|
|
|
||
|
|
|
|
|
|
|
|
|
|
|
|
|
Rough |
2 |
From 1,0 |
From 1,0 |
From 1,0 |
From 0,4 |
0,40 |
|
0,06 |
60 |
100 |
|
86 |
to 1,5 |
to 1,5 |
to 2,0 |
to 0,65 |
|
|
|||||||
|
|
|
|
|
|
|
|
|
||||
|
|
|
|
|
|
|
|
|
|
|
|
|
Average |
3 |
From 1,5 |
From 1,5 |
From 2,0 |
From 0,3 |
0,45 |
|
0,07 |
70 |
110 |
|
77 |
rough |
to 2,0 |
to 2,0 |
to 3,0 |
to 0,65 |
|
|
||||||
|
|
|
|
|
|
|
|
|||||
|
|
|
|
|
|
|
|
|
|
|
|
|
Extremely |
4 |
More |
More |
More |
From 0,2 |
0,50 |
|
0,08 |
80 |
110 |
|
64 |
rough |
than 2,0 |
than 2,0 |
than 3,0 |
to 0,6 |
|
|
||||||
|
|
|
|
|
|
|
|
|||||
|
|
|
|
|
|
|
|
|
|
|
|
|
In addition there are new major geometric parameters of macroroughness:
1)an average rut depth (height of uneven surfaces);
2)an average macroroughness step;
3)macroroughness density;
4)relative density of macroroughness contacts;
5)different heights of active macroroughness protuberances;
49
Scientific Herald of the Voronezh State University of Architecture and Civil Engineering. Construction and Architecture
6)different depths of macroroughness protuberances;
7)different distances between crushed stone aggregates.
The last three parameters are evaluated using root-mean-square values (dispersion) and correlation coefficient [6, 7].
Wheel
Macroroughness elements |
|
|
Microroughness elements |
||
|
|
|
Active roughness area
Passive roughness area
Fig. 3. Elements and parameters of macroroughness:
К— basic density of a wheel surface in a contact area with macroroughness elements;
С— flatness of the largest protuberances in a wheel contact area; В — flatness of the largest protuberances of a profile of a wheel contact area; l — basic length, mm; Dм — size of a wheel track imprint of a design car, mm;
Si — step of local protuberances within a basic length, mm; di — step of a wheel contact within a basic length, mm;
Rai — specific rut depth (distance between adjoining tops and rut onto a vertical axis), mm
2. Trigrams for determining macroroughness levels. Trigrams (Fig. 4) were previously proposed by A.A. Serbienko and A.V. Kochetkov for operational control of adhesion of macrorough road surfaces as well as wear and tear of a rough surface [8]. But this trigram cannot evaluate geometric parameters of macroroughness using the adhesion coefficient. According to A.A. Serbinenko, in order to evaluate qualitative characteristics of macroroughness of road surfaces using a specified adhesion coefficient, the following will suffice:
1)height of a roughness protuberance, mm, which is determined in relation to a basic surface using a nominal section profile within a basic length. The height of protuberances can be identified using a dot roughness profile gauge (similarly to SoyuzdorNII PKSh-4 device);
2)density of roughness elements, el/dm2 which is determined using the number of roughness protuberances within a tire imprint on a rough pavement surface. It is identified according to the number of imprints of roughness elements on an area of 10×20 cm on an imprint surface;
50