

PS-2020a / part14
.pdfDICOM PS3.14 2020a - Grayscale Standard Display Function |
Page 61 |
|
256 |
|
|
|
|
|
192 |
|
|
|
|
LEVEL |
|
|
|
|
|
DIGITAL DRIVING |
128 |
|
|
|
|
|
|
|
|
|
|
|
64 |
|
|
|
|
|
0 |
64 |
128 |
192 |
256 |
|
0 |
||||
|
|
|
P-VALUE |
|
|
Figure D.3-2. Transformation for modifying the Characteristic Curve of the printer to a Display Function
that approximates the Grayscale Standard Display Function
Table D.3-1. Look-Up Table for Calibrating Reflection Hardcopy System
P-Value |
DDL |
P-Value |
DDL |
P-Value |
DDL |
P-Value |
DDL |
0 |
6 |
1 |
9 |
2 |
12 |
3 |
15 |
4 |
18 |
5 |
20 |
6 |
27 |
7 |
29 |
8 |
30 |
9 |
31 |
10 |
31 |
11 |
32 |
12 |
33 |
13 |
33 |
14 |
34 |
15 |
36 |
16 |
38 |
17 |
40 |
18 |
41 |
19 |
42 |
20 |
43 |
21 |
44 |
22 |
45 |
23 |
59 |
24 |
60 |
25 |
61 |
26 |
62 |
27 |
62 |
28 |
63 |
29 |
63 |
30 |
64 |
31 |
64 |
32 |
65 |
33 |
65 |
34 |
65 |
35 |
66 |
36 |
66 |
37 |
67 |
38 |
67 |
39 |
68 |
40 |
70 |
41 |
74 |
42 |
75 |
43 |
76 |
44 |
78 |
45 |
84 |
46 |
85 |
47 |
86 |
48 |
87 |
49 |
87 |
50 |
88 |
51 |
89 |
52 |
89 |
53 |
91 |
54 |
92 |
55 |
94 |
56 |
95 |
57 |
96 |
58 |
97 |
59 |
97 |
60 |
98 |
61 |
99 |
62 |
99 |
63 |
100 |
64 |
101 |
65 |
102 |
66 |
103 |
67 |
104 |
68 |
105 |
69 |
106 |
70 |
107 |
71 |
108 |
72 |
109 |
73 |
110 |
74 |
112 |
75 |
114 |
76 |
116 |
77 |
118 |
78 |
119 |
79 |
120 |
80 |
121 |
81 |
122 |
82 |
122 |
83 |
123 |
- Standard -

Page 62 |
|
DICOM PS3.14 2020a - Grayscale Standard Display Function |
|
|
|||
P-Value |
DDL |
P-Value |
DDL |
P-Value |
DDL |
P-Value |
DDL |
84 |
123 |
85 |
124 |
86 |
125 |
87 |
125 |
88 |
126 |
89 |
126 |
90 |
127 |
91 |
127 |
92 |
128 |
93 |
129 |
94 |
130 |
95 |
131 |
96 |
133 |
97 |
134 |
98 |
135 |
99 |
136 |
100 |
136 |
101 |
137 |
102 |
138 |
103 |
138 |
104 |
139 |
105 |
139 |
106 |
140 |
107 |
141 |
108 |
143 |
109 |
145 |
110 |
147 |
111 |
148 |
112 |
149 |
113 |
150 |
114 |
151 |
115 |
152 |
116 |
153 |
117 |
154 |
118 |
154 |
119 |
155 |
120 |
156 |
121 |
156 |
122 |
157 |
123 |
158 |
124 |
159 |
125 |
160 |
126 |
160 |
127 |
162 |
128 |
163 |
129 |
164 |
130 |
165 |
131 |
166 |
132 |
167 |
133 |
168 |
134 |
169 |
135 |
170 |
136 |
170 |
137 |
171 |
138 |
172 |
139 |
172 |
140 |
173 |
141 |
174 |
142 |
175 |
143 |
175 |
144 |
176 |
145 |
177 |
146 |
178 |
147 |
179 |
148 |
179 |
149 |
180 |
150 |
181 |
151 |
182 |
152 |
182 |
153 |
183 |
154 |
184 |
155 |
184 |
156 |
185 |
157 |
186 |
158 |
186 |
159 |
187 |
160 |
187 |
161 |
188 |
162 |
188 |
163 |
189 |
164 |
189 |
165 |
190 |
166 |
190 |
167 |
190 |
168 |
191 |
169 |
191 |
170 |
192 |
171 |
192 |
172 |
192 |
173 |
193 |
174 |
194 |
175 |
194 |
176 |
195 |
177 |
195 |
178 |
196 |
179 |
197 |
180 |
198 |
181 |
199 |
182 |
199 |
183 |
200 |
184 |
200 |
185 |
201 |
186 |
202 |
187 |
202 |
188 |
203 |
189 |
203 |
190 |
204 |
191 |
204 |
192 |
205 |
193 |
205 |
194 |
206 |
195 |
207 |
196 |
207 |
197 |
208 |
198 |
209 |
199 |
210 |
200 |
211 |
201 |
212 |
202 |
213 |
203 |
214 |
204 |
214 |
205 |
215 |
206 |
216 |
207 |
216 |
208 |
217 |
209 |
218 |
210 |
219 |
211 |
219 |
212 |
220 |
213 |
220 |
214 |
221 |
215 |
222 |
216 |
222 |
217 |
223 |
218 |
223 |
219 |
224 |
220 |
224 |
221 |
225 |
222 |
226 |
223 |
226 |
224 |
227 |
225 |
228 |
226 |
228 |
227 |
230 |
228 |
231 |
229 |
232 |
230 |
234 |
231 |
235 |
232 |
236 |
233 |
238 |
234 |
238 |
235 |
239 |
236 |
240 |
237 |
241 |
238 |
242 |
239 |
242 |
240 |
243 |
241 |
244 |
242 |
245 |
243 |
246 |
244 |
247 |
245 |
248 |
246 |
249 |
247 |
250 |
248 |
250 |
249 |
251 |
250 |
251 |
251 |
252 |
- Standard -
|
|
DICOM PS3.14 2020a - Grayscale Standard Display Function |
|
Page 63 |
|||
P-Value |
DDL |
P-Value |
DDL |
P-Value |
DDL |
P-Value |
DDL |
252 |
252 |
253 |
253 |
254 |
253 |
255 |
254 |
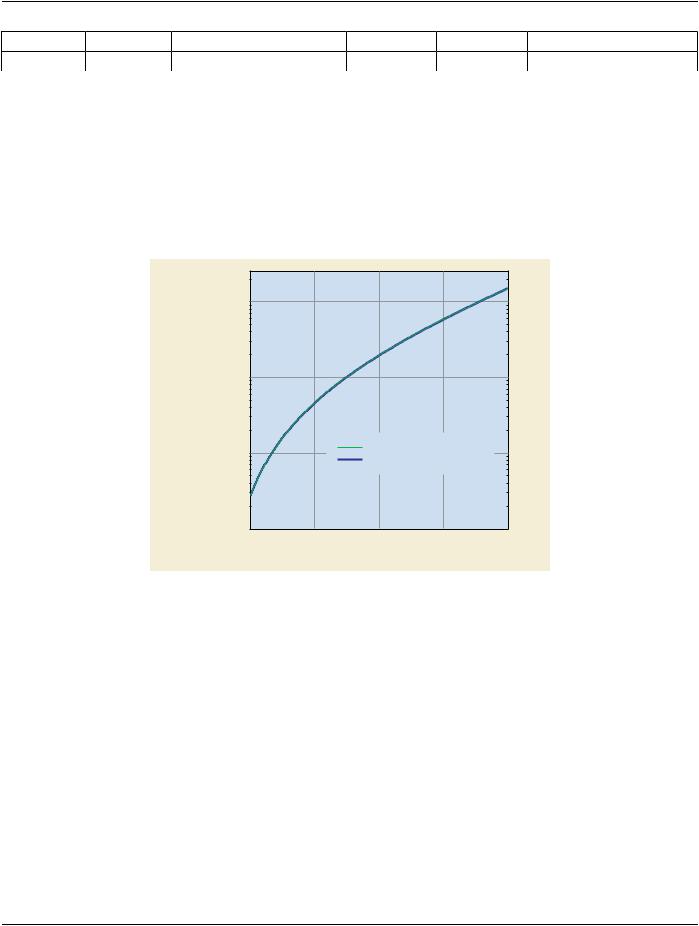
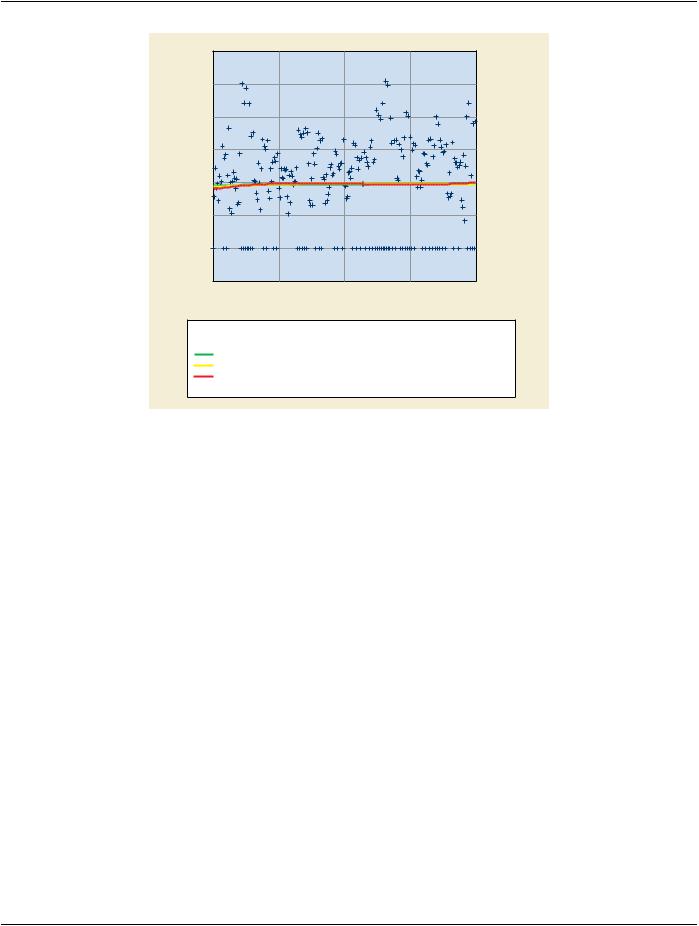
D.3.4 Measures of Conformance
The FIT and LUM metrics as proposed in Annex C are applied to determine the macroscopic and microscopic approximation of the LJ,m to the LI,STD. Figure D.3-3 shows the perceptually linearized Display Function superimposed on the Grayscale Standard Display FunctionandFigureD.3-4summarizestheresultsofthetwometrics.FITprovidesasbestfitoftheJNDs/Luminanceintervalastraight line almost perfectly parallel to the horizontal axis indicating good global fit of the transformed Display Function with the Grayscale Standard Display Function. The RMSE computed by LUM is relatively large indicating more pronounced local deviations from the Grayscale Standard Display Function as, for example, with the soft-copy Display System illustrated in Section D.1. At least in part, the larger RMSE is due to the fact that the input and output digitization resolution for the transform are equal. The transformation table (Table D.3-1) and Figure D.3-2 show that several P-Values lead to the same Luminance levels on the transformed Display Function. In fact, only 205 of the 255 Luminance intervals lead to JNDs for the Standard Target.
100 |
|
|
|
|
10 |
|
|
|
|
LUMINANCE |
|
|
|
|
[CD/M2] |
|
|
|
|
1 |
|
Standard Display Function |
|
|
|
Transformed Display Function |
|
||
|
|
|
||
0.1 |
64 |
128 |
192 |
256 |
0 |
||||
DIGITAL DRIVING LEVEL
Figure D.3-3. Transformed Display Function and superimposed Grayscale Standard Display Function for a reflective hard-copy Display System. The transformed Display Function for this Display System matches the Grayscale Standard Display Function and the two curves are superimposed and indistinguishable.
- Standard -
Page 64 |
DICOM PS3.14 2020a - Grayscale Standard Display Function |
N, JNDs/LUMINANCE INTERVAL
6
5
4
3
2
1
0
-1
0 64 128 192 256
I, INDEX OF LUMINANCE INTERVAL
MEAN = 1.9261
STD DEV = 1.3450
LINEAR FIT: N = 2.4175E-4 * I + 1.9253; R-Squared = 1.7714E-4
QUADRATIC FIT: N = -4.1266E-6 * I2 + 1.294E-3 * I + 1.8807; R-Squared = 4.0263E-4
CUBIC FIT: N = 8.6019E-8 * I3 - 3.7029E-5 * I2 + 4.6435E-3 * I + 1.8103; R-Squared = 8.1537E-4
192 JNDs REALIZABLE
Figure D.3-4. Measures of conformance for a reflective hard-copy Display System with equal input and output digitization resolution of 8 bits
- Standard -

DICOM PS3.14 2020a - Grayscale Standard Display Function |
Page 65 |
E Realizable JND Range of a Display Under Ambient Light (Informative)
Dynamic rangeis an often used measures of the information content that can be presented by a Display System. However, there are many definitions of dynamic range, and most such definitions do not take into account real world conditions that affect the actual amount of information that can be conveyed by a gray scale pixel. For example, Poynton [E1] refers to the contrast ratioof a gray scale display device as the ratio of display intensity between the brightest white and the darkest black of the particular display device in question. However, this definition of dynamic range applies to ideal viewing conditions. Real world conditions such as veiling glare, noise, spatial frequency content of the image, power supply saturation, and ambient lighting in a cathode ray tube (CRT) based viewing situation can degrade the measured dynamic range of the system significantly [E2, E3]. Because of all of these variables dynamic range is an ill-defined concept for a Display System.
Note
Veiling Glare isthephenomenonwhereininternallightreflectionsinsidetheCRTcreatesa"backgroundlighting"thusreducing the contrast range of the CRT device.
The methods used to determine the degree to which the Display Function of a Display System approximates the Grayscale Standard Display Function can also be used to define two measures that might better characterize the potential capabilities of a Display System to convey information content. Two measures, the theoretically achievable JNDs and the realized JNDs, are useful for comparing Display Systems [E4].
The number of theoretically achievable JNDs is simply the number of JNDs predicted by the visual model given the Luminance Range of the Display System used. The number of theoretically achievable JNDs of a Display System may be found from Table B-1 by counting the number of JNDs in the table that fall between the measured minimum and maximum Luminance of the Display System.
This number of JNDs may not actually be achievable due to resolution limitations of other portions of the Display System, in particular, the quantization resolution given by the finite number of bits per pixel driving the Display System. For example, Table B-1 may show that a particular Display System is capable of delivering 352 JNDs. However, if only 8 bits per pixel are presented to the Display System, the number of JNDs achievable cannot exceed 2 8= 256 JNDs because of the quantizing effect. In actual fact, the number of JNDs realized in a Display System will always be smaller than or equal to the lower of the theoretically achievable JNDs and the quantization limit. This is because some of the quantized values input to the display may not line up with the input value required to achieve the next JND.
The more useful number of realized JNDs, describes how many JNDs are actually achieved given the specifics of the Display System (i.e., the number of gray levels of contrast resolution and the distribution of Luminance values). This definition gives a measure of the information that can actually be conveyed by the system to a human observer, in essence, an informational dynamic range. This number is calculated beginning at the minimum Luminance of the Display System, and then stepping one JND in Luminance from the current Luminance value, and choosing the smallest increment in DDL value that achieves a step at least that large. Repeating this through all the available DDLs will produce a sequence of steps, all at least 1 JND apart, and the length of this sequence of steps is then the number of realizable JNDs of the Display System.
The methods of PS3.14 cannot precisely duplicate all of the real world sources of degradation in a Display System. However, this uniform method of determining the realizable number of JNDs should give a measure of the actual performance of a particular Display System that would be experienced by a human observer when using the Display System in a real world situation such as the viewing of radiological images in medicine.
References
[E1] Poynton, C. "Frequently Asked Questions about Gamma",Internet ftp://ftp.inforamp.net/pub/users/poynton/doc/colour/gamma- FAQ.pdf
[E2] Roehrig, H., Blume, H., Ji, T. and Browne, M.; "Performance Tests and Quality Control of Cathode Ray Tube Displays"; J. Digital Imaging, Vol. 3, No. 3, August 1990; pp. 134-145.
[E3] Gray, J.; "Use of the SMPTE Test Pattern in Picture Archiving and Communication Systems"; J. Digital Imaging, Vol. 5, No. 1, February 1992; pp. 54-58.
- Standard -

Page 66 |
DICOM PS3.14 2020a - Grayscale Standard Display Function |
[E4]Hemminger,B.,Muller,K.,"PerformanceMetricforevaluatingconformanceofmedicalimagedisplayswiththeACR/NEMAdisplay function standard", SPIE Medical Imaging 1997, editor Yongmin Kim, vol 3031-25, 1997.
- Standard -