

PS-2020a / part14
.pdf
|
|
DICOM PS3.14 2020a - Grayscale Standard Display Function |
|
Page 51 |
|||
DDL |
Luminance |
DDL |
Luminance |
DDL |
Luminance |
DDL |
Luminance |
88 |
4.456 |
89 |
4.608 |
90 |
4.766 |
91 |
4.944 |
92 |
5.104 |
93 |
5.268 |
94 |
5.444 |
95 |
5.630 |
96 |
5.864 |
97 |
6.050 |
98 |
6.238 |
99 |
6.438 |
100 |
6.610 |
101 |
6.820 |
102 |
7.024 |
103 |
7.224 |
104 |
7.428 |
105 |
7.644 |
106 |
7.872 |
107 |
8.066 |
108 |
8.298 |
109 |
8.528 |
110 |
8.752 |
111 |
8.982 |
112 |
9.330 |
113 |
9.574 |
114 |
9.796 |
115 |
10.060 |
116 |
10.314 |
117 |
10.560 |
118 |
10.820 |
119 |
11.080 |
120 |
11.340 |
121 |
11.620 |
122 |
11.880 |
123 |
12.180 |
124 |
12.460 |
125 |
12.700 |
126 |
13.020 |
127 |
13.300 |
128 |
13.720 |
129 |
14.020 |
130 |
14.360 |
131 |
14.640 |
132 |
14.940 |
133 |
15.300 |
134 |
15.600 |
135 |
15.900 |
136 |
16.240 |
137 |
16.560 |
138 |
16.920 |
139 |
17.220 |
140 |
17.600 |
141 |
17.940 |
142 |
18.240 |
143 |
18.640 |
144 |
19.120 |
145 |
19.460 |
146 |
19.800 |
147 |
20.260 |
148 |
20.560 |
149 |
20.920 |
150 |
21.360 |
151 |
21.760 |
152 |
22.060 |
153 |
22.520 |
154 |
22.960 |
155 |
23.300 |
156 |
23.700 |
157 |
24.080 |
158 |
24.600 |
159 |
24.980 |
160 |
25.520 |
161 |
26.040 |
162 |
26.480 |
163 |
26.700 |
164 |
27.380 |
165 |
27.620 |
166 |
28.040 |
167 |
28.580 |
168 |
28.980 |
169 |
29.400 |
170 |
29.840 |
171 |
30.540 |
172 |
30.800 |
173 |
31.380 |
174 |
31.880 |
175 |
32.400 |
176 |
33.060 |
177 |
33.400 |
178 |
34.040 |
179 |
34.400 |
180 |
34.840 |
181 |
35.360 |
182 |
35.900 |
183 |
36.400 |
184 |
37.060 |
185 |
37.400 |
186 |
38.300 |
187 |
38.420 |
188 |
39.160 |
189 |
39.760 |
190 |
39.980 |
191 |
40.840 |
192 |
41.540 |
193 |
41.900 |
194 |
42.800 |
195 |
43.060 |
196 |
43.620 |
197 |
44.520 |
198 |
44.620 |
199 |
45.500 |
200 |
46.100 |
201 |
46.380 |
202 |
47.400 |
203 |
47.600 |
204 |
48.320 |
205 |
49.060 |
206 |
49.380 |
207 |
50.320 |
208 |
50.920 |
209 |
51.600 |
210 |
52.420 |
211 |
52.680 |
212 |
53.520 |
213 |
54.220 |
214 |
54.620 |
215 |
55.420 |
216 |
56.100 |
217 |
56.600 |
218 |
57.400 |
219 |
57.820 |
220 |
58.660 |
221 |
59.320 |
222 |
59.800 |
223 |
60.720 |
224 |
61.520 |
225 |
62.240 |
226 |
63.040 |
227 |
63.480 |
228 |
64.460 |
229 |
65.020 |
230 |
65.500 |
231 |
66.500 |
232 |
66.960 |
233 |
67.840 |
234 |
68.600 |
235 |
68.980 |
236 |
70.040 |
237 |
70.520 |
238 |
71.420 |
239 |
72.180 |
240 |
72.900 |
241 |
73.980 |
242 |
74.580 |
243 |
75.320 |
244 |
76.200 |
245 |
76.540 |
246 |
77.720 |
247 |
78.220 |
248 |
79.200 |
249 |
79.880 |
250 |
80.420 |
251 |
81.560 |
252 |
81.960 |
253 |
83.140 |
254 |
83.720 |
255 |
84.340 |
- Standard -

Page 52 |
DICOM PS3.14 2020a - Grayscale Standard Display Function |
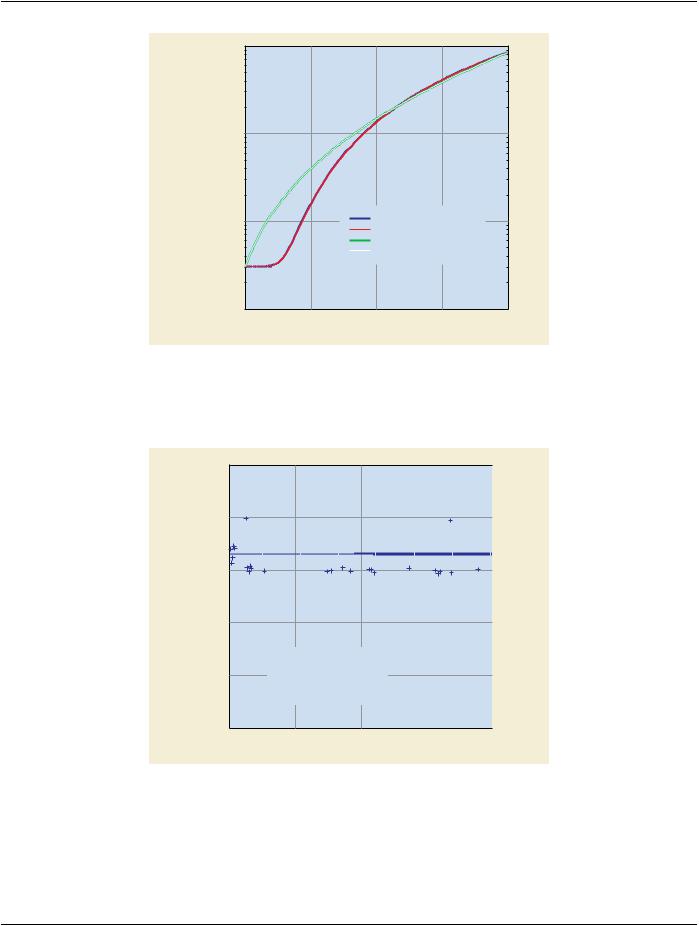
D.1.2 Application of the Standard Formula
The section of the Grayscale Standard Display Function for the Luminance Range of the CRT monitor Display System is shown in FigureD.1-3.MinimumandmaximumLuminancelevelscorrespondtoJNDindicesofJNDmin =32.54andJNDmax =453.85,respectively. Thus, there are theoretically about 420 just-noticeable Luminance differences for the Standard Target (see Normative Section 6). Obviously, with 8-bit input digitization resolution, at best 256 noticeable Luminance increments can be realized.
D.1.3 Implementation of the Standard
The measured Characteristic Curve is interpolated for the available output levels Doutput, in this case, yielding 1024 Luminance levels LI,m. The Grayscale Standard Display Function is also interpolated between JNDmin and JNDmax ((JND= [JNDmax - JNDmin]/1023 =
[453.85 - 32.54]/1023) yielding 1024 Standard Luminance levels LI,STD. Interpolations can be performed by a variety of techniques. Here, a cubic spline technique was employed.
For every LI,STD, the closest LJ,m is determined. The data pair I,J defines the transformation between Dinput and Doutput (Table D.1-2) by which the Luminance response of the Display System is made to approximate the Grayscale Standard Display Function.
Table D.1-2. Look-Up Table for Calibrating Display System
Input |
Output |
Input |
Output |
Input |
Output |
Input |
Output |
0 |
0 |
1 |
118 |
2 |
131 |
3 |
140 |
4 |
148 |
5 |
153 |
6 |
160 |
7 |
164 |
8 |
169 |
9 |
173 |
10 |
178 |
11 |
182 |
12 |
185 |
13 |
189 |
14 |
191 |
15 |
194 |
16 |
198 |
17 |
201 |
18 |
204 |
19 |
207 |
20 |
210 |
21 |
214 |
22 |
217 |
23 |
219 |
24 |
222 |
25 |
225 |
26 |
228 |
27 |
231 |
28 |
234 |
29 |
237 |
30 |
240 |
31 |
243 |
32 |
245 |
33 |
248 |
34 |
251 |
35 |
253 |
36 |
255 |
37 |
257 |
38 |
260 |
39 |
263 |
40 |
265 |
41 |
268 |
42 |
271 |
43 |
274 |
44 |
276 |
45 |
279 |
46 |
282 |
47 |
284 |
48 |
287 |
49 |
290 |
50 |
292 |
51 |
295 |
52 |
298 |
53 |
301 |
54 |
303 |
55 |
306 |
56 |
308 |
57 |
311 |
58 |
314 |
59 |
317 |
60 |
319 |
61 |
320 |
62 |
323 |
63 |
326 |
64 |
329 |
65 |
331 |
66 |
334 |
67 |
336 |
68 |
339 |
69 |
342 |
70 |
345 |
71 |
347 |
72 |
350 |
73 |
353 |
74 |
356 |
75 |
359 |
76 |
361 |
77 |
364 |
78 |
367 |
79 |
370 |
80 |
372 |
81 |
375 |
82 |
378 |
83 |
381 |
84 |
383 |
85 |
385 |
86 |
388 |
87 |
391 |
88 |
393 |
89 |
396 |
90 |
399 |
91 |
402 |
92 |
405 |
93 |
407 |
94 |
410 |
95 |
413 |
96 |
416 |
97 |
419 |
98 |
422 |
99 |
425 |
100 |
428 |
101 |
431 |
102 |
434 |
103 |
437 |
104 |
440 |
105 |
443 |
106 |
445 |
107 |
448 |
108 |
450 |
109 |
452 |
110 |
456 |
111 |
459 |
- Standard -

|
|
DICOM PS3.14 2020a - Grayscale Standard Display Function |
|
Page 53 |
|||
Input |
Output |
Input |
Output |
Input |
Output |
Input |
Output |
112 |
462 |
113 |
465 |
114 |
468 |
115 |
471 |
116 |
474 |
117 |
477 |
118 |
480 |
119 |
483 |
120 |
486 |
121 |
490 |
122 |
492 |
123 |
495 |
124 |
499 |
125 |
502 |
126 |
505 |
127 |
509 |
128 |
511 |
129 |
513 |
130 |
516 |
131 |
519 |
132 |
522 |
133 |
526 |
134 |
529 |
135 |
532 |
136 |
535 |
137 |
539 |
138 |
542 |
139 |
545 |
140 |
549 |
141 |
552 |
142 |
555 |
143 |
559 |
144 |
562 |
145 |
565 |
146 |
569 |
147 |
572 |
148 |
575 |
149 |
578 |
150 |
581 |
151 |
585 |
152 |
588 |
153 |
591 |
154 |
595 |
155 |
599 |
156 |
602 |
157 |
605 |
158 |
609 |
159 |
613 |
160 |
616 |
161 |
619 |
162 |
623 |
163 |
627 |
164 |
631 |
165 |
633 |
166 |
637 |
167 |
640 |
168 |
643 |
169 |
646 |
170 |
650 |
171 |
655 |
172 |
657 |
173 |
663 |
174 |
666 |
175 |
669 |
176 |
674 |
177 |
678 |
178 |
682 |
179 |
684 |
180 |
688 |
181 |
693 |
182 |
696 |
183 |
700 |
184 |
703 |
185 |
706 |
186 |
711 |
187 |
714 |
188 |
719 |
189 |
723 |
190 |
727 |
191 |
731 |
192 |
735 |
193 |
738 |
194 |
743 |
195 |
745 |
196 |
752 |
197 |
754 |
198 |
758 |
199 |
764 |
200 |
766 |
201 |
769 |
202 |
775 |
203 |
777 |
204 |
783 |
205 |
787 |
206 |
789 |
207 |
796 |
208 |
799 |
209 |
805 |
210 |
808 |
211 |
811 |
212 |
818 |
213 |
821 |
214 |
827 |
215 |
830 |
216 |
834 |
217 |
838 |
218 |
841 |
219 |
848 |
220 |
851 |
221 |
856 |
222 |
861 |
223 |
864 |
224 |
870 |
225 |
874 |
226 |
880 |
227 |
883 |
228 |
889 |
229 |
893 |
230 |
897 |
231 |
901 |
232 |
905 |
233 |
911 |
234 |
915 |
235 |
922 |
236 |
925 |
237 |
931 |
238 |
935 |
239 |
941 |
240 |
945 |
241 |
951 |
242 |
955 |
243 |
960 |
244 |
964 |
245 |
969 |
246 |
975 |
247 |
979 |
248 |
985 |
249 |
991 |
250 |
995 |
251 |
1002 |
252 |
1006 |
253 |
1012 |
254 |
1016 |
255 |
1023 |
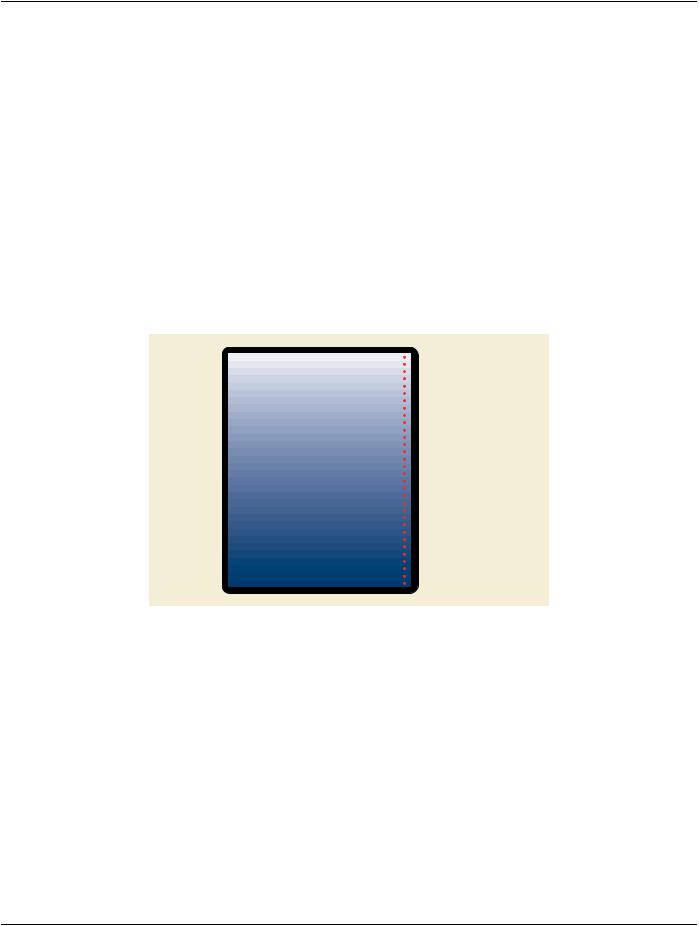
D.1.4 Measures of Conformance
The FIT and the LUM metrics proposed in Annex C are applied to determine the macroscopic and microscopic approximation of the L J,mto the L I,STD. Figure D.1-3 shows the perceptually linearized Display Function superimposed on the Grayscale Standard Display Function and Figure D.1-4 summarizes the results of the two metrics. A good global fit was achieved as demonstrated by the nearly horizontal-line fit as best fit obtained with the FIT metric. The RMSE is acceptable. All 255 P-Value intervals lead to JNDs on the transformed Display Function for the Standard Target.
- Standard -
Page 54 |
DICOM PS3.14 2020a - Grayscale Standard Display Function |
100 |
|
|
|
|
10 |
|
|
|
|
LUMINANCE |
|
|
|
|
[CD/M2] |
|
|
|
|
1 |
|
Measured Data |
|
|
|
Interpolated Data |
|
|
|
|
|
|
|
|
|
|
Transformed Display Function |
|
|
|
|
Standard Display Function |
|
|
0.1 |
64 |
128 |
192 |
256 |
0 |
||||
DIGITAL DRIVING LEVEL
Figure D.1-3. Measured and interpolated Characteristic Curve, Grayscale Standard Display Function and transformed Display Function of an emissive Display System. The transformed Display Function for this Display System matches the Grayscale Standard Display Function and the two curves are superimposed and indistinguishable.
N, JNDs/LUMINANCE INTERVAL
2.5
2
1.5
1
0.5
0
0
|
|
|
|
|
|
|
|
|
|
|
|
|
|
|
|
|
|
|
|
|
|
|
|
|
|
|
|
|
|
|
|
|
|
|
|
|
|
|
|
|
|
|
|
|
|
|
|
|
|
|
|
|
|
|
|
|
|
|
|
|
|
|
|
|
|
|
|
|
|
|
|
|
|
|
|
|
|
|
|
|
|
|
|
|
|
|
|
|
|
|
|
|
|
|
|
|
|
|
|
|
|
|
|
|
|
|
|
|
|
|
|
|
|
|
|
|
|
|
|
|
|
|
|
|
|
|
|
|
|
|
|
|
|
|
|
|
|
|
|
|
|
|
|
|
|
|
|
|
|
|
|
|
|
|
|
|
|
|
|
|
|
|
|
|
|
|
|
|
|
|
|
|
|
|
|
|
|
|
|
|
|
|
|
|
|
|
|
|
|
|
|
|
|
|
|
|
|
|
|
|
|
|
|
|
|
|
|
|
|
|
|
|
|
|
|
|
|
|
|
|
|
|
|
|
|
|
|
|
|
|
|
|
|
|
|
|
|
|
|
|
|
|
|
|
|
|
|
|
|
|
|
|
|
|
|
|
|
|
|
|
|
|
|
|
|
|
|
|
|
|
|
|
|
|
|
|
|
|
|
|
|
|
|
|
|
|
|
|
|
|
|
|
|
|
|
|
|
|
|
|
|
|
|
|
|
|
|
|
|
|
|
|
|
|
|
|
|
|
|
|
|
|
|
|
|
|
|
|
|
|
|
|
|
|
|
|
|
|
|
|
|
|
|
|
|
|
|
|
|
|
|
|
|
|
|
|
|
|
|
|
|
|
|
|
|
|
|
|
|
|
|
|
|
|
|
|
|
|
|
|
|
|
|
|
|
|
|
|
|
|
|
|
|
|
|
|
|
|
|
|
|
|
|
|
|
|
|
|
|
|
|
|
|
|
|
|
|
|
|
|
|
|
|
|
|
|
|
|
|
|
|
|
|
|
|
|
|
|
|
|
|
|
|
|
|
|
|
|
|
|
|
|
|
|
|
|
|
|
|
|
|
|
|
|
|
|
|
|
|
|
|
|
|
|
|
|
|
|
|
|
|
|
|
MEAN |
= |
1.654953 |
|
|
|
|
|
|
|
|
|
|
|
|
|
|
|
|
|
|||||||||||||
|
|
|
|
|
|
|
|
|
|
|
|
|
|
STD DEV |
= |
0.202049 |
|
|
|
|
|
|
|
|
|
|
|
|
|
|
|
|
|
|||||||||||||
|
|
|
|
|
|
|
|
|
|
|
|
|
|
LINEAR FIT: |
|
|
|
|
|
|
|
|
|
|
|
|
|
|
|
|
|
|
|
|
|
|
|
|
||||||||
|
|
|
|
|
|
|
|
|
|
|
|
|
|
N = 1.45E-4 * I + 1.6003 |
|
|
|
|
|
|
|
|
|
|
|
|
|
|
|
|
|
|||||||||||||||
|
|
|
|
|
|
|
|
|
|
|
|
|
|
|
|
|
|
|
|
|
|
|
|
|
|
|
|
|
|
|
|
|
|
|
|
|
|
|
|
|
|
|
|
|
|
|
|
|
|
|
|
|
|
|
|
|
|
|
|
|
|
|
|
|
|
|
|
|
|
|
|
|
|
|
|
|
|
|
|
|
|
|
|
|
|
|
|
|
|
|
|
|
|
|
|
|
|
|
|
64 |
|
|
|
|
|
|
|
|
|
128 |
|
|
192 |
256 |
||||||||||||||||||||||||||
|
|
|
|
|
|
|
|
|
|
|
|
|
|
|
I, INDEX OF LUMINANCE INTERVAL |
|
|
|
|
|
|
|||||||||||||||||||||||||
Figure D.1-4. LUM and FIT measures of conformance for a the transformed Display Function of an emissive Display System
- Standard -
DICOM PS3.14 2020a - Grayscale Standard Display Function |
Page 55 |
D.2 Transparent Hardcopy Devices
D.2.1 Measuring the System Characteristic Curve
A transparent hardcopy device is exemplified by a laser printer (including processor) that prints (exposes and processes) one or more images on a sheet of transparent film (typically a 14" x 17" film). This film is eventually placed over a high Luminance light-box in a darkened room for viewing.
The Characteristic Curve for such a transparent hardcopy device is obtained by printing a test image consisting of a pattern of n bars, each bar having a specific numeric value (DDL). The optical density of each printed bar is then measured, using a transmission densitometer, for each of the printed bars.
Toaccuratelydefineaprinter'sCharacteristicCurve,itisdesirablethatnbeaslargeaspossible(tocaptureasmanypointsaspossible on the Characteristic Curve). However, the limitations on absolute quantitative repeatability imposed by the printer, processor, or mediatechnologiesmaydictatethatamuchsmallervalueofnbeused(topreventaconformancemetricthatissensitivetodifferences from becoming unstable and meaningless, as the density differences between adjacent bars become "in the noise" as the number of bars becomes large).
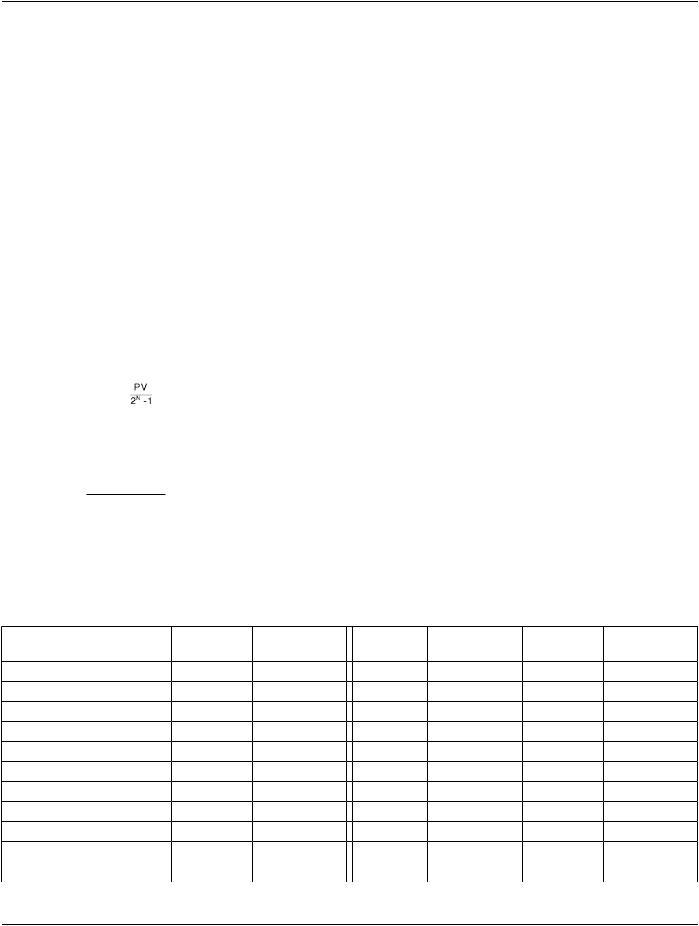
One example of a test image is a pattern of 32 approximately equal-height bars, spanning the usable printable region of the film, having 32 approximately equi-spaced DDLs as follows:
|
|
|
|
Density Step 0 |
|
|
|
|
|
Density Step 1 |
|
|
|
|
|
Density Step 2 |
|
|
|
|
|
Density Step 3 |
|
|
|
|
|
Density Step 4 |
|
|
|
|
|
Density Step 5 |
|
|
|
|
|
Density Step 6 |
|
|
|
|
|
Density Step 7 |
|
|
|
|
|
Density Step 8 |
|
|
|
|
|
Density Step 9 |
|
|
|
|
|
|
|
|
|
|
|
Density Step 10 |
|
|
|
|
|
Density Step 11 |
|
|
|
|
|
Density Step 12 |
|
|
|
|
|
|
|
|
|
|
|
Density Step 13 |
|
|
|
|
|
Density Step 14 |
|
|
|
|
|
Density Step 15 |
|
|
|
|
|
Density Step 16 |
|
|
|
|
|
Density Step 17 |
|
|
|
|
|
Density Step 18 |
|
|
|
|
|
Density Step 19 |
|
|
|
|
|
|
|
|
|
|
|
Density Step 20 |
|
|
|
|
|
Density Step 21 |
|
|
|
|
|
Density Step 22 |
|
|
|
|
|
|
|
|
|
|
|
Density Step 23 |
|
|
|
|
|
Density Step 24 |
|
|
|
|
|
Density Step 25 |
|
|
|
|
|
Density Step 26 |
|
|
|
|
|
Density Step 27 |
|
|
|
|
|
Density Step 28 |
|
|
|
|
|
Density Step 29 |
|
|
|
|
|
|
|
|
|
|
|
Density Step 30 |
|
|
|
|
|
Density Step 31 |
|
Figure D.2-1. Layout of a Test Pattern for Transparent Hardcopy Media |
|
||||
To define a test pattern with n DDLs for a printer with an N-bit input, the DDL of step # i can be set to |
|
||||
DDLi = (2N-1)i/(n-1) |
(D.2-1) |
||||
rounded to the nearest integer. |
|
||||
The tabulated values of DDLi and the corresponding measured optical densities ODi constitute a Characteristic Curve of the printer.
D.2.2 Application of the Grayscale Standard Display Function
The films that are produced by transparent hardcopy printers are often brought to a variety of locations, where they may be viewed on different light-boxes and under a variety of viewing conditions. Accordingly, the approach of PS3.14 is to define, for hardcopy transparent printers, what densities (rather than Luminances) should be produced, and to provide here a method of applying the Grayscale Standard Display Function to the transparent hardcopy case, based on parameters that are typical of the expected range of light-box Luminances and other viewing parameters.
The specific parameters that are used in the following example are as follows:
- Standard -
Page 56 |
DICOM PS3.14 2020a - Grayscale Standard Display Function |
L0 (Luminance of light-box with no film present): 2000 cd/m2
La (ambient room light reflected by film): 10 cd/m2
Dmin (minimum optical density obtainable on film): 0.20
Dmax (maximum optical density desirable on film): 3.00.
The process of constructing a table of desired OD values from the Grayscale Standard Display Function begins with defining the Lu- minance Range and the corresponding range of the Just-Noticeable Difference Index, j. The minimum and maximum Luminance values are given respectively by
Lmin= La + L010-Dmax = 12.0 cd/m2 |
(D.2-2) |
Lmax= La + L010-Dmin = 1271.9 cd/m2 |
(D.2-3) |
Next, calculate the corresponding Just-Noticeable Difference Index values, jmin and jmax. For the current example, we obtain |
|
jmin = 233.32 |
(D.2-4) |
jmax = 848.75 |
(D.2-5) |
This gives us the range of j-values that the printer should cover. The printer should map its minimum input (P-Value = 0) to jmin and the corresponding Lmin. It should map its maximum input (P-Value = 2N-1 where N is the number of input bits) to jmax and the corres- ponding Lmax. At any intermediate input it should map its input proportionately:
(D.2-6)
j(PV) = jmin + (jmax-jmin)
and target values for the Luminance given by the Standard's formula: L(j(P-Value)). This "targeting" consists of producing an optical density OD for this P-Value that will give the desired Luminance L(j(P-Value)) under the conditions of L0 and La previously defined. The required density can thus be calculated as follows:
OD(PV)=-log10 |
(L( j(PV)) − La) |
(D.2-7) |
L0 |
D.2.3 Implementation of the Grayscale Standard Display Function
Carrying this example into the even more specific case of a printer with an 8-bit input leads to the following table, which defines the OD's to be generated for each of the 256 possible P-Values.
Table D.2-1. Optical Densities for Each P-Value for an 8-Bit Printer
P-Value |
Optical Density |
P-Value |
Optical Density |
P-Value |
Optical Density |
P-Value |
Optical Density |
|
(OD) |
|
(OD) |
|
(OD) |
|
(OD) |
0 |
3.000 |
1 |
2.936 |
2 |
2.880 |
3 |
2.828 |
4 |
2.782 |
5 |
2.739 |
6 |
2.700 |
7 |
2.662 |
8 |
2.628 |
9 |
2.595 |
10 |
2.564 |
11 |
2.534 |
12 |
2.506 |
13 |
2.479 |
14 |
2.454 |
15 |
2.429 |
16 |
2.405 |
17 |
2.382 |
18 |
2.360 |
19 |
2.338 |
20 |
2.317 |
21 |
2.297 |
22 |
2.277 |
23 |
2.258 |
24 |
2.239 |
25 |
2.221 |
26 |
2.203 |
27 |
2.185 |
28 |
2.168 |
29 |
2.152 |
30 |
2.135 |
31 |
2.119 |
32 |
2.103 |
33 |
2.088 |
34 |
2.073 |
35 |
2.058 |
36 |
2.043 |
37 |
2.028 |
38 |
2.014 |
39 |
2.000 |
40 |
1.986 |
41 |
1.973 |
42 |
1.959 |
43 |
1.946 |
- Standard -

|
|
DICOM PS3.14 2020a - Grayscale Standard Display Function |
|
Page 57 |
|||
P-Value |
Optical Density |
P-Value |
Optical Density |
P-Value |
Optical Density |
P-Value |
Optical Density |
|
(OD) |
|
(OD) |
|
(OD) |
|
(OD) |
44 |
1.933 |
45 |
1.920 |
46 |
1.907 |
47 |
1.894 |
48 |
1.882 |
49 |
1.870 |
50 |
1.857 |
51 |
1.845 |
52 |
1.833 |
53 |
1.821 |
54 |
1.810 |
55 |
1.798 |
56 |
1.787 |
57 |
1.775 |
58 |
1.764 |
59 |
1.753 |
60 |
1.742 |
61 |
1.731 |
62 |
1.720 |
63 |
1.709 |
64 |
1.698 |
65 |
1.688 |
66 |
1.677 |
67 |
1.667 |
68 |
1.656 |
69 |
1.646 |
70 |
1.636 |
71 |
1.626 |
72 |
1.616 |
73 |
1.605 |
74 |
1.595 |
75 |
1.586 |
76 |
1.576 |
77 |
1.566 |
78 |
1.556 |
79 |
1.547 |
80 |
1.537 |
81 |
1.527 |
82 |
1.518 |
83 |
1.508 |
84 |
1.499 |
85 |
1.490 |
86 |
1.480 |
87 |
1.471 |
88 |
1.462 |
89 |
1.453 |
90 |
1.444 |
91 |
1.434 |
92 |
1.425 |
93 |
1.416 |
94 |
1.407 |
95 |
1.398 |
96 |
1.390 |
97 |
1.381 |
98 |
1.372 |
99 |
1.363 |
100 |
1.354 |
101 |
1.346 |
102 |
1.337 |
103 |
1.328 |
104 |
1.320 |
105 |
1.311 |
106 |
1.303 |
107 |
1.294 |
108 |
1.286 |
109 |
1.277 |
110 |
1.269 |
111 |
1.260 |
112 |
1.252 |
113 |
1.244 |
114 |
1.235 |
115 |
1.227 |
116 |
1.219 |
117 |
1.211 |
118 |
1.202 |
119 |
1.194 |
120 |
1.186 |
121 |
1.178 |
122 |
1.170 |
123 |
1.162 |
124 |
1.154 |
125 |
1.146 |
126 |
1.138 |
127 |
1.130 |
128 |
1.122 |
129 |
1.114 |
130 |
1.106 |
131 |
1.098 |
132 |
1.090 |
133 |
1.082 |
134 |
1.074 |
135 |
1.066 |
136 |
1.058 |
137 |
1.051 |
138 |
1.043 |
139 |
1.035 |
140 |
1.027 |
141 |
1.020 |
142 |
1.012 |
143 |
1.004 |
144 |
0.996 |
145 |
0.989 |
146 |
0.981 |
147 |
0.973 |
148 |
0.966 |
149 |
0.958 |
150 |
0.951 |
151 |
0.943 |
152 |
0.935 |
153 |
0.928 |
154 |
0.920 |
155 |
0.913 |
156 |
0.905 |
157 |
0.898 |
158 |
0.890 |
159 |
0.883 |
160 |
0.875 |
161 |
0.868 |
162 |
0.860 |
163 |
0.853 |
164 |
0.845 |
165 |
0.838 |
166 |
0.831 |
167 |
0.823 |
168 |
0.816 |
169 |
0.808 |
170 |
0.801 |
171 |
0.794 |
172 |
0.786 |
173 |
0.779 |
174 |
0.772 |
175 |
0.764 |
176 |
0.757 |
177 |
0.750 |
178 |
0.742 |
179 |
0.735 |
180 |
0.728 |
181 |
0.721 |
182 |
0.713 |
183 |
0.706 |
184 |
0.699 |
185 |
0.692 |
186 |
0.684 |
187 |
0.677 |
188 |
0.670 |
189 |
0.663 |
190 |
0.656 |
191 |
0.648 |
192 |
0.641 |
193 |
0.634 |
194 |
0.627 |
195 |
0.620 |
196 |
0.613 |
197 |
0.606 |
198 |
0.598 |
199 |
0.591 |
200 |
0.584 |
201 |
0.577 |
202 |
0.570 |
203 |
0.563 |
204 |
0.556 |
205 |
0.549 |
206 |
0.542 |
207 |
0.534 |
- Standard -
Page 58 |
|
DICOM PS3.14 2020a - Grayscale Standard Display Function |
|
|
|||
P-Value |
Optical Density |
P-Value |
Optical Density |
P-Value |
Optical Density |
P-Value |
Optical Density |
|
(OD) |
|
(OD) |
|
(OD) |
|
(OD) |
208 |
0.527 |
209 |
0.520 |
210 |
0.513 |
211 |
0.506 |
212 |
0.499 |
213 |
0.492 |
214 |
0.485 |
215 |
0.478 |
216 |
0.471 |
217 |
0.464 |
218 |
0.457 |
219 |
0.450 |
220 |
0.443 |
221 |
0.436 |
222 |
0.429 |
223 |
0.422 |
224 |
0.415 |
225 |
0.408 |
226 |
0.401 |
227 |
0.394 |
228 |
0.387 |
229 |
0.380 |
230 |
0.373 |
231 |
0.366 |
232 |
0.359 |
233 |
0.352 |
234 |
0.345 |
235 |
0.338 |
236 |
0.331 |
237 |
0.324 |
238 |
0.317 |
239 |
0.311 |
240 |
0.304 |
241 |
0.297 |
242 |
0.290 |
243 |
0.283 |
244 |
0.276 |
245 |
0.269 |
246 |
0.262 |
247 |
0.255 |
248 |
0.248 |
249 |
0.241 |
250 |
0.234 |
251 |
0.228 |
252 |
0.221 |
253 |
0.214 |
254 |
0.207 |
255 |
0.200 |
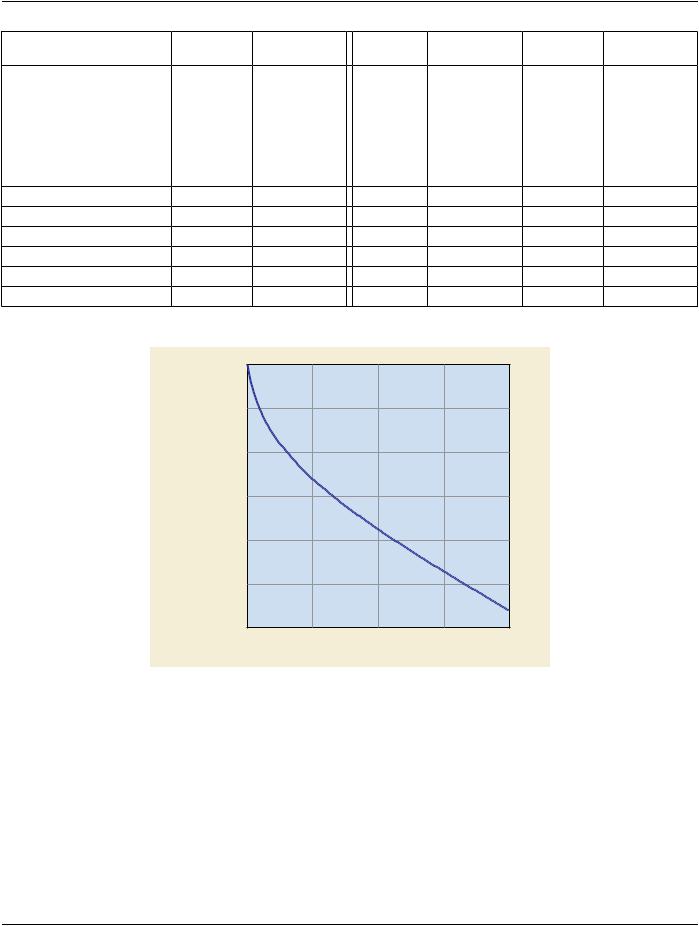
Plotting these values gives the curve of Figure D.2-3.
|
3.0 |
|
|
|
|
|
2.5 |
|
|
|
|
|
2.0 |
|
|
|
|
OPTICAL |
1.5 |
|
|
|
|
DENSITY |
|
|
|
|
|
|
1.0 |
|
|
|
|
|
0.5 |
|
|
|
|
|
0.0 |
64 |
128 |
192 |
256 |
|
0 |
||||
|
|
|
P-VALUE |
|
|
Figure D.2-3. Plot of OD vs P-Value for an 8-Bit Printer
D.2.4 Measures of Conformance
As an example, a bar pattern with 32 optical densities was printed on transmissive media (film). Beforehand, the printer had been set
up to print over a density range from 0.2 (Dmin) to 3.0 (Dmax) and had been pre-configured by the manufacturer to use the Grayscale Standard Display Function, converted by the manufacturer into the table of target density values vs. P-Values described earlier.
The test pattern that was used for this was an 8-bit image consisting essentially of 32 horizontal bars. The 32 P-Values used for the bars were as follows: 0, 8, 16, 25, 33, 41, 49, 58, 66, 74, 82, 90,99, 107, 115, 123, 132, 140, 148, 156, 165, 173, 181, 189, 197, 206, 214,222, 230, 239, 247, 255.
For a given film, the 32 bars' optical densities were measured (near the middle of the film), converted to Luminances (using the standardparametersoflight-boxLuminanceandreflectedambientlightdescribedearlier),andconvertedtoJust-NoticeableDifference
- Standard -

DICOM PS3.14 2020a - Grayscale Standard Display Function |
Page 59 |
Indicesbymathematicallycomputingj(L)fromL(j),whereL(j)istheGrayscaleStandardDisplayFunctionofLuminanceLasafunction of the Just-Noticeable Difference Index j. For each of the 31 intervals between consecutive measured values, a calculated value of "JNDs per increment in P-Values" was obtained by dividing the difference in Just-Noticeable Difference Index by the difference in P- Values for that interval. (In these calculations, density, L, and j are all floating-point variables. No rounding to integer values is done, so no truncation error is introduced.)
In this example, the film's data could be reasonably well fit by a horizontal straight line. That is, the calculated "JNDs per increment in P-Values was essentially constant at 2.4. A mathematical fit yielded a slight non-zero slope (specifically, dropping from 2.5 to 2.3 as the P-Value went from 0 to 255), but the 0.2 total difference was considerably smaller than the noise that was present in the 31 individualvaluesof"JNDsperincrementinP-Value"soisofdoubtfulsignificance.(The"noise"referredtohereconsistsoftherandom, non-repeatable variations that are seen if a new set of measured data (e.g., from a second print of the same test pattern) is compared with a previous set of measurements.)
No visual tests were done to see if a slope that small could be detected by a human observer in side-by-side film comparisons.
Incidentally,ifoneconsidersjustthe32originalabsolutemeasureddensities(ratherthandifferentialvaluesbasedonsmalldifferences), one finds, in this case, quite reasonable agreement between the target and measured optical densities (within the manufacturer's norms for density accuracy, at a given density). But if one uses any metric that is based on differential information over small intervals, theresultsmustbeconsideredmorecautiously,sincetheycanbestronglyaffectedby(andmaybedominatedby)variousimperfections that are independent of a device's "true" (or averaged over many cases) characteristic behavior.
D.3 Reflective Display Systems
This last example illustrates how conformance with the Grayscale Standard Display Function may be achieved for a thermal-dye- transferpaperprinter/office-lightsystem.Thethermal-dye-transferprinterproducesblack-and-whitegrayscaleprintsonasemi-glossy 8-inch x 10-inch heavy-gauge paper. The print is illuminated uniformly by fluorescent lamps so that the minimum reflective density produces a Luminance of 150 cd/m2. The hypothetical transformation operator is assumed to have equal input and output digitization resolution of 8 bits.
D.3.1 Measuring the System Characteristic Curve
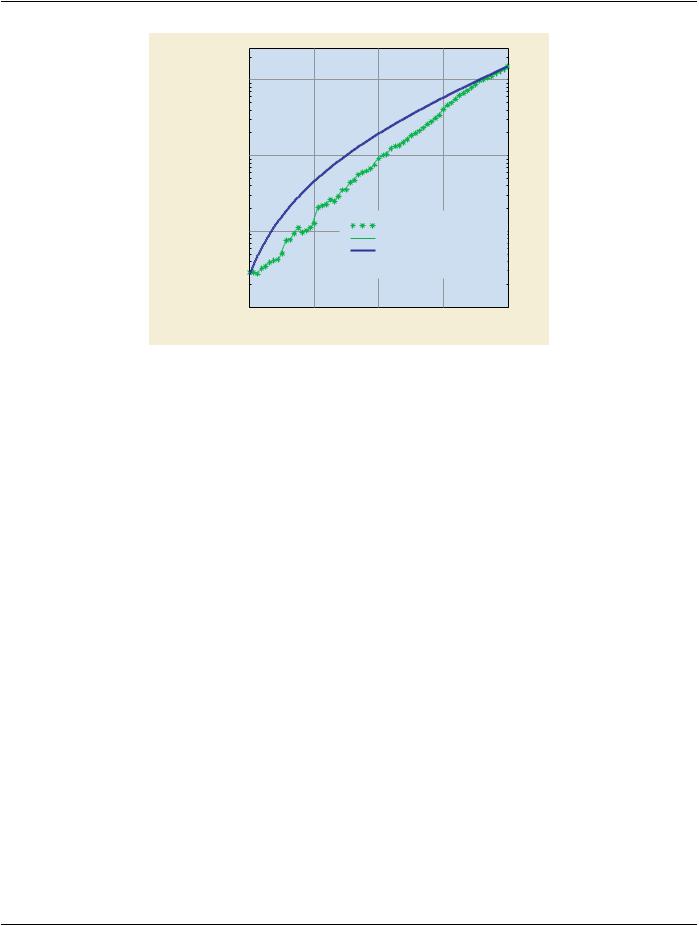
A print with a 64-step grayscale tablet was printed for DDLs 4, 8, 12, ...,248, 252, 255. The reflection optical densities (from 0.08 to 2.80) were measured with a densitometer. The Luminance levels corresponding to the measured optical densities and illumination conditions are plotted in Figure D.3-1.
- Standard -
Page 60 |
DICOM PS3.14 2020a - Grayscale Standard Display Function |
100 |
|
|
|
|
10 |
|
|
|
|
LUMINANCE |
|
|
|
|
[CD/M2] |
|
|
|
|
1 |
|
Measured Data |
|
|
|
Interpolated Measured Data |
|
||
|
|
|
||
|
|
Standard Display Function |
|
|
0.1 |
64 |
128 |
192 |
256 |
0 |
||||
DIGITAL DRIVING LEVEL
FigureD.3-1.MeasuredandinterpolatedCharacteristicCurveandGrayscaleStandardDisplayFunction
for a printer producing reflective hard-copies
D.3.2 Application of the Grayscale Standard Display Function
This last example illustrates how conformance with the Grayscale Standard Display Function may be achieved for a thermal-dye- transferpaperprinter/office-lightsystem.Thethermal-dye-transferprinterproducesblack-and-whitegrayscaleprintsonasemi-glossy 8-inch x 10-inch heavy-gauge paper. The print is illuminated uniformly by fluorescent lamps so that the minimum reflective density produces a Luminance of 150 cd/m2. The hypothetical transformation operator is assumed to have equal input and output digitization resolution of 8 bits.
D.3.3 Implementation of the Grayscale Standard Display Function
ThemeasuredCharacteristicCurveisinterpolatedfortheavailableDDLsyielding256LuminancelevelsLI,m.TheGrayscaleStandard Display Function is also interpolated between JNDmin and JNDmax (DJND = [JNDmax - JNDmin]/255) yielding 256 Standard Luminance levels LI,STD.
For every LI,STD, the closest LJ,m is determined. The data pair I,J defines the transformation between Dinput and Doutput (Table D.3-1 and Figure D.3-2) by which the Luminance response of the Display System is made to approximates the Grayscale Standard Display
Function.
- Standard -