

PS-2020a / part14
.pdfDICOM PS3.14 2020a - Grayscale Standard Display Function |
Page 21 |
5 Conventions
The following conventions are used in PS3.14:
The terminology defined in Section 3 above is capitalized throughout PS3.14.
- Standard -

Page 22 |
DICOM PS3.14 2020a - Grayscale Standard Display Function |
- Standard -
DICOM PS3.14 2020a - Grayscale Standard Display Function |
Page 23 |
6 Overview
PS3.14 defines, mathematically, the Grayscale Standard Display Function of Standardized Display Systems. These systems may be printers producing hard-copies viewed on light-boxes or electronic Display Systems for soft-copies.
Hard-copies may consist of transmissive films as well as reflective prints. The image in these prints is represented by optical density variationsintransmissionordiffusereflection.Toanobserver,everyelementoftheimageappearswithacertainLuminancedepending on the Illuminance and the optical density of the image element.
Soft-copies may be produced by emissive Display Systems (such as CRT monitors) or electronic light valves (such as light sources and liquid crystal displays).
For the purpose of PS3.14, Display Systems take a Digital Driving Level and produce Luminance or optical density variations that represent the image. Predictable application of image transformations, such as the modality, value-of-interest, and presentation look- up tables specified in the DICOM Standard, requires knowledge of the Characteristic Curve of the Display System. Standardizing the response function expected of the Display System simplifies the application of such image transformations across several different Display Systems such as encountered in a network environment.
PS3.14 does not define when conformance with the Grayscale Standard Display Function is achieved or how to characterize the degree of conformance reached.
Note
A definition of conformance would require thorough evaluations of human visual system sensitivity to deviations of Display Functions from the Grayscale Standard Display Function for medical images.
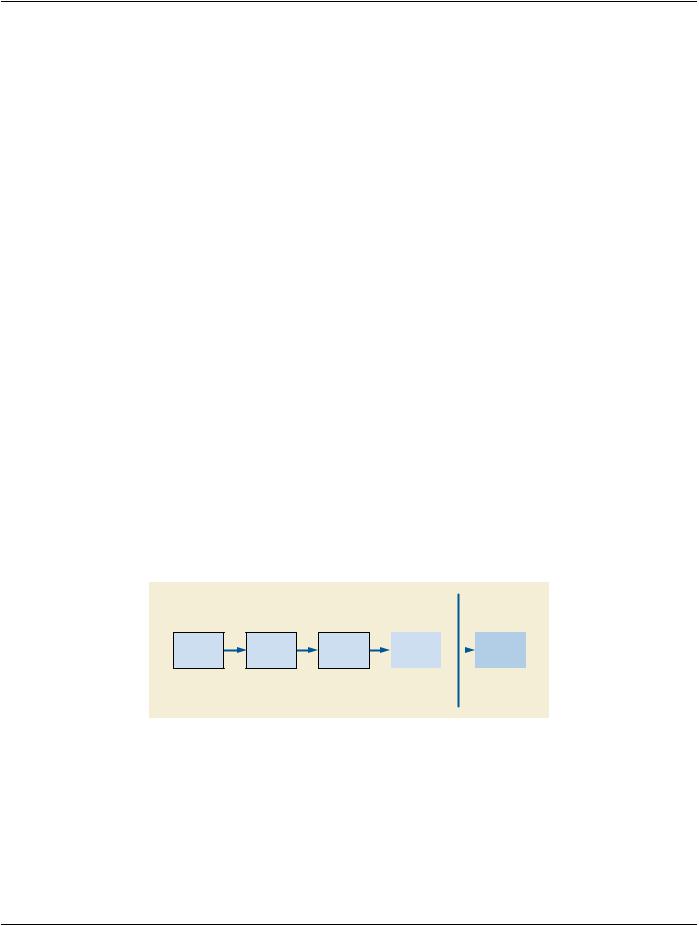
Figure 6-1 and Figure 6-2 show the context for the Grayscale Standard Display Function. The Grayscale Standard Display Function is part of the image presentation. There will be a number of other modifications to the image before the Grayscale Standard Display Function is applied. The image acquisition device will adjust the image as it is formed. Other elements may perform a "window and level" to select a part of the dynamic range of the image to be presented. Yet other elements can adjust the selected dynamic range in preparation for display. The Presentation LUT outputs P-Values (presentation values). These P-Values become the Digital Driving Levels for Standardized Display Systems. The Grayscale Standard Display Function maps P-Values to the log-luminance output of the Standardized Display System. How a Standardized Display System performs this mapping is implementation dependent.
The boundary between the DICOM model of the image acquisition and presentation chain, and the Standardized Display System, expressedinP-Values,isintendedtobebothdeviceindependentandconceptually(ifnotactually)perceptuallylinear.Inotherwords, regardless of the capabilities of the Standardized Display System, the same range of P-Values will be presented ìsimilarlyî.
DICOM
Values
Modality of Polarity
Interest
Note: The Presentation LUT may be an identity function if, for example, the Polarity is unchanged and the Values of Interest transformation outputs P-Values.
|
|
|
Image |
|
|
|
Presentation |
|
|
|
|
|
|
|
Standardized |
Presentation |
|
|
Display |
LUT |
|
|
System |
|
|
|
|
Figure 6-1. The Grayscale Standard Display Function is an element of the image presentation after several modifications to the image have been completed by other elements of the image acquisition and presentation chain.
- Standard -

Page 24 |
DICOM PS3.14 2020a - Grayscale Standard Display Function |
Standardized Display System
P-Values |
P-Values |
DDLs |
Display |
Luminance |
to DDLs |
|
System |
||
|
|
|
P-Values |
|
|
|
|
DDLs |
|
|
Luminance |
||
|
|
|
|
|
|
|
|
|
|
|
|
|
|
|
|
|
|
|
|
|
|
|
|
|
|
|
|
|
|
|
|
|
Figure 6-2. The conceptual model of a Standardized Display System maps P-Values to Luminance via an intermediate transformation to Digital Driving Levels of an unstandardized Display System.
The main objective of PS3.14 is to define mathematically an appropriate Grayscale Standard Display Function for all image present- ationsystems.ThepurposeofdefiningthisGrayscaleStandardDisplayFunctionistoallowapplicationstoknowa priorihowP-Values aretransformedtoviewedLuminancevaluesbyaStandardizedDisplaySystem.Inessence,definingtheGrayscaleStandardDisplay Functionfixesthe"units"fortheP-ValuesoutputfromthePresentationLUTandusedasDigitalDrivingLevelstoStandardizedDisplay Systems.
A second objective of PS3.14 is to select a Display Function that provides some level of similarity in grayscale perception or basic appearance for a given image between Display Systems of different Luminance and that facilitates good use of the available Digital Driving Levels of a Display System. While many different functions could serve the primary objective, this Grayscale Standard Display Function was chosen to meet the second objective. With such a function, P-Values are approximately linearly related to human per- ceptual response. Similarity does not guarantee equal information content. Display Systems with a wider Luminance Range and/or higher Luminance will be capable of presenting more just-noticeable Luminance differences to an observer. Similarity also does not imply strict perceptual linearity, since perception is dependent on image content and on the viewer. In order to achieve strict percep- tual linearity, applications would need to adjust the presentation of images to match user expectations through the other constructs defined in the DICOM Standard (e.g., VOI and Presentation LUT). Without a defined Display Function, such adjustments on the wide variety of Display Systems encountered on a network would be difficult.
The choice of the function is based on several ideas that are discussed further in Annex A.
Annex B contains the Grayscale Standard Display Function in tabular form.
Informative Annex C provides an example procedure for comparing mathematically the shape of the actual Display Function with the GrayscaleStandardDisplayFunctionandforquantifyinghowwelltheactualdiscreteLuminanceintervalsmatchthoseoftheGrayscale Standard Display Function.
Display Systems often will have Characteristic Curves different from the Grayscale Standard Display Function. These devices may containmeansforincorporatingexternallydefinedtransformationsthatmakethedevicesconformwiththeGrayscaleStandardDisplay Function. PS3.14 provides examples of test patterns for Display Systems with which their behavior can be measured and the approx- imation to the Grayscale Standard Display Function evaluated (see Informative Section D.1, Section D.2 and Section D.3).
- Standard -

DICOM PS3.14 2020a - Grayscale Standard Display Function |
Page 25 |
7 The Grayscale Standard Display Function
As explained in greater detail in Annex A, the Grayscale Standard Display Function is based on human Contrast Sensitivity. Human Contrast Sensitivity is distinctly non-linear within the Luminance Range of the Grayscale Standard Display Function . The human eye is relatively less sensitive in the dark areas of an image than it is in the bright areas of an image. This variation in sensitivity makes it much easier to see small relative changes in Luminance in the bright areas of the image than in the dark areas of the image. A Display Function that adjusts the brightness such that equal changes in P-Values will result in the same level of perceptibility at all drivinglevelsis"perceptuallylinearized".TheGrayscaleStandardDisplayFunctionincorporatesthenotionofperceptuallinearization without making it an explicit objective of PS3.14.
The employed data for Contrast Sensitivity are derived from Barten's model of the human visual system (Ref. 1, 2 and Annex B). Specifically, the Grayscale Standard Display Function refers to Contrast Sensitivity for the Standard Target consisting of a 2-deg x 2-deg square filled with a horizontal or vertical grating with sinusoidal modulation of 4 cycles per degree. The square is placed in a uniform background of Luminance equal to the mean Luminance L of the Target. The Contrast Sensitivity is defined by the Threshold Modulation at which the grating becomes just visible to the average human observer. The Luminance modulation represents the Just- Noticeable Difference (JND) for the Target at the Luminance L.
Note
The academic nature of the Standard Target is recognized. With the simple target, the essential objectives of PS3.14 appear to be realizable. Only spurious results with more realistic targets in complex surroundings were known at the time of writing PS3.14 and these were not assessed.
The Grayscale Standard Display Function is defined for the Luminance Range from 0.05 to 4000 cd/m2. The minimum Luminance corresponds to the lowest practically useful Luminance of cathode-ray-tube (CRT) monitors and the maximum exceeds the unatten- uated Luminance of very bright light-boxes used for interpreting X-Ray mammography. The Grayscale Standard Display Function explicitly includes the effects of the diffused ambient Illuminance.
Within the Luminance Range happen to fall 1023 JNDs (see Annex A).
7.1 General Formulas
The Grayscale Standard Display Function is defined by a mathematical interpolation of the 1023 Luminance levels derived from Barten's model. The Grayscale Standard Display Function allows us to calculate luminance, L, in candelas per square meter, as a function of the Just-Noticeable Difference (JND) Index, j:
log10 L( j) = |
a + c Ln( j) + e (Ln( j))2 |
+ g (Ln( j))3 + m (Ln( j))4 |
|
(7-1) |
|
1 + b Ln( j) + d (Ln( j))2 + f (Ln( j))3 + h (Ln( j))4 + k (Ln( j)) |
5 |
||||
|
|
||||
with:
Ln referring to the natural logarithm
j the index (1 to 1023) of the Luminance levels Lj of the JNDs a = -1.3011877
b = -2.5840191E-2 c = 8.0242636E-2 d = -1.0320229E-1 e = 1.3646699E-1 f = 2.8745620E-2 g = -2.5468404E-2 h = -3.1978977E-3
- Standard -

Page 26 |
DICOM PS3.14 2020a - Grayscale Standard Display Function |
k = 1.2992634E-4
m = 1.3635334E-3
The logarithms to the base 10 of the Luminance Lj are very well interpolated by this function over the entire Luminance Range. The relative deviation of any log(Luminance) -value from the function is at most 0.3%, and the root-mean-square-error is 0.0003. The continuous representation of the Grayscale Standard Display Function permits a user to compute discrete JNDs for arbitrary start levels and over any desired Luminance Range.
Note
1.To apply Equation 7-1 to a device with a specific range of L values, it is convenient to also have the inverse of this rela- tionship, which is given by:
j(L) = A + B Log10(L) + C (Log10(L))2 + D (Log10(L))3 + E (Log10(L))4 +
(7-2)
F (Log10(L))5 + G (Log10(L))6 + H (Log10(L))7 + I (Log10(L))8
where:
Log10 represents logarithm to the base 10
A = 71.498068
B = 94.593053
C = 41.912053
D = 9.8247004
E = 0.28175407
F = -1.1878455
G = -0.18014349
H = 0.14710899
I = - 0.017046845
2.When incorporating the formulas for L(j) and j(L) into a computer program, the use of double precision is recommended.
3.Alternative methods may be used to calculate the JND Index values. One method is use a numerical algorithm such as the Van Vijngaarden-Dekker-Brent method described in Numerical Recipes in C(Cambridge University press, 1991). ThevaluejmaybecalculatedfromLiterativelygiventheGrayscaleStandardDisplayFunction'sformulaforL(j).Another method would be to use the Grayscale Standard Display Function's tabulated values of j and L to calculate the j corres- ponding to an arbitrary L by linearly interpolating between the two nearest tabulated L,j pairs.
4.No specification is intended as to how these formulas are implemented. These could be implemented dynamically, by executing the equation directly, or through discrete values, such as a LUT, etc.
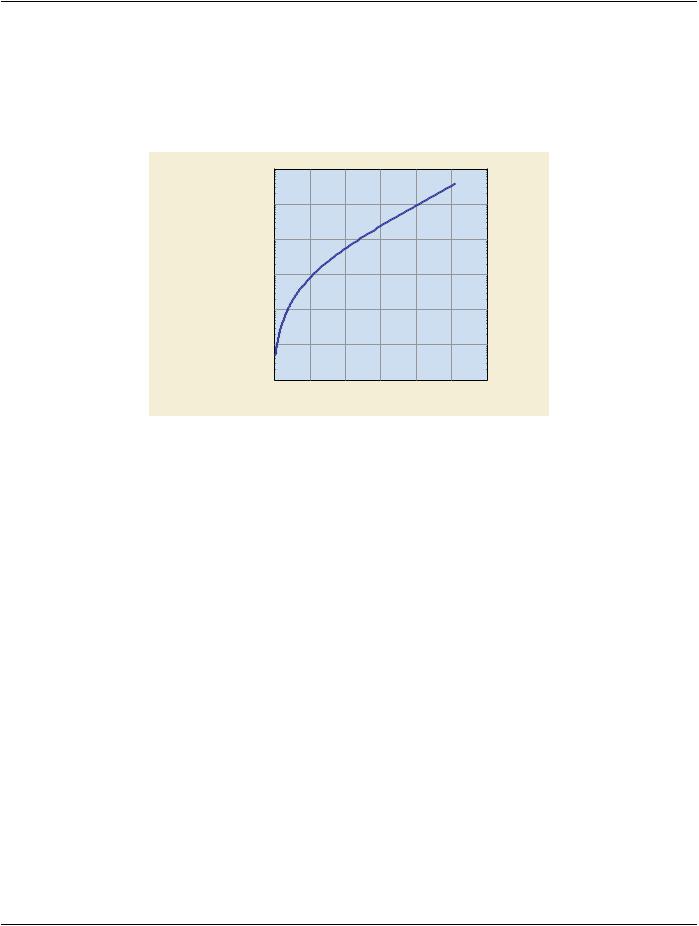
Annex B lists the Luminance levels computed with this equation for the 1023 integer JND Indices and Figure 7-1 shows a plot of the Grayscale Standard Display Function. The exact value of the Luminance levels, of course, depends on the start level of 0.05 cd/m 2.
The Characteristic Curve of a Display System represents the Luminance produced by a Display System as a function of DDL and the effect of ambient Illuminance. The Characteristic Curve is measured with Standard Test Patterns (see Annex D). In general, the Display Function describes, for example,
a.the Luminance (including ambient Illuminance) measured as a function of DDL for emissive displays such as a CRT-monitor/di- gital display controller system,
b.the Luminance (including ambient Illuminance) as a function of DDL measured for a transmissive medium hung in front of a light- box after a printer produced an optical density, depending on DDL, on the medium,
- Standard -

DICOM PS3.14 2020a - Grayscale Standard Display Function |
Page 27 |
c.the Luminance (including ambient light) as a function of DDL measured for a diffusely reflective medium illuminated by a office lights after a printer produced a reflective density, depending on DDL, on the medium.
By internal or external means, the system may have been configured (or calibrated) such that the Characteristic Curve is consistent with the Grayscale Standard Display Function.
Some Display Systems adapt themselves to ambient light conditions. Such a system may conform to the Grayscale Standard Display FunctionforonelevelofambientIlluminanceonly,unlessithadthecapabilityofadjustingitsDisplayFunctionwithoutuser-intervention so that it remains in conformance with the Grayscale Standard Display Function.
7.2 Transmissive Hardcopy Printers
For transmissive hardcopy printing, the relationship between luminance, L, and the printed optical density, D, is:
L = La + L0 10−D |
(7-3) |
where:
L0 is the luminance of the light box with no film present
La is the luminance contribution due to ambient illuminance reflected off the film
If film is to be printed with a density ranging from Dmin to Dmax, the final luminance will range between Lmin = La + L0 10−Dmax and
Lmax = La + L0 10−Dmin and the j values will correspondingly range from jmin = j(Lmin) to jmax = j(Lmax).
If this span of j values is represented by an N-bit P-Value, ranging from 0 for jmin to 2N-1 for jmax, the j values will correspond to P- Values as follows:
j(p) = j |
min |
+ |
p |
|
( jmax − j |
min |
) |
(7-4) |
|
2N − 1 |
|||||||||
|
|
|
|
||||||
and the corresponding L values will be L(j(p)). |
|
||||||||
Finally, converting the L(j(p)) values to densities results in: |
|
||||||||
D(p)=-Log10(L( j(p)) − La) |
|
|
(7-5) |
||||||
|
|
|
L0 |
|
|
|
|
||
Note
Typical values for the parameters used in transmissive hardcopy printing are L0 = 2000 cd/m2, La = 10 cd/m2.
7.3 Reflective Hardcopy Printers
For reflective hardcopy printing, the relationship between luminance, L, and the printed optical density, D, is:
L = L0 10−D |
(7-6) |
where:
L0 is the maximum luminance obtainable from diffuse reflection of the illumination that is present.
If film is to be printed with a density ranging from Dmin to Dmax, the final luminance will range between Lmin = L0 10−Dmax and
Lmax = L0 10−Dmin and the j values will correspondingly range from jmin = j(Lmin) to jmax = j(Lmax).
-Standard -

Page 28 |
DICOM PS3.14 2020a - Grayscale Standard Display Function |
If this span of j values is represented by an N-bit P-Value, ranging from 0 for jmin to 2N-1 for jmax, the j values will correspond to P- Values as follows:
j(p) = j |
min |
+ |
p |
( jmax − j |
min |
) |
(7-7) |
|
2N − 1 |
||||||||
|
|
|
|
|||||
and the corresponding L values will be L(j(p)). |
|
|||||||
Finally, converting the L(j(p)) values to densities results in |
|
|||||||
D(p)=-Log10(L( j(p))) |
|
|
(7-8) |
|||||
|
|
|
L0 |
|
|
|
|
|
Note
Typical values for the parameters used in reflective hardcopy printing are L0 = 150 cd/m2.
- Standard -
DICOM PS3.14 2020a - Grayscale Standard Display Function |
Page 29 |
8 References
1)Barten, P.G.J., Physical model for the Contrast Sensitivity of the human eye. Proc. SPIE 1666, 57-72 (1992)
2)Barten, P.G.J., Spatio-temporal model for the Contrast Sensitivity of the human eye and its temporal aspects. Proc. SPIE 1913-01 (1993)
|
10000 |
|
|
|
|
|
|
|
1000 |
|
|
|
|
|
|
|
100 |
|
|
|
|
|
|
LUMINANCE |
|
|
|
|
|
|
|
[CD/M2] |
10 |
|
|
|
|
|
|
|
|
|
|
|
|
|
|
|
1 |
|
|
|
|
|
|
|
0.1 |
|
|
|
|
|
|
|
0.01 |
200 |
400 |
600 |
800 |
1000 |
1200 |
|
0 |
||||||
JND INDEX
Figure 7-1. The Grayscale Standard Display Function presented as logarithm-of-Luminance versus JND-Index
- Standard -

Page 30 |
DICOM PS3.14 2020a - Grayscale Standard Display Function |
- Standard -