Chapter 13
What are opportunity costs? How do explicit and implicit costs relate to opportunity costs? Explain the role of opportunity costs in differentiating between economic profits and accounting profits.
The opportunity cost of an item refers to all those things that must be forgone to acquire that item.
When Helen pays $1,000 for flour, that $1,000 is an opportunity cost because Helen can no
longer use that $1,000 to buy something else. Similarly, when Helen hires workers to make the
cookies, the wages she pays are part of the firm’s costs. These are explicit costs. By contrast,
some of a firm’s opportunity costs are implicit costs. Imagine that Helen is skilled with
computers and could earn $100 per hour working as a programmer.
Economists are interested in studying how firms make production and pricing decisions. Because these decisions are based on both explicit and implicit costs, economists include both when measuring a firm’s costs. By contrast, accountants have the job of keeping track of the money that flows into and out of firms. As a result, they measure the explicit costs but often ignore the implicit costs. An economist measures a firm’s economic profit as the firm’s total revenue minus all the opportunity costs (explicit and implicit) of producing the goods and services sold. An accountant measures the firm’s accounting profit as the firm’s total revenue minusonly the firm’s explicit costs.
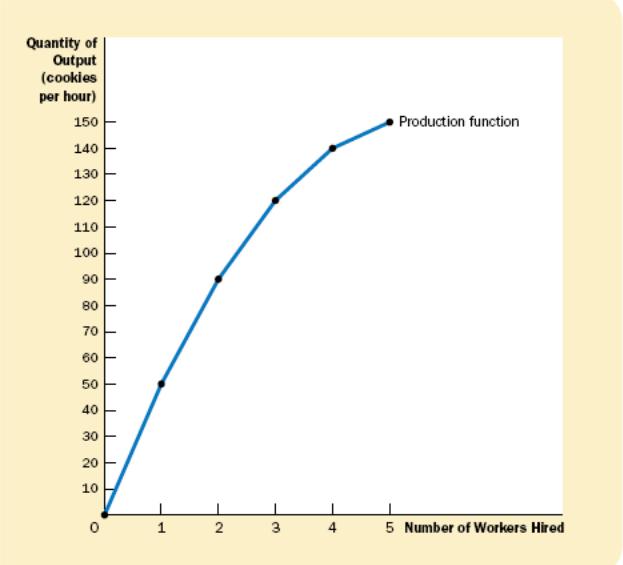
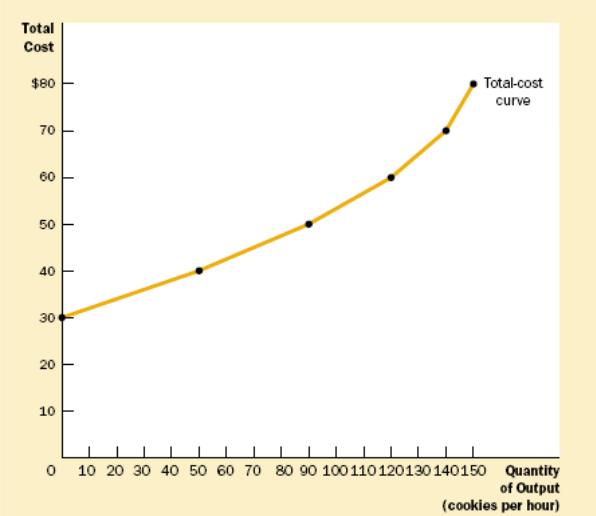
The production function depicts a relationship between which two variables? Also, draw with your own example a production function that exhibits diminishing marginal product which affects the shape of the total cost curve. Explain in detail each and draw two graphs to demonstrate your understanding about those terms made Italic.
The relationship between the quantity of inputs (workers) and quantity of output (cookies) is called the production function. The marginal product of any input in the production process is the increase in the quantity of output obtained from an additional unit of that input. As the number of workers increases, the marginal product declines. The second worker has a marginal product of 40 cookies, the third worker has a marginal product of 30 cookies, and the fourth worker has a marginal product of 20 cookies. This property is called diminishing marginal product. The production function’s slope tells us the change in output of cookies for each additional input of labor. That is, the slope of the production function measures the marginal product of a worker. As the number of workers increases, the marginal product declines, and the production function becomes flatter. The total cost gets steeper as the amount produced rises. As the quantity produced rises, the total-cost curve becomes steeper.
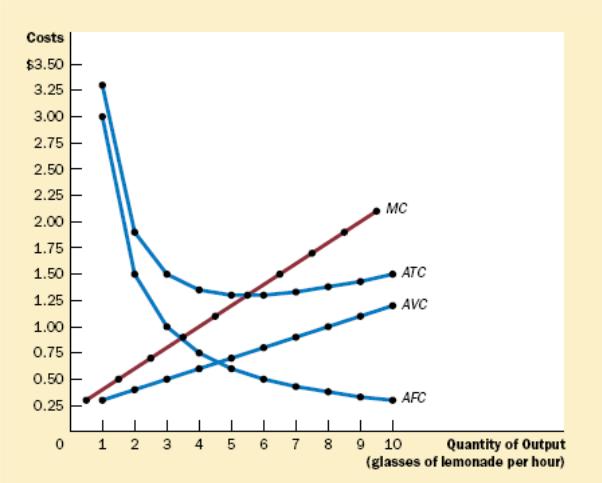
Explain in detail all cost curves (why their shapes so): (atc, avc, afc & mc) and then show all of them on the graph.
Total cost can be divided into two types. Some costs, called fixed costs, do not vary with the quantity of output produced. They are incurred even if the firm produces nothing at all. Some of the firm’s costs, called variable costs, change as the firm alters the quantity of output produced. The more products are made, the more outputs are needed. A firm’s total cost is the sum of fixed and variable costs.
average total cost total cost divided by the quantity of output
average fixed cost fixed costs divided by the quantity of output
average variable cost variable costs divided by the quantity of output
marginal cost the increase in total cost that arises from an extra unit of production. For example, if production increases from 2 to 3, total cost rises from $3.80 to $4.50, so the marginal cost of the third product of is $4.50 minus $3.80, or $0.70. MC = (Change in total cost)/(Change in quantity)