

International Debt statistic 2013
.pdfOverview
International Debt Statistics(IDS) presents data and analysis information on the external debt of developing countries for 2011, based on actual flows and debt related transactions reported to the World Bank Debtor Reporting System (DRS) by 128 developing countries. It replaces Global Development Finance, which has been discontinued, and provides users with comprehensive stock and flow data on the external debt of individual developing countries and for regional and analytical groupings. As a service to users International Debt Statistics also set debt flows within the broader framework of aggregate net capital flows (debt and equity) to developing countries and
includes a summary analysis of trends in 2011. An important new objective of International
Debt Statistics is also to showcase the broader spectrum of debt data collected and compiled by the World Bank. These include the joint World Bank-IMF Quarterly External Debt Statistics (QEDS) and the Public Sector Debt (PSD) database launched in 2010. QEDS provide high frequency, quarterly data through mid-2012 for 111 high income and developing countries, disaggregated by debtor type, maturity and borrowing instrument. The PSD database, to which 65 countries already report, also encompasses both high income and developing countries and provides quarterly information on the total debt (external and domestic) of the general government, disaggregated by creditor type, maturity, currency and borrowing instrument (see annex A for a more detailed description of QEDS and PSD). In common with the DRS, information in the QEDS and PSD databases are fully accessible under the World Bank Open Data Initiative at www.
worldbank.org/qeds and www.worldbank.org/ qpsd, respectively.
The main messages from the 2011 data are:
(a)Net debt inflows to developing countries were $465 billion, 9 percent lower than the comparable figure for 2010. This outcome was much better than many analysts had predicted given the incipient recovery in the global economy in 2011 and the fallout from the Euro-zone crisis. The fall in net debt inflows was due entirely to a drop in inflows from official creditors, $30 billion as compared to $73 billion in 2010. Net inflows from private creditors, at 435 billion were almost identical to those in 2010 but with an important shift in composition: net short-term debt inflows contracted by 27 percent, while medium term financing from commercial banks tripled to $110 billion.
(b)Aggregate net capital flows, debt and equity combined fell to $1,107 billion in 2011, again 9 percent lower than 2010 and below their 2007 pre-crisis peak. Measured in relation to developing country gross national income (GNI), the decline in net capital flows was more striking: from 6.2 percent of GNI in 2010 to 4.9 percent in 2011 and well short of
the 8.5 percent recorded in 2007. The downturn was driven primarily by the collapse of portfolio equity flows, which plummeted to −$2 billion, compared to a net inflow of $120 billion in 2010. In contrast, foreign direct investment continued its upward trajectory, rising by 11 percent in 2011 to a record high of $644 billion.
1

I N T E R N A T I O N A L D E B T S T A T I S T I C S 2 0 1 3
(c)China is by far the largest recipient of net capital flows among developing countries, accounting for 27 percent of net debt and 35 percent of net equity flows in 2011, and dominates the direction of these flows to developing countries. When China is excluded, the decline in net debt and net capital flows to developing countries in 2011 changes from 9 percent to 13 percent (net debt) and 3 percent (net capital flows), respectively.
(d)Countries reporting to the QEDS and PSD databases confirm that external debt and public debt levels are, on average, much lower in developing countries than in high income countries. The ratio of external debt to GNI in developing countries averaged 22 percent in 2011 compared to 124 percent in G7 countries. Similarly, the general government debt of the Euro-zone (17) countries averaged 76 percent of gross domestic product (GDP) in 2011, more than twice the comparable ratio for the largest borrowers among developing countries.
The remainder of the Overview is organized as follows. Section I analyzes the key factors driving the evolution of developing countries’ debt stocks and flows in 2011. Section II describes recent trends in external debt flows to developing countries, including the financing pattern of different categories of creditors and the concentration of flows in specific countries and country groups. Section III examines the remarkable growth of private nonguaranteed debt over the course of the decade and the parallel diversification of borrowing instruments available to developing countries’ private sector borrowers. Section IV assesses the level of developing countries’ external debt, measured in relation to key macroeconomic variables, notably GNI and export earnings. Section V summarizes trends in aggregate net capital flows, debt and equity, to developing countries in 2011. Section VI distills the main messages for 2011 and the first half of 2012 from the information reported to QEDS and PSD databases for developing and high income countries. Annex A provides users with a short overview of the coverage and content of the QEDS and PSD databases and annex B summarizes trends in lending by the World Bank (IBRD and IDA) in 2011.
I. Developing Countries’ Debt Stocks and Flows, 2011
The combined stock of developing countries’ external debt rose from $4.4 trillion in 2010 to $4.9 trillion at the end of 2011, reflecting net
debt inflows of $464 billion, the upward effect of the year on year appreciation, vis-à-vis the U.S. dollar, of foreign currencies in which around one-third of developing countries external debt is denominated, and debt forgiveness amounting to $4 billion. Short-term debt was the fastest growing component, rising by 18 percent in 2011 as compared to a 9 percent increase in the stock of outstanding long term external debt. Most short-term debt was trade related and, measured against developing countries’ imports, decreased slightly, to 17 percent compared to 18 percent in 2010. The stock of long term debt at end 2011 was fairly evenly divided between publicly guaranteed debt, 51 percent, and debt owed to private nonguaranteed borrowers, 49 percent, although the latter rose twice as fast as the former in 2011, 12 percent as compared to 6 percent. This was a complete turnaround from 2010 when long term public and publicly guaranteed debt rose at a rate twice that of private nonguaranteed debt. Developing countries’ debt stock remained moderate, an average of 22 percent of GNI and 69 percent of export earnings and risks associated with the fact that short-term debt constituted 26 percent of debt stock at end 2011 were mitigated by international reserves. The global economic crisis forced some developing countries to draw down international reserves but, in aggregate, developing countries recorded an accumulation of international reserves since the onset of the crisis: equivalent to 121 percent of external debt stock at end 2011 (table I.1).
Net debt flows in 2011 were characterized by a sharp fall in net inflows from official creditors, resilience in those from private creditors, and an improvement in maturity structure, with a marked shift in lending by commercial banks and other financial institutions from short to long term debt. Overall net debt flows fell 8.6 percent in 2011 to $465 billion ($508 billion in 2010), but remained above their pre-crisis level. The decline was driven entirely by the fall in net inflows from official creditors, which dropped to $30 billion, well below half the previous year’s level ($73 billion). In contrast net debt inflows from private creditors,
2

O V E R V I E W
Table I.1 External Debt Stock of Developing Countries and Selected Ratios, 2005–2011
$ billions
|
2005 |
2006 |
2007 |
2008 |
2009 |
2010 |
2011 |
|
|
|
|
|
|
|
|
Total External Debt Outstanding |
2,577 |
2,802 |
3,422 |
3,678 |
3,923 |
4,412 |
4,876 |
Long-term (including IMF) |
1,993 |
2,150 |
2,570 |
2,834 |
2,964 |
3,192 |
3,469 |
Public and publicly guaranteed (including IMF) |
1,308 |
1,294 |
1,395 |
1,443 |
1,580 |
1,674 |
1,773 |
Private nonguaranteed |
685 |
856 |
1,175 |
1,391 |
1,385 |
1,518 |
1,696 |
Short-term external debt |
512 |
607 |
811 |
793 |
810 |
1,062 |
1,249 |
Ratios |
|
|
|
|
|
|
|
External debt outstanding to GNI (%) |
27.4 |
25.0 |
24.6 |
22.1 |
24.1 |
22.7 |
21.5 |
External debt stocks to exports (%) |
80.8 |
71.8 |
71.9 |
63.9 |
85.0 |
76.3 |
69.3 |
Reserves to external debt outstanding (%) |
74.5 |
90.9 |
105.6 |
110.4 |
119.7 |
122.3 |
120.8 |
Short-term debt to imports (%) |
16.2 |
16.2 |
17.5 |
13.9 |
17.3 |
17.9 |
17.2 |
|
|
|
|
|
|
|
|
Sources: World Bank Debtor Reporting System and International Monetary Fund.
Note: GNI = gross national income; IMF = International Monetary Fund.
Table I.2. Net Debt Flows to Developing Countries, 2001–2011 $ billions
|
2001 |
2002 |
2003 |
2004 |
2005 |
2006 |
2007 |
2008 |
2009 |
2010 |
2011 |
|
|
|
|
|
|
|
|
|
|
|
|
Net debt flows |
51.2 |
8.6 |
81.0 |
120.5 |
138.8 |
200.0 |
487.8 |
229.2 |
159.6 |
508.2 |
464.5 |
Official creditors |
30.9 |
6.8 |
–11.9 |
–24.3 |
–64.3 |
–68.9 |
1.6 |
30.4 |
81.0 |
73.2 |
30.0 |
Bilateral |
–3.6 |
–8.2 |
–13.6 |
–12.1 |
–31.6 |
–45.8 |
–10.6 |
–1.2 |
7.1 |
12.8 |
5.8 |
Multilateral |
34.5 |
15.0 |
1.7 |
–12.2 |
–32.6 |
–23.1 |
12.2 |
31.7 |
73.9 |
60.4 |
24.1 |
World Bank |
7.4 |
–0.5 |
–2.6 |
2.4 |
2.6 |
–0.3 |
5.2 |
7.2 |
18.3 |
22.4 |
6.6 |
IMF |
19.5 |
14.2 |
2.4 |
–14.7 |
–40.2 |
–26.7 |
–5.1 |
10.8 |
26.8 |
13.8 |
0.5 |
Other multilateral |
7.6 |
1.3 |
1.9 |
0.2 |
4.9 |
3.9 |
12.2 |
13.6 |
28.8 |
24.1 |
17.0 |
Private creditors |
20.3 |
1.7 |
92.9 |
144.8 |
203.1 |
269.0 |
486.3 |
198.8 |
78.7 |
435.1 |
434.6 |
Net medium and long |
|
|
|
|
|
|
|
|
|
|
|
term debt flows |
0.1 |
–1.0 |
38.2 |
86.1 |
118.0 |
171.1 |
284.8 |
216.0 |
60.9 |
177.6 |
245.3 |
Public and publicly |
|
|
|
|
|
|
|
|
|
|
|
guaranteed |
3.3 |
3.8 |
1.5 |
40.8 |
33.3 |
17.7 |
50.8 |
6.2 |
40.8 |
85.5 |
71.4 |
Bonds |
18.9 |
16.4 |
17.5 |
35.5 |
19.8 |
1.1 |
24.1 |
9.5 |
39.0 |
68.9 |
59.5 |
Banks and other |
|
|
|
|
|
|
|
|
|
|
|
private |
–15.6 |
–12.6 |
–15.9 |
5.3 |
13.5 |
16.6 |
26.7 |
–3.2 |
1.8 |
16.5 |
11.9 |
Private nonguaranteed |
–3.2 |
–4.8 |
36.7 |
45.3 |
84.7 |
153.4 |
234.0 |
209.7 |
20.1 |
92.1 |
173.9 |
Bonds |
0.2 |
–2.4 |
1.3 |
2.1 |
25.5 |
32.4 |
42.8 |
–18.1 |
22.1 |
60.7 |
64.3 |
Banks and other |
|
|
|
|
|
|
|
|
|
|
|
private |
–3.5 |
–2.4 |
35.4 |
43.2 |
59.2 |
121.0 |
191.2 |
227.8 |
–1.9 |
31.3 |
109.6 |
Net short-term debt flows |
20.3 |
2.8 |
54.7 |
58.6 |
85.1 |
97.9 |
201.4 |
–17.1 |
17.8 |
257.6 |
189.3 |
|
|
|
|
|
|
|
|
|
|
|
|
Source: World Bank Debtor Reporting System.
Note: IMF = International Monetary Fund.
$435 billion, were almost identical to their 2010 level but with an important change in composition. Short-term inflows remained dominant, accounting for 44 percent of net debt inflows from private creditors, but fell 27 percent in 2011 to $189 billion. This decline, and a 28 percent fall in medium inflows from commercial banks to public sector borrowers, was offset by a more than tripling of medium term inflows from commercial banks to
private sector borrowers (table I.2). Overall net debt flows fell less sharply than anticipated in 2011 given the incipient recovery in the global economy and the turmoil in the Euro-zone. However, China, the single largest borrower among developing countries, drove the global trend. When China is excluded, net debt flows to developing countries falls to 13 percent in 2011, as compared to their 2010 level.
3

I N T E R N A T I O N A L D E B T S T A T I S T I C S 2 0 1 3
Viewed from the borrower perspective, trends in net debt inflows differed sharply in 2011. Those to private sector borrowers proved resilient and increased, albeit by a moderate 4 percent, in 2011 to $363 billion. In contrast net inflows to public and publicly guaranteed borrowers plummeted by 36 percent to $101 billion (figure I.1). In parallel, public and publicly guaranteed borrowers’ share of net debt inflows fell to 22 percent, from 31 percent in 2010 and 76 percent in 2009.
The external debt of developing countries is heavily concentrated in 10 middle-income
Figure I.1. Net Debt Inflows by Borrower Type
$ billions |
|
|
|
|
|
|
|
|
|
|
|
500 |
|
|
|
|
|
|
|
|
|
|
|
400 |
|
|
|
|
|
|
|
|
|
|
|
300 |
|
|
|
|
|
|
|
|
|
|
|
200 |
|
|
|
|
|
|
|
|
|
|
|
100 |
|
|
|
|
|
|
|
|
|
|
|
0 |
|
|
|
|
|
|
|
|
|
|
|
–100 |
|
|
|
|
|
|
|
|
|
|
|
2000 |
2001 |
2002 |
2003 |
2004 |
2005 |
2006 |
2007 |
2008 |
2009 |
2010 |
2011 |
Private sector nonguaranteed borrowers
Public and publicly guaranteed borrowers
Source: World Bank Debtor Reporting System.
emerging economies, namely those with the largest external debt stock at end 2011, referred to hereafter as the top 10 borrowers. From 2005 to 2011 the top 10 borrowers commanded between 56 and 65 percent of annual net debt inflows to developing countries. Net debt inflows to the top 10 borrowers fell by an average of 2 percent in 2011 from 2010 to $3.2 billion compared to a 14 percent fall for other developing countries combined. There was a wide disparity in trend among the top 10 borrowers in 2011 ranging from a 29 percent increase in net inflows to India as compared to a 67 percent decline in those to Turkey. China recorded a relatively moderate, 10 percent increase in net inflows in 2011 but its share of developing countries’ net debt inflows remained dominant, 27 percent in 2011 up from 24 percent in 2010, and dictated the global trend. When China is excluded, net debt inflows to developing countries are shown to have fallen 10 percent in 2011. The BRICs (Brazil, the Russian Federation, India, and China) accounted for 55 percent of net debt inflows to developing countries in 2011, unchanged from 2010. Together the BRICs accounted for 40 percent, and the top 10 borrowers for 65 percent of the end 2011 external debt stock owed by all developing countries (table I.3).
Table I.3. Top 10 Borrowers-External Debt Stock 2011, and Net Inflows, 2010–2011
$ billions
|
|
External debt stock end 2011 |
|
Net inflow 2010 |
Net inflow 2011 |
% change in net |
% of total net |
|
|
|
|
||||||
|
|
|
|
|
|
|
||
|
|
|
|
|
|
|
||
Country |
|
Amount |
% of total |
|
Amount |
Amount |
inflow 2011 |
flow 2011 |
|
|
|||||||
|
|
|
|
|
|
|
|
|
China |
685.4 |
14.1 |
115.2 |
127.1 |
10.3 |
27.4 |
||
Russian Federation |
543.0 |
11.1 |
31.1 |
32.8 |
5.5 |
7.1 |
||
Brazil |
404.3 |
8.3 |
70.8 |
51.9 |
–26.7 |
11.2 |
||
Turkey |
307.0 |
6.3 |
21.9 |
7.1 |
–67.3 |
1.5 |
||
India |
334.3 |
6.9 |
34.1 |
44.0 |
28.9 |
9.5 |
||
Mexico |
287.0 |
5.9 |
43.9 |
43.2 |
–1.5 |
9.3 |
||
Indonesia |
213.5 |
4.4 |
15.8 |
18.4 |
16.4 |
4.0 |
||
Ukraine |
134.5 |
2.8 |
16.7 |
18.5 |
10.2 |
4.0 |
||
Romania |
129.8 |
2.7 |
4.3 |
5.5 |
28.1 |
1.2 |
||
Kazakhstan |
124.4 |
2.6 |
7.2 |
5.2 |
–26.8 |
1.1 |
||
Total top 10 borrowers |
3,163.4 |
64.9 |
360.9 |
353.7 |
–2.0 |
76.2 |
||
Other developing countries |
1,712.7 |
35.1 |
128.7 |
110.2 |
–14.4 |
23.8 |
||
All developing countries |
4,876.0 |
100.0 |
489.6 |
463.8 |
–5.3 |
100.0 |
||
|
|
|
|
|
|
|
|
|
Source: World Bank Debtor Reporting System.
4

O V E R V I E W
II. Recent Trends in Official and Private Debt Flows to Developing Countries
In the wake of the global economic and financial crisis that erupted in 2008, debt flows from private creditors to developing countries contracted sharply while those from official creditors rose as multilateral creditors, in particular the International Monetary Fund (IMF) and the World Bank, stepped in with emergency financing for countries most impacted by the crisis. In 2009, net debt inflows from official creditors exceeded those from private creditors for the first time since 2002. However, these financing patterns have proved to be shortlived and the economic rebound in most developing countries since 2010 has led to a strong resumption of inflows from private creditors and parallel con-
traction in financing from official creditors.
Net debt inflows from official creditors in the form of concessional and non-concessional loans fell almost 60 percent in 2011 to $30 billion primarily as a consequence of the virtual cessation of a net inflow of IMF financing to developing countries and the collapse in net inflows from IBRD which dropped to $2.1 billion from $17.1 billion in 2010 (see annex B for detailed information on lending by the World Bank (IBRD and IDA) in 2011). Net inflows from bilateral creditors were also down to less than half of their 2010 level (Table II.1).
Countries in Europe and Central Asia, and Latin America and the Caribbean, who together received around two-thirds of the $103 billion in net debt inflows from multilateral creditors in 2008-2010, bore the brunt of the downturn in
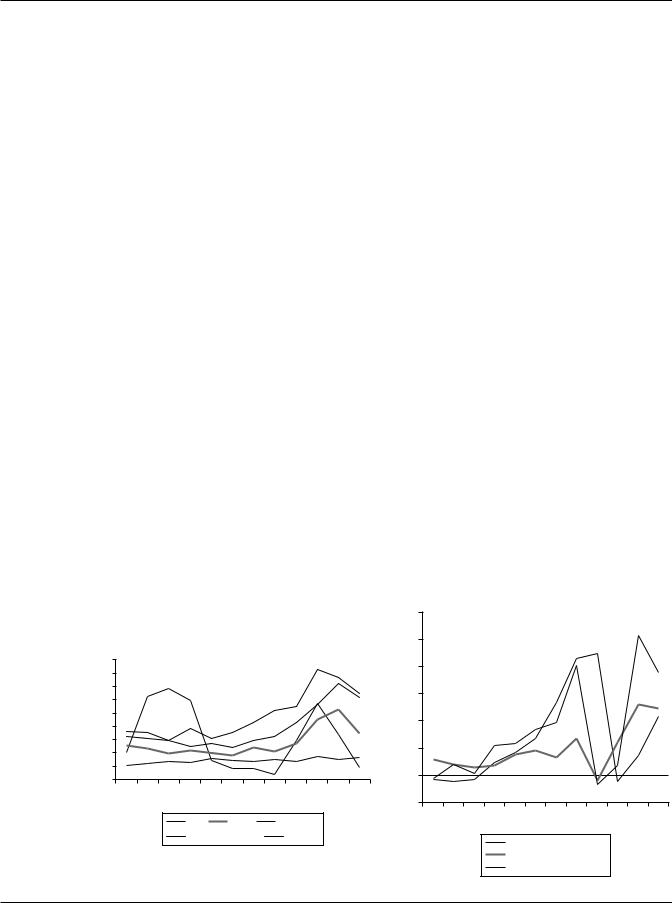
2011. Net inflows to the former were down 30 percent from their 2010 level, while those to the latter plunged to $2 billion ($18 billion in 2010) (figure II.1).
Gross inflows from multilateral institutions, (defined as IMF purchases and disbursements on loans from multilateral creditors) increased by 121 percent between 2007 and 2009. The dominant factor behind this rapid rise was member countries’ purchases from the IMF, which increased fourteenfold in this period, and the 76 percent rise in disbursements from IBRD and IDA. However, this trend reversed in 2010 when disbursements from multilateral creditors dropped by 12 percent, and
Figure II.1. Net Inflow from Multilateral Creditors,
2008–2011 |
$ billions |
35 |
30 |
25 |
20 |
15 |
10 |
5 |
0 |
|
|
|
CentralAsia |
|
|
|
|
|
|
|
|
Africa |
|
|
|
|
|
SaharanAfrica |
|||||
|
and |
|
|
|
|
|
|
|
|
|
and |
|
|
|
and |
|
|
|
Asia |
Sub |
|
||
|
the |
|
|
|
|
|
|
|
Caribbean |
East |
|
|
|
|
|
|
|
||||||
|
Asia Pacific |
|
|
|
|
America |
|
|
|
South |
|
- |
|||||||||||
East |
Europe |
and |
|
Latin |
Middle North |
|
|
|
|
|
|||||||||||||
|
|
the |
|
|
|
|
|
|
|
||||||||||||||
|
|
|
|
|
|
|
|
|
|
|
|
|
|||||||||||
|
|
|
|
|
|
2008 |
|
2009 |
|
|
2010 |
|
|
20011 |
|
|
|||||||
|
|
|
|
|
|
|
|
|
|||||||||||||||
Source: World Bank Debtor Reporting System.
Table II.1. Net Official Loan Financing to Developing Countries, 2005–2011 $ billions
|
2005 |
2006 |
2007 |
2008 |
2009 |
2010 |
2011 |
|
|
|
|
|
|
|
|
Total Official Creditors |
–64.3 |
–68.9 |
1.6 |
30.4 |
81.0 |
73.2 |
30.0 |
Bilateral |
–31.6 |
–45.8 |
–10.6 |
–1.2 |
7.1 |
12.8 |
5.8 |
Multilateral |
–32.6 |
–23.1 |
12.2 |
31.7 |
73.9 |
60.4 |
24.1 |
Of which: |
|
|
|
|
|
|
|
IBRD |
–2.9 |
–5.3 |
–0.4 |
2.7 |
11.8 |
17.1 |
2.1 |
IDA |
5.6 |
5.0 |
5.5 |
4.6 |
6.5 |
5.3 |
4.5 |
IMF |
–40.2 |
–26.7 |
–5.1 |
10.8 |
26.8 |
13.8 |
0.5 |
Memorandum item: |
|
|
|
|
|
|
|
IDA grants |
1.2 |
1.2 |
1.9 |
2.1 |
2.5 |
2.2 |
2.4 |
|
|
|
|
|
|
|
|
Source: World Bank Debtor Reporting System.
Note: IBRD = International Bank for Reconstruction and Development; IDA = International Development Association; IMF = International Monetary Fund.
5
I N T E R N A T I O N A L D E B T S T A T I S T I C S 2 0 1 3
the downward trajectory accelerated in 2011 when they fell a further 26 percent, driven by a 74 percent fall in IMF purchases by developing countries and a 34 percent drop in disbursements from IBRD.
There was also a decline in gross inflows from bilateral creditors. These fell 14 percent in 2011 to $31 billion but remained at close to double their pre-crisis level and accounted for just over a third of 2011 gross flows from official creditors (figure II.2). Intra-developing country lending, or so-called South-South flows, continued to be an increasingly important element in flows from bilateral creditors, and new commitments, a leading indicator of the level and trajectory of future disbursements, point to a continuation of this trend. In 2011, bilateral creditors signed new loan agreements totaling approximately $53 billion, almost the same amount as in 2010, of which China and Russia combined accounted for two thirds. Loans from these two creditors are for financing of large infrastructure projects, principally in the power and transport sector.
The Resilience of Lending by Private Creditors
Net debt inflows from private creditors in 2011 were $435 billion, almost identical to those in 2010 and only about 10 percent below their pre-crisis peak in 2007. The change was in composition of inflows from commercial banks
Figure II.2. Gross Inflows from Bilateral and Multilateral Creditors to Developing Countries,
and other financial institutions. These were characterized by a strong return of medium term financing, which rose to $122 billion from $48 billion in 2010. In parallel, the net inflow of short-term debt fell 27 percent to $189 billion (figure II.3)
Private sector borrowers were the beneficiary of the recovery in long term financing from banks and other financial institutions, much of it export or project related and often underwritten by a guarantee from an export credit agency or multilateral institution. They saw net inflows more than triple in 2011 to $110 billion fueled by a 30 percent rise in gross disbursements in 2011 and only a very small 4 percent increase in principal repayments since much of the pre-crisis borrowing has already been fully repaid. Over 80 percent of these flows went to countries in Latin America and the Caribbean, and Europe and Central Asia. Comparable inflows to public sector borrowers fell almost 30 percent to $12 billion, primarily largely as a result of decline in gross disbursements. (figure II.4).
Short-term debt inflows remained the single most important component of financing from private creditors to developing countries, accounting for 44 percent of net debt inflows from private creditors in 2011. These flows, primarily trade
Figure II.3. Net Private Debt Inflows by Creditor Type, 2005–2011
$ billions
300
2000–2011 |
|
|
|
|
|
|
|
|
|
|
|
|
|
|
|
|
|
|
|
|
|
|
|
$ billions |
|
|
|
|
|
|
|
|
|
|
|
250 |
|
|
|
|
|
|
|
|
|
|
|
|
|
|
|
|
|
|
|
|
|
|
|
|
|
|
|
|
|
|
|
|
|
|
|
45 |
|
|
|
|
|
|
|
|
|
|
|
200 |
|
|
|
|
|
|
|
|
|
|
|
40 |
|
|
|
|
|
|
|
|
|
|
|
|
|
|
|
|
|
|
|
|
|
|
|
|
|
|
|
|
|
|
|
|
|
|
|
|
|
|
|
|
|
|
|
|
|
|
|
35 |
|
|
|
|
|
|
|
|
|
|
|
150 |
|
|
|
|
|
|
|
|
|
|
|
30 |
|
|
|
|
|
|
|
|
|
|
|
|
|
|
|
|
|
|
|
|
|
|
|
|
|
|
|
|
|
|
|
|
|
|
|
|
|
|
|
|
|
|
|
|
|
|
|
25 |
|
|
|
|
|
|
|
|
|
|
|
100 |
|
|
|
|
|
|
|
|
|
|
|
20 |
|
|
|
|
|
|
|
|
|
|
|
|
|
|
|
|
|
|
|
|
|
|
|
|
|
|
|
|
|
|
|
|
|
|
|
|
|
|
|
|
|
|
|
|
|
|
|
15 |
|
|
|
|
|
|
|
|
|
|
|
50 |
|
|
|
|
|
|
|
|
|
|
|
10 |
|
|
|
|
|
|
|
|
|
|
|
|
|
|
|
|
|
|
|
|
|
|
|
|
|
|
|
|
|
|
|
|
|
|
|
|
|
|
|
|
|
|
|
|
|
|
|
5 |
|
|
|
|
|
|
|
|
|
|
|
0 |
|
|
|
|
|
|
|
|
|
|
|
0 |
|
|
|
|
|
|
|
|
|
|
|
|
|
|
|
|
|
|
|
|
|
|
|
|
|
|
|
|
|
|
|
|
|
|
|
|
|
|
|
|
|
|
|
|
|
|
|
2000 |
2001 |
2002 |
2003 |
2004 |
2005 |
2006 |
2007 |
2008 |
2009 |
2010 |
2011 |
−50 |
2001 |
2002 |
2003 |
2004 |
2005 |
2006 |
2007 |
2008 |
2009 |
2010 |
2011 |
|
|
|
IMF |
IBRD |
|
IDA |
|
|
|
2000 |
|||||||||||||
|
|
|
|
|
|
|
|
|
|
|
|
|
|
|
|
|
|
|
|||||
|
|
|
Other multilateral |
|
Bilateral |
|
|
|
|
|
|
Banks and other private |
|
|
|||||||||
|
|
|
|
|
|
|
|
|
|
|
|
|
|
|
|
|
|
||||||
Source: World Bank Debtor Reporting System.
Note: IBRD = International Bank for Reconstruction and Development; IDA = International Development Association; IMF = International Monetary Fund.
Bonds
Short term
Source: World Bank Debtor Reporting System.
6

O V E R V I E W
Figure II.4. Gross Long-Term Commercial Bank Flows to Developing Countries, 2000–2011
$ billions |
|
|
|
|
|
|
|
|
|
|
|
500 |
|
|
|
|
|
|
|
|
|
|
|
450 |
|
|
|
|
|
|
|
|
|
|
|
400 |
|
|
|
|
|
|
|
|
|
|
|
350 |
|
|
|
|
|
|
|
|
|
|
|
300 |
|
|
|
|
|
|
|
|
|
|
|
250 |
|
|
|
|
|
|
|
|
|
|
|
200 |
|
|
|
|
|
|
|
|
|
|
|
150 |
|
|
|
|
|
|
|
|
|
|
|
100 |
|
|
|
|
|
|
|
|
|
|
|
50 |
|
|
|
|
|
|
|
|
|
|
|
0 |
|
|
|
|
|
|
|
|
|
|
|
2000 |
2001 |
2002 |
2003 |
2004 |
2005 |
2006 |
2007 |
2008 |
2009 |
2010 |
2011 |
Gross disbursements public borrowers
Gross disbursements private sector borrowers
Principal payments public borrowers
Principal payments private sector borrowers
Source: World Bank Debtor Reporting System.
related, were highly concentrated, with over 75 percent of net short-term debt inflows in 2011 going to countries in East Asia and the Pacific. They received $145 billion, an almost identical amount to 2010, and of these flows, $129 billion, close to 90 percent of the regional total, went to China. In sharp contrast, Latin America and the Caribbean, which recorded a $44 billion inflow in 2010, registered a $3 billion outflow in 2011. The principal factor was the $50 billion turnaround in flows to Brazil, which went from a net inflow of $26 billion in 2010 to an outflow of $23 billion in 2011, with long term commercial bank financing replacing short-term debt. Elsewhere across the region, flows were mainly positive including a net inflow of $12 billion to Mexico ($11 billion in 2010). Inflows to Europe and Central Asia in 2011 were only a little over half those of the previous year with most of the downturn accounted for by the contraction in net inflow to Turkey, $6 billion as compared to $28 billion in 2010. In South Asia the trend was in the opposite direction, with the net inflow in 2011 double that of 2010 on account of the rapid rise in net inflow to India to $22 billion ($10 billion in 2010) (table II.2).
Table II.2. Net Short-Term Debt Flows by Developing Country Regions, 2007–2011
$ billions
|
2007 |
2008 |
2009 |
2010 |
2011 |
|
|
|
|
|
|
East Asia and the |
|
|
|
|
|
Pacific |
52.9 |
–13.3 |
65.0 |
148.9 |
144.9 |
Europe and Central |
|
|
|
|
|
Asia |
101.2 |
–16.9 |
–34.9 |
45.9 |
24.5 |
Latin America and |
|
|
|
|
|
the Caribbean |
23.9 |
2.6 |
–8.6 |
43.8 |
–3.0 |
Middle East and |
|
|
|
|
|
North Africa |
3.3 |
–1.9 |
3.0 |
4.5 |
0.9 |
South Asia |
13.1 |
8.0 |
2.7 |
11.8 |
22.5 |
Sub-Saharan Africa |
7.0 |
4.4 |
–9.5 |
2.8 |
–0.5 |
All developing |
|
|
|
|
|
countries |
201.4 |
–17.1 |
17.8 |
257.6 |
189.3 |
Of which: |
|
|
|
|
|
top 10 borrowers |
149.1 |
–29.8 |
30.2 |
208.6 |
171.2 |
|
|
|
|
|
|
Sources: World Bank Debtor Reporting System and Bank for International Settlements.
Bond issuance in international capital markets by developing countries’ public and private borrowers held up well in 2011, totaling $188 billion, compared to the $182 billion issued in 2010. The main driver was again issuance by corporate borrowers in developing countries. This increased by 16 percent in 2011, bringing their share of total 2011 bond issuance to 49 percent, up from 43 percent in 2010. Countries in Latin America and the Caribbean again led the way in corporate bond issuance. They rose 14 percent to $63 billion, and accounted for almost 70 percent of corporate bond issuances by all developing countries in 2011. The private sector in Brazil and Mexico were the dominant players, with total issuances of $31 billion and $18 billion, respectively, of which around half were placed by the financial sector and the other half by large companies. In East Asia and the Pacific region and Europe and Central Asia the major players were Chinese, Russian and Turkish corporations. Sovereign and public sector bond issues fell 7 percent in 2011 from the previous year with most of this decline due to the sharp drop in new issues by India. The doubling of public sector bond issues in Sub-Saharan Africa was due largely to South Africa but Nigeria came to the market in January 2011 with a debut $500 million 10-year sovereign bond (table II.3).
7
I N T E R N A T I O N A L D E B T S T A T I S T I C S 2 0 1 3
Table II.3. Bond Issuance by Developing Country Borrowers, 2010–2011
$ billions
|
|
Public |
|
Corporate |
||
|
|
borrowers |
|
borrowers |
||
|
|
|
|
|
|
|
|
|
|
|
|
|
|
|
|
2010 |
2011 |
2010 |
2011 |
|
|
|
|
|
|
|
|
East Asia and the Pacific |
12.9 |
13.1 |
15.3 |
15.4 |
||
Europe and Central Asia |
27.8 |
25.2 |
7.1 |
10.9 |
||
Latin America and |
|
|
|
|
|
|
the Caribbean |
43.2 |
46.7 |
55.0 |
62.7 |
||
Middle East and North Africa |
5.5 |
4.0 |
0.0 |
0.0 |
||
South Asia |
12.1 |
3.0 |
1.3 |
0.7 |
||
Sub-Saharan Africa |
2.0 |
4.5 |
0.0 |
1.7 |
||
All developing countries |
103.5 |
96.4 |
78.7 |
91.4 |
||
Of which: |
|
|
|
|
|
|
top 10 borrowers |
68.2 |
61.0 |
64.1 |
73.8 |
||
|
|
|
|
|
|
|
Source: World Bank Debtor Reporting System.
III. The Rapid Growth in Private Sector External Debt
The increasingly important role of the private sector in the overall economic landscape of many developing countries is reflected in the
evolution of developing countries’ private nonguaranteed external debt and the composition of developing countries’ external debt stock. There is, as yet, no comprehensive international data series on the external obligations of developing countries’ private sector. Many countries do not have the mechanisms in place to collect and report on this category of external obligations, but the importance of setting up an appropriate institutional framework is widely recognized, and significant improvements have already been realized. Despite the current limitations, International Debt Statistics (IDS) draws on the data on private nonguaranteed external debt reported to the World Bank DRS and provides important and viable information on overall trends.
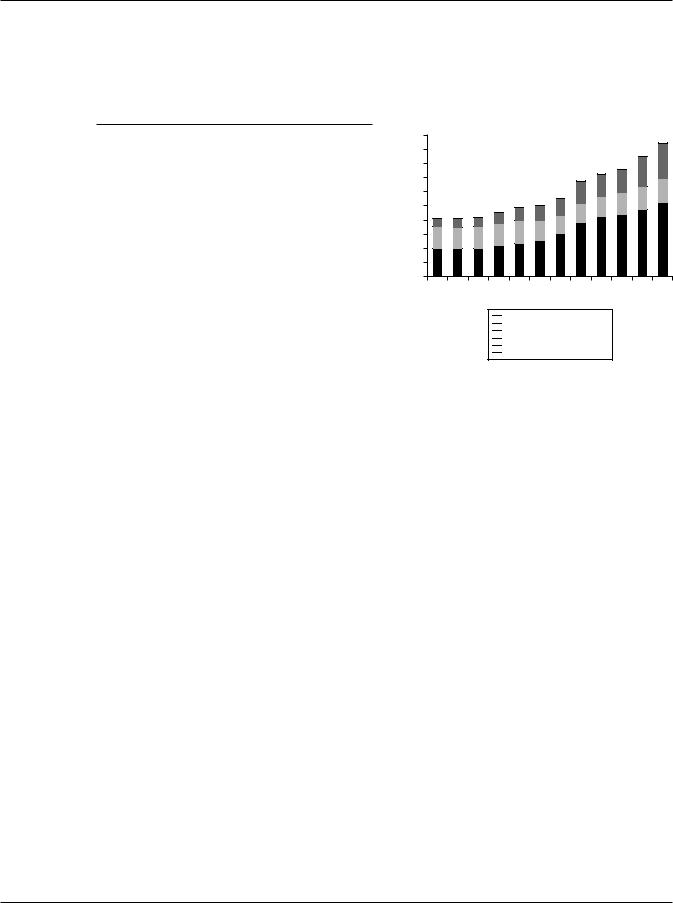
Over the past decade there has been a significant shift, marked by a rapid rise in debt owed to private sector borrowers and a corresponding fall in the external obligations of the public sector. In 2011, the long term external obligations of private sector borrowers in developing countries amounted to US$2,616 billion, more than two times their 2000 level (figure III.1). As a share of developing countries’ total long-term external obligations, those of private sector borrowers increased from 57 percent in 2000 to almost 75 percent in 2011. Taken together with short
Figure III.1. Stock of External Debt by Borrower Type and Maturity, 2000–2011
$ billions |
|
|
|
|
|
|
|
|
|
|
|
5,000 |
|
|
|
|
|
|
|
|
|
|
|
4,500 |
|
|
|
|
|
|
|
|
|
|
|
4,000 |
|
|
|
|
|
|
|
|
|
|
|
3,500 |
|
|
|
|
|
|
|
|
|
|
|
3,000 |
|
|
|
|
|
|
|
|
|
|
|
2,500 |
|
|
|
|
|
|
|
|
|
|
|
2,000 |
|
|
|
|
|
|
|
|
|
|
|
1,500 |
|
|
|
|
|
|
|
|
|
|
|
1,000 |
|
|
|
|
|
|
|
|
|
|
|
500 |
|
|
|
|
|
|
|
|
|
|
|
0 |
|
|
|
|
|
|
|
|
|
|
|
2000 |
2001 |
2002 |
2003 |
2004 |
2005 |
2006 |
2007 |
2008 |
2009 |
2010 |
2011 |

 Short term

 Public sector—long term

 Private sector—long term
Source: World Bank Debtor Reporting System.
term debt, primarily owed by private sector borrowers, the external obligations of the private sector in 2011 were equivalent to 17 percent of developing countries’ GNI and 52 percent of their export earnings.
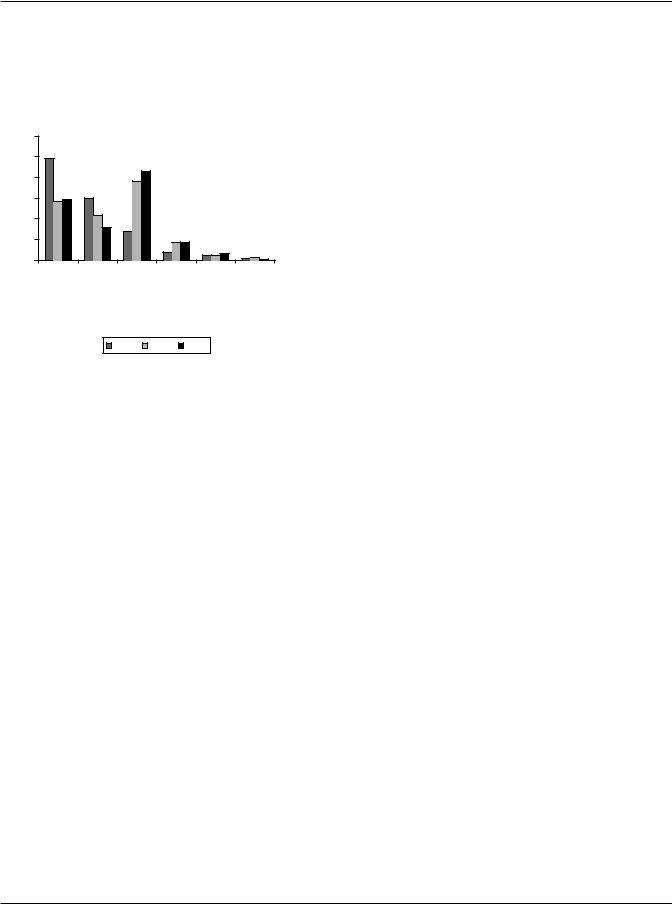
The bulk of the borrowing has been by the private sector in the more advanced emerging market countries, notably those in East Asia and the Pacific, Europe and Central Asia, and Latin America and the Caribbean. Taken together, these three regions accounted for 88 percent of long-term external obligations of developing countries’ private sector borrowers, down slightly from 93 percent in 2000. Over this period there has, however, been a noticeably shift in relative shares within these regions. Whereas countries in Latin America and the Caribbean accounted for 49 percent in 2000, their share had fallen to 29 percent by 2011. Similarly, external borrowing by the private sector in countries in East Asia and the Pacific declined, almost halving the region’s share to 16 percent, from 30 percent in 2000. This was in stark contrast to Europe and Central Asia where a rapid increase in private sector borrowing tripled the region’s share to 43 percent of the combined longterm debt obligations of private sector borrowers in developing countries in 2011 from 14 percent in 2000 (figure III.2). However, these data need to be interpreted with some caution, particularly in regard to those regions where external borrowing by the private sector is seen to be low, as typically
8
O V E R V I E W
Figure III.2. Long-Term External Debt of Private Sector Borrowers: Regional Distribution
Percent |
|
|
|
|
|
|
|
|
|
|
|
|
|
|
|
|
|
60 |
|
|
|
|
|
|
|
|
|
|
|
|
|
|
|
|
|
50 |
|
|
|
|
|
|
|
|
|
|
|
|
|
|
|
|
|
40 |
|
|
|
|
|
|
|
|
|
|
|
|
|
|
|
|
|
30 |
|
|
|
|
|
|
|
|
|
|
|
|
|
|
|
|
|
20 |
|
|
|
|
|
|
|
|
|
|
|
|
|
|
|
|
|
10 |
|
|
|
|
|
|
|
|
|
|
|
|
|
|
|
|
|
|
0 |
|
|
|
|
|
|
|
|
|
|
|
|
|
|
|
|
|
|
America |
|
and |
|
|
and |
|
|
Asia |
|
Africa |
East |
and |
|||
|
|
Asia Pacific |
|
|
Asia |
|
|
|
|
|
|
Africa |
|||||
Latin |
Caribbean |
the |
|
Europe |
|
|
South |
|
Saharan |
|
|
|
|
||||
East |
|
|
Central |
|
|
|
|
Middle North |
|
||||||||
|
the |
|
|
|
|
|
|
|
- |
|
|
||||||
and |
|
|
|
|
|
|
|
|
|
Sub |
|
|
|
|
|
|
|
|
|
|
|
|
|
|
|
|
|
|
|
|
|
|
|
|
|
|
|
|
|
|
|
2000 |
|
2005 |
|
2011 |
|
|
|
||||
Source: World Bank Debtor Reporting System.
it is often countries in these regions where mechanisms for the capture and compilation of statistics on private sector borrowing remain weak. As an illustration, the International Finance Corporation (IFC), the private lending arm of the World Bank Group, reported claims of around $6 billion in 2011 in direct loans and guaranteed syndicated bank loans in Sub-Saharan Africa, where it is active in 31 countries. Most of these countries do not report on private sector borrowing to the World Bank Debtor Reporting System.
The rise in borrowing by developing countries’ private sector has been accompanied by a diversification of borrowing instruments, in particular corporate bond issuance. In 2011, developing country corporate bond issuance accounted for 19 percent of gross long term external inflows, compared to 12 percent at the start of the decade. This type of external financing has however been highly concentrated in the large corporate sector of the more advanced emerging market countries. Most private sector borrowers rely primarily on commercial bank credit to finance trade or specific projects, refinance debt and fund day-to-day operations. An important reason for this is information asymmetry. Because of their close relations with clients, banks are often better positioned than bond investors to gather information on prospective borrowers. Additionally, many private sector borrowers have no credit rating. Another increasingly important source of financing is multilateral institutions like
the IFC of the World Bank Group, the European Bank for Reconstruction and Development (EBRD) and the private lending arms of the regional development banks. These institutions often operate in tandem with bilateral and commercial lending for the financing of large-scale infrastructure projects.
IV. External Debt Burden of Developing Countries—Selected Indicators
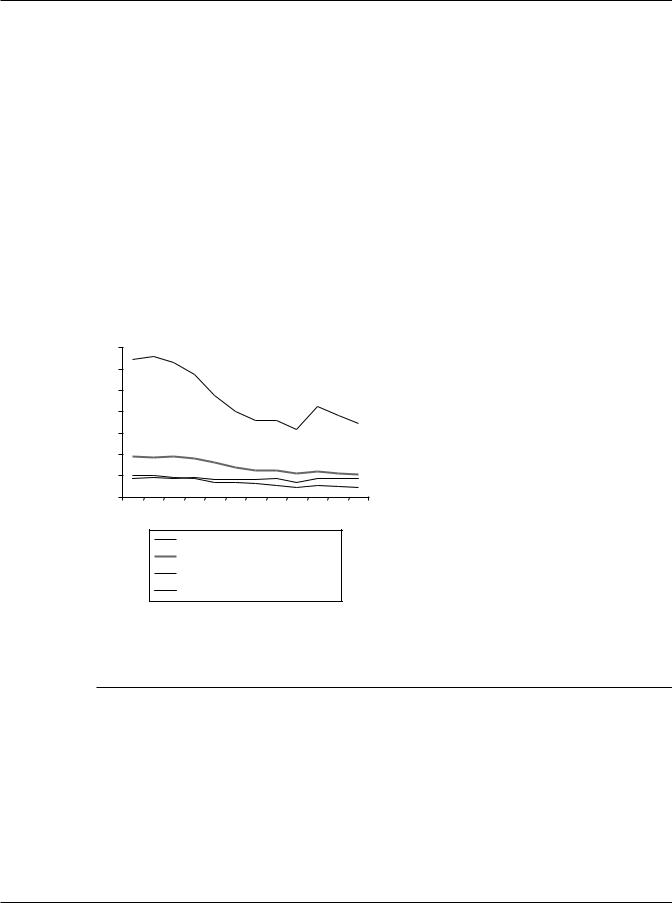
From the start of the decade to 2008, developing countries external debt indicators, measured in terms of GNI and export earnings, improved
markedly. Over this period the combined stock of developing countries’ external debt, measured in relation to export earnings, fell to 63.9 percent, less than half its 2000 level, 129 percent. The corresponding drop in the ratio of external debt stocks to developing countries’ GNI was from 37.9 percent to 22.1 percent. Several factors were at play, including strong growth performance, a sharp rise in export earnings due to increased export volumes, high international prices for primary commodities and a marked shift in external financing from debt to equity in a number of developing countries. In the case of low-income countries, large scale forgiveness of external debt obligations, primarily in the context of the Highly Indebted Poor Countries (HIPC) and Multilateral Debt Relief Initiative (MDRI) was also an important contributing factor.
The global economic and financial crisis interrupted the trend. In 2009 a sharp (20 percent) contraction in developing countries’ export earnings, coupled with increased external borrowing to finance current account deficits and fiscal stimulus measures, pushed the ratio of total external debt outstanding to exports up to 85 percent, its highest level since 2005. The ratio of outstanding external debt to GNI also rose, to 24.2 percent, reflecting the decline in developing countries’ combined GNI. However, despite continued global economic uncertainty the majority of developing countries saw their economy rebound strongly in 2010–2011. This has translated into improvements in the ratio of debt to GNI and to export earnings, 21.5 percent and 69.3 percent, respectively, at end 2011 for all developing countries combined (figure IV.1)
The improvement in debt indicators was widespread with all regions recording an improvement in the ratio of external debt to export earnings in
9
I N T E R N A T I O N A L D E B T S T A T I S T I C S 2 0 1 3
2011, and the same was broadly true with regard to the ratio of debt to GNI. In the regions where the ratio rose in 2011, Latin America and the Caribbean and South Asia, it did so only marginally. East Asia and the Pacific has the lowest debt burden measured against both GNI and export earnings, despite a sharp increase in debt outstanding since 2009. Countries in Europe and Central Asia are, on average, the most heavily indebted among developing countries and some of the most severely impacted by the global economic crisis. This was reflected in the marked deterioration in the average ratio of external
Figure IV.1. Key Debt Indicators: Trend 2000–2011
Percent |
|
|
|
|
|
|
|
|
|
|
|
140 |
|
|
|
|
|
|
|
|
|
|
|
120 |
|
|
|
|
|
|
|
|
|
|
|
100 |
|
|
|
|
|
|
|
|
|
|
|
80 |
|
|
|
|
|
|
|
|
|
|
|
60 |
|
|
|
|
|
|
|
|
|
|
|
40 |
|
|
|
|
|
|
|
|
|
|
|
20 |
|
|
|
|
|
|
|
|
|
|
|
0 |
|
|
|
|
|
|
|
|
|
|
|
2000 |
2001 |
2002 |
2003 |
2004 |
2005 |
2006 |
2007 |
2008 |
2009 |
2010 |
2011 |
debt to GNI and to export earnings for countries in the region between 2008 and 2009. Both ratios improved in 2010 and still further in 2011 to 43.1 percent and 111.8 percent, respectively, levels only slightly above their pre-crisis (2008) level. The top 10 borrowing countries have a ratio of debt to exports broadly comparable to that of other developing countries. Measured in relation to GNI, their debt burden is lower, an average of 19 percent in 2011 compared to an average of 31 percent for other developing countries (table IV.1).
Developing countries have seen a significant improvement in external debt payment capacity over the past decade, measured as the ratio of external debt service to export earnings, and this trend continued in 2011 despite the further 11 percent rise in their combined external debt obligations. The average debt service to export ratio for all developing countries combined dropped to 8.8 percent, compared to 11.3 percent in 2009 and 20.4 percent at the start of the decade. This is primarily a consequence of increased export earnings but it is also a direct outcome of debt restructuring and outright debt relief from official and private creditors, in the context of the HIPC and MDRI and additional bilateral debt relief.
External debt stocks to exports (%)
External debt stocks to GNI (%)
Debt service to exports (%)
Short-term debt to imports (%)
Sources: World Bank Debtor Reporting System and International Monetary Fund.
Note: GNI = gross national income.
V. Aggregate Net Capital Flows to Developing Regions
International capital flows, debt and equity combined fell to $1,107 billion in 2011, 9 percent lower than 2010 and below their 2007 pre-crisis peak. Measured in relation to developing country
Table IV.1. Debt Indicators for Developing Country Regions
Percent
|
|
Debt outstanding/GNI |
|
|
|
Debt outstanding/exports |
|
||
|
|
|
|
|
|
||||
|
|
|
|
|
|
|
|
|
|
|
|
|
|
|
|
|
|
|
|
Country group |
2008 |
2009 |
2010 |
2011 |
2008 |
2009 |
2010 |
2011 |
|
|
|
|
|
|
|
|
|
|
|
East Asia and the Pacific |
13.1 |
13.8 |
14.2 |
13.5 |
32.5 |
43.3 |
41.0 |
39.9 |
|
Europe and Central Asia |
40.2 |
52.4 |
47.7 |
43.1 |
106.7 |
156.1 |
136.3 |
111.8 |
|
Latin America and the Caribbean |
21.7 |
24.3 |
22.4 |
22.7 |
87.2 |
115.3 |
106.8 |
99.0 |
|
Middle East and North Africa |
15.9 |
17.3 |
16.4 |
15.0 |
39.5 |
51.5 |
51.5 |
44.5 |
|
South Asia |
21.0 |
21.5 |
19.8 |
20.0 |
84.9 |
110.7 |
94.8 |
86.8 |
|
Sub-Saharan Africa |
24.3 |
27.9 |
26.1 |
24.8 |
56.3 |
82.1 |
69.7 |
62.5 |
|
Top 10 borrowing countries |
19.7 |
21.3 |
20.1 |
19.1 |
64.1 |
84.7 |
75.7 |
69.7 |
|
Other developing countries |
28.0 |
31.4 |
31.7 |
31.2 |
68.1 |
93.2 |
83.3 |
76.9 |
|
All developing countries |
22.1 |
24.2 |
22.7 |
21.5 |
63.9 |
85.0 |
76.4 |
69.3 |
|
|
|
|
|
|
|
|
|
|
|
Sources: World Bank Debtor Reporting System and International Monetary Fund.
Note: GNI = gross national income.
10