

Theory of Consumer Behavior and Rational Choice. Теория потребительского поведения и рационального выбора.
T
 he
utility
of a consumer is a measure of the satisfaction the consumer derives
from consumption of goods and services. An individual’s consumption
bundle
is the collection of all the goods and services consumed by that
individual. An individual’s
utility function
gives the total utility generated by his or her consumption bundle.
The unit of utility is a util.
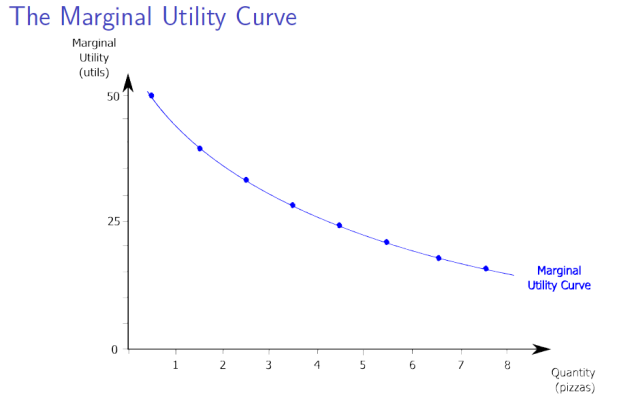
The marginal
utility of
a good or service is the change in total utility generated by
consuming one additional unit of that good or service. The marginal
utility curve shows
how marginal utility depends on the quantity of a good or service
consumed.
The
principle
of diminishing marginal utility says
that each successive unit of a good or service consumed adds less to
total utility than the previous unit. The marginal
utility curve
slopes downward due to diminishing marginal utility.
he
utility
of a consumer is a measure of the satisfaction the consumer derives
from consumption of goods and services. An individual’s consumption
bundle
is the collection of all the goods and services consumed by that
individual. An individual’s
utility function
gives the total utility generated by his or her consumption bundle.
The unit of utility is a util.
The marginal
utility of
a good or service is the change in total utility generated by
consuming one additional unit of that good or service. The marginal
utility curve shows
how marginal utility depends on the quantity of a good or service
consumed.
The
principle
of diminishing marginal utility says
that each successive unit of a good or service consumed adds less to
total utility than the previous unit. The marginal
utility curve
slopes downward due to diminishing marginal utility.
A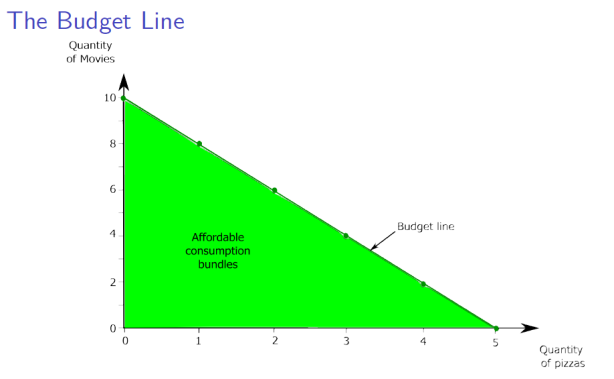 budget
constraint
limits a consumer’s spending to no more than his or her income. It
defines the consumer’s consumption
possibilities,
the set of all affordable consumption bundles. A consumer who spends
all of his or her income will choose a consumption bundle on the
budget
line.
An individual chooses the consumption bundle that maximizes total
utility, the optimal
consumption bundle.
budget
constraint
limits a consumer’s spending to no more than his or her income. It
defines the consumer’s consumption
possibilities,
the set of all affordable consumption bundles. A consumer who spends
all of his or her income will choose a consumption bundle on the
budget
line.
An individual chooses the consumption bundle that maximizes total
utility, the optimal
consumption bundle.
T he
marginal
utility per dollar spent
on a good or service is the additional utility from spending one more
dollar on that good or service. The optimal
consumption rule says
that when a consumer maximizes utility, the marginal utility per
dollar spent must be the same for all goods and services in the
consumption bundle (MU1/P1=MU2/P2).
he
marginal
utility per dollar spent
on a good or service is the additional utility from spending one more
dollar on that good or service. The optimal
consumption rule says
that when a consumer maximizes utility, the marginal utility per
dollar spent must be the same for all goods and services in the
consumption bundle (MU1/P1=MU2/P2).
Changes in the price of a good affect the quantity consumed in two possible ways: the substitution effect and the income effect. For normal goods, the substitution and income effects reinforce each other. For inferior goods, however, they work in opposite directions.
An indifference curve is a contour line that shows all the consumption bundles that yield the same amount of total utility for an individual. The entire utility function of an individual can be represented by an indifference curve map, a collection of indifference curves in which each curve corresponds to a different total utility level. General properties: 1) indifference curves never cross; 2) the farther out an indifference curve is from the origin, the higher the level of total utility it indicates; 3) they are downward sloping; 4) are convex as a result of diminishing marginal utility.
T he
marginal
rate of substitution,
or MRS,
of R in place of M—the rate at which a consumer is willing to
substitute more R for less M—is equal to MUR/MUM and is also equal
to minus the slope of the indifference curve when R is on the
horizontal axis and M is on the vertical axis. Convex indifference
curves get flatter as you move to the right along the horizontal axis
and steeper as you move upward along the vertical axis because of
diminishing
marginal utility:
a
consumer requires more and more units of R to substitute for a
forgone unit of M as the amount of R consumed rises relative to the
amount of M consumed.
he
marginal
rate of substitution,
or MRS,
of R in place of M—the rate at which a consumer is willing to
substitute more R for less M—is equal to MUR/MUM and is also equal
to minus the slope of the indifference curve when R is on the
horizontal axis and M is on the vertical axis. Convex indifference
curves get flatter as you move to the right along the horizontal axis
and steeper as you move upward along the vertical axis because of
diminishing
marginal utility:
a
consumer requires more and more units of R to substitute for a
forgone unit of M as the amount of R consumed rises relative to the
amount of M consumed.
The tangency condition between the indifference curve and the budget line holds when the indifference curve and the budget line just touch. This condition determines the optimal consumption bundle when the indifference curves have the typical convex shape.
The relative price rule says that at the optimal consumption bundle, the marginal rate of substitution between two goods is equal to their relative price. At the optimal consumption bundle:−MUR /MUM = − PR /PM. Optimal consumption rule: MUR / PR= MUM /PM