

Consumption, Savings, and Investments. Income and Expenditure. "Keynesian Cross". Потребление, сбережение. Инвестирование. Доход-затраты. Кейнсианский крест.
C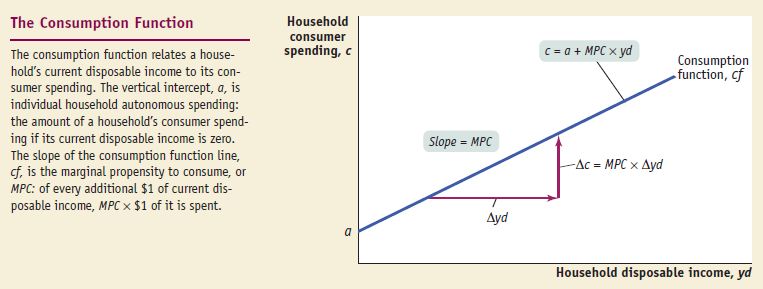 onsumption
is income spent by a household. Consumption
function
is an equation showing an individual household’s consumer spending
with the household’s current disposable income. c=a + MPC x yd,
where yd – individual disposable income, MPC – marginal
propensity to consume, a – autonomous consumption. Aggregate
consumption function is
the relationship between disposable income and aggregate consumer
spending.
Shifts:
1) change in expected future income; 2) change in aggregate wealth.
The marginal
propensity to consume,
or MPC, is the increase in consumer spending when disposable income
rises by $1 or the slope of the consumption function. The
multiplier
is the ratio of the total change in real GDP caused by an autonomous
change in aggregate spending to the size of that autonomous change.
Multiplier=1/(1-MPC).
Assumptions: 1) Changes in overall spending lead to changes in
aggregate output. The aggregate price level is fixed; 2) The interest
rate is fixed; 3) Taxes, transfers, and government purchases are all
zero; 4) There is no foreign trade.
onsumption
is income spent by a household. Consumption
function
is an equation showing an individual household’s consumer spending
with the household’s current disposable income. c=a + MPC x yd,
where yd – individual disposable income, MPC – marginal
propensity to consume, a – autonomous consumption. Aggregate
consumption function is
the relationship between disposable income and aggregate consumer
spending.
Shifts:
1) change in expected future income; 2) change in aggregate wealth.
The marginal
propensity to consume,
or MPC, is the increase in consumer spending when disposable income
rises by $1 or the slope of the consumption function. The
multiplier
is the ratio of the total change in real GDP caused by an autonomous
change in aggregate spending to the size of that autonomous change.
Multiplier=1/(1-MPC).
Assumptions: 1) Changes in overall spending lead to changes in
aggregate output. The aggregate price level is fixed; 2) The interest
rate is fixed; 3) Taxes, transfers, and government purchases are all
zero; 4) There is no foreign trade.
In the Paradox of Thrift, households and producers cut their spending in anticipation of future tough economic times. These actions depress the economy, leaving households and producers worse off than if they hadn’t acted virtuously to prepare for tough times. It is called a paradox because what’s usually “good” (saving to provide for your family in hard times) is “bad” (because it can make everyone worse off).
P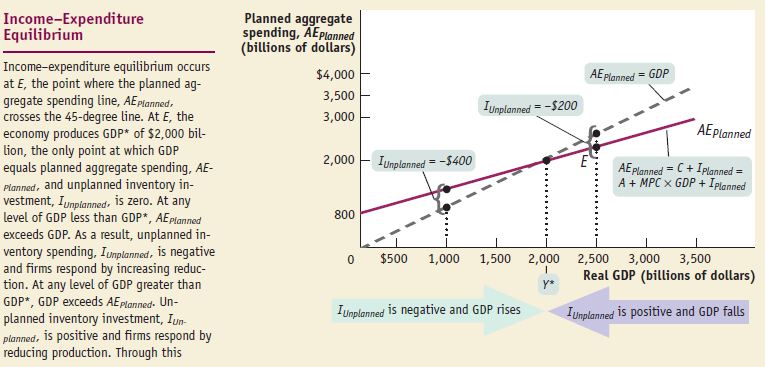 lanned
investment spending
is the investment spending that businesses plan to undertake during a
given period. It depends negatively
on: 1) interest
rate;
2) existing
production capacity
and positively
on: 1) expected
future real GDP.
Unplanned
inventory investment
occurs when actual sales are more or less than businesses expected,
leading to unplanned changes in inventories. Actual
investment spending
is the sum of planned investment spending and unplanned inventory
investment. Planned
aggregate spending
is the total amount of planned spending in the economy. AEplanned=
C + Iplanned
lanned
investment spending
is the investment spending that businesses plan to undertake during a
given period. It depends negatively
on: 1) interest
rate;
2) existing
production capacity
and positively
on: 1) expected
future real GDP.
Unplanned
inventory investment
occurs when actual sales are more or less than businesses expected,
leading to unplanned changes in inventories. Actual
investment spending
is the sum of planned investment spending and unplanned inventory
investment. Planned
aggregate spending
is the total amount of planned spending in the economy. AEplanned=
C + Iplanned
Income-expenditure equilibrium GDP is the level of GDP at which GDP equals planned aggregate spending. GDP=C + I= C + Iplanned + Iunplanned= AEplanned + Iunplanned. The Keynesian cross is a diagram that identifies income-expenditure equilibrium as the point where a planned aggregate spending line crosses the 45-degree line. (as shown above)
Savings–investment spending identity: savings and investment spending are always equal for the economy as a whole. The government is a source of savings when it runs a positive budget balance or budget surplus; it is a source of dissavings when it runs a negative budget balance or budget deficit.
In a closed economy, savings is equal to national savings, the sum of private savings plus the budget balance
SPrivate = GDP + TR − T − C
SGovernment = T − TR − G
NS = SPrivate + SGovernment = (GDP + TR − T − C) + (T − TR − G) = GDP − C − G => NS=I
An open economy is an economy in which goods and money can flow into and out of the country. In an open economy, savings is equal to national savings plus capital inflow of foreign savings. When a capital outflow, or negative capital inflow, occurs, some portion of national savings is funding investment spending in other countries
KI = IM − X - Capital inflow is net inflow of funds into a country.
I = (GDP − C − G) + (IM − X)
I = SPrivate + SGovernment + (IM − X) = NS + KI
T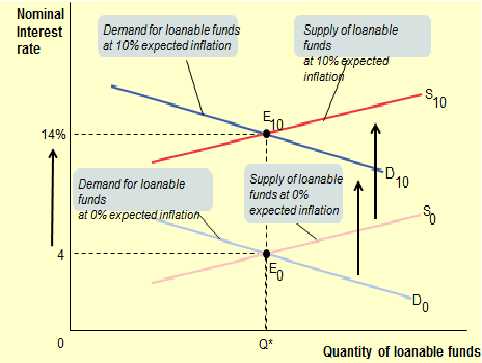 he
loanable
funds market
shows how loans from savers are allocated among borrowers with
investment spending projects. In equilibrium, only those projects
with a rate
of return
greater than or equal to the equilibrium interest
rate
will be funded. Government budget deficits can raise the interest
rate (high D) and can lead to crowding
out
=> reducing investment spending.
he
loanable
funds market
shows how loans from savers are allocated among borrowers with
investment spending projects. In equilibrium, only those projects
with a rate
of return
greater than or equal to the equilibrium interest
rate
will be funded. Government budget deficits can raise the interest
rate (high D) and can lead to crowding
out
=> reducing investment spending.
Shifts: D curve: changes in perceived business opportunities (expectation of increase/decrease of interest rate) and in government borrowing (higher borrowings => higher interest rates); S curve: changes in private savings (higher savings => higher interest rate) and capital inflows (greater inflow => higher interest rate).
Real interest rate = nominal interest rate - inflation rate
Fisher effect: an increase in expected future inflation drives up the nominal interest rate, leaving the expected real interest rate unchanged.
The Money Market. The demand and supply for money, factors that determine them. Equilibrium in the money market. Рынок денег. Спрос на деньги и предложение денег. Факторы их определяющие. Равновесие на денежном рынке.
Money market is nowadays a component of the financial markets for assets involved in short-term borrowing, lending, buying and selling with original maturities of one year or less. Trading in the money markets is done over-the-counter. Various instruments like Treasury bills, commercial paper, bankers' acceptances, deposits, certificates of deposit, bills of exchange, repurchase agreements, federal funds, and short-lived mortgage- and asset-backed securities do exist. It provides liquidity funding for the global financial system. Money markets and capital markets are parts of financial markets.
Money
Demand There
are two main theories of money demand. The first is the portfolio
theory. This suggests that if the riskiness of holding bonds
increases, it is likely that you will reduce the amount of bonds you
are holding and transfer this into other assets, with the likely
result that money demand will increase.  The
other theory is the transaction theory. It emphasizes the importance
of money over other assets because it is the only one that is useful
for purchasing things.
The
other theory is the transaction theory. It emphasizes the importance
of money over other assets because it is the only one that is useful
for purchasing things.
The MD curve shows the relationship between the Q of MD and i. Shifts of the Real MD: changes in price level, changes in real GDP, changes in technology, changes in institutions. (greater => higher MD => to the right). It is downward sloping due to the opportunity cost of holding money.
Money supply is the total value of financial assets in the economy that are considered money, consists of checkable or near-checkable bank deposits (D) plus currency in circulation (C). The monetary base is the sum of currency in circulation (C) and bank reserves. Through the creation of checkable bank deposits banks affect the money supply in two ways: 1) Banks remove some currency from circulation; 2) Banks create money by accepting deposits and making loans.
So, each dollar of bank reserves backs several dollars of bank deposits, making the money supply larger than the monetary base.
Money supply is measured by monetary aggregates: M1 and M2. M1 (most liquid) = C + D + traveler’s checks. M2 = M1 + NEAR MONEY (savings/time deposits and money market funds).
The quantity theory of money is the theory that money supply has a direct, proportional relationship with the price level. Keynes argued that saving and investment are not the main determinants of interest rates. Instead, the supply of and the demand for the money determine interest rates in the short run.
The MS curve shows how the nominal Q of MS varies with i. Shifts depends on Fed policy.
According to the liquidity preference model, the interest rate is determined by the MS & MD.
Role: IRs are crucial as they influence investment level (I), output (Y), merchandise trade balance (negative relation) and foreign capital inflows (positive relations).
In fact, there is monetary neutrality: changes in the MS have no real effect on the economy. So, monetary policy is ineffectual in the long run.
A central bank is an institution that oversees and regulates the banking system and controls the monetary base. Instruments of money supply regulation: reserve requirements, the discount rate, and open-market operations. Reserve requirement is minimum reserve ratio for banks’ checkable deposits. If bank can’t meet the requirements, it borrows from federal funds market at federal funds rate determined by S&D for funds. The discount rate is the rate of interest the Fed charges on loans to banks (1pp above the federal funds rate). Open-market operations: the Fed can increase or reduce the monetary base by buying government debt from banks or selling government debt (T-bills) to banks. An open-market purchase of T-bills increases the monetary base and the money supply and vice versa.
Bank reserves are the currency banks hold in their vaults plus their deposits at the Fed. The reserve ratio = reserves/deposits.
If the Fed reduces reserve requirements, banks will lend a larger percentage of their deposits, leading to more loans and an increase in the money supply via the money multiplier and vice versa. Money multiplier is the ratio of the money supply to the monetary base. Or in simple words, When currency is deposited in a bank, it starts a multiplier process in which banks lend out excess reserves, leading to an increase in the money supply- multiplication by banking multiplier = 1/rr—so banks create money.