

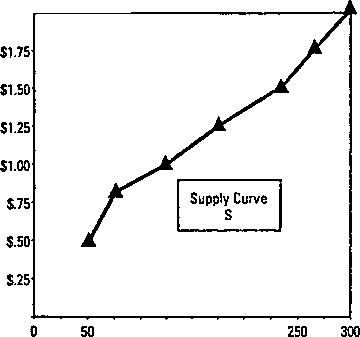
Supply for Ice Cream Cones Near Your School
Price per Cone Price per Cone
number of cones
0 50 100 150 200 250 300
number of cones
As in the case of demand, supply curves need not be straight lines. Unlike demand, the typical supply curve slopes upward from left to right.
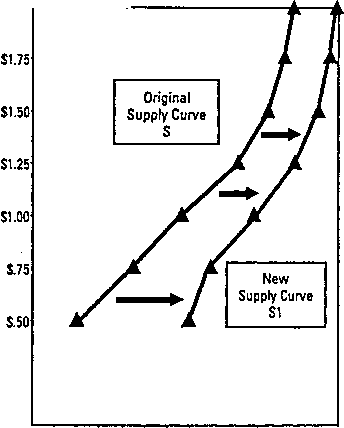
Changes in Supply. When supply changes, the entire supply curve shifts either to the right or to the left. This is simply another way of saying that sellers will be offering either more (if supply has increased) or less (if supply has decreased) of an item at every possible price. Any or all of the following changes are likely to affect the quantities supplied.
Changes in the cost of production. If it costs sellers less to produce their products, they will be able to offer more of them for sale. An increase in production costs will have the opposite effect — supply will decrease.
Other profit opportunities. Most producers can make more than one product. If the price of a product they have not been producing (but could if they chose to) increases, many will shift their output to that product. For example, as personal computers increased in popularity, a need developed for computer stands. As a result, many furniture manufacturers began to produce desks and carts specifically designed for the computer market. |
Future expectations. If producers expect prices to increase in the future, they may increase their production now to be in position to profit later. Similarly, if prices are expected to decline in the future, producers may reduce production, and supply will fall.
Changes in supply are illustrated graphically in Figure 6.
 Price
per Cone
Price
per Cone
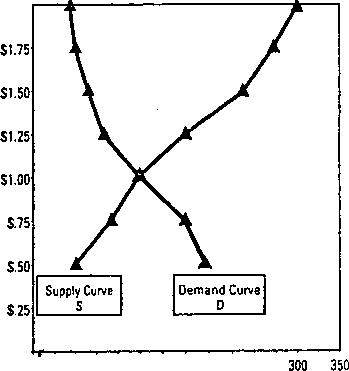
The price at which supply exactly equals demand is known as the market price, or the point of equilibrium. In the table above, the market price would be $1.00 because at that price the quantity of ice cream cones demanded and the quantity supplied are exactly equal. Figure 8 represents this information graphically.
Supply of and Demand for Ice Cream Cones Near Your
School
number of cones
Equilibrium
Supply and demand schedules tell us how many items buyers would purchase and how many items sellers would offer at different prices. By themselves they do not tell us at what price goods or services would actually change hands. When the two forces are brought together, however, something quite significant takes place. The interaction of supply and demand will result in the establishment of an equilibrium or market price. The market price is the one at which goods or services will actually be exchanged for money.
Exercise 1. Translate and identify what terms are meant.
Графическое изображение взаимосвязи между рыночной ценой товара или услуги и тем количеством, которое по этой цене будут спрашивать покупатели.
Положение на рынке, при котором количество товаров или услуг, которые хотят приобрести потребители, абсолютно идентично количеству товаров и услуг, которые желают преложить производители, и, таким образом, силы, влияющие на спрос и предложение на рынке, сбалансированы.
Степень изменения в количестве предлагаемых товаров и услуг в ответ на изменения в их цене, измеряемая как отношение процентного изменения в количестве к процентному изменению в цене.
Желание и способность продавцов поставлять на рынок товары для продажи.
Группа товаров и услуг, для которых рост цены на один из них приведет к увеличению спроса на все другие. Такими товарами являются, например, чай и кофе.
Закон, отражающий взаимосвязь между количеством потребляемого блага и степенью удовлетворенности от потребления каждой дополнительной единицы.
Exercise 8.6 (Study Guide). Complete the text using the words in the box.
-
in turn
responses
equilibrium
quantity
affect
important
shifts
so firth
movements
in contrast
price
adjustment
without distinguishing
matter
In everyday language we refer to an increase in demand ..... between shifts in the demand curve and movements along a given demand curve.
The demand curve ..... when any of the factors ..... quantity demanded (other than the price of the good) change. Such shifts show the ..... of consumers to changes in the prices of other goods, income, tastes, and ..... .
....., a movement along a demand curve shows the response of quantity demanded to a change in the ..... of the good itself.
Why does the difference .....? A shift of the demand causes ..... price and quantity to change, but ..... along the demand curve are just part of the process by which the market comes into equilibrium.
This distinction between the two kinds of demand change is very ..... . Movement along the demand curve represents consumer ..... to changes in the market price. Shifts in the demand represent adjustment to outside factors (other prices, income, tastes) and lead ..... to changes in equilibrium price and ..... .
Exercise 8.11 (Study Guide).
Read the text attentively. Point out the essential problems touched upon. Divide the text into logical units. Suggest a plan of the text in the form of statements in English. Render the text in English.
The following word-combinations can be of use:
the average income of potential buyers; the quantity of haircuts demanded; to be determined by social conventions; to depend on fashion; exercise centers; natural foods; expected future prices; gasoline prices.
Число потребителей.
При постоянном среднем доходе потенциальных покупателей, чем больше число потребителей на рынке, тем больше объём спроса на любой товар при всякой цене. Таким образом, увеличение числа потребителей переместит кривую спроса вправо. Сокращение числа потребителей сдвинет кривую спроса влево.
Вкусы потребителей
Вкусы или предпочтения потребителей являются важнейшим фактором, определяющим объём спроса на любой товар. Предпочтения потребителей формируются частично под влиянием общества, обычаев и рекламы. Например, объём спроса на стрижки определяется, в частности, существующими в обществе обычаями относительно того, какой длины должны быть волосы. Объём спроса на ткани для производства юбок зависит частично от моды. Растущая озабоченность собственным здоровьем и работоспособностью повысила спрос на принадлежности для бега, на услуги центров физической культуры, на натуральную пищу, сократив в то же время объёмы спроса на кондитерские изделия и другие высококалорийные продукты.
Обычаи и привычки меняются, как правило, довольно медленно. Мода может меняться быстро. Но какой бы ни была причина, по которой вкусы потребителей или их предпочтения по отношению к какому-либо товару меняются, кривая спроса на этот товар сдвигается соответствующим образом.
Ожидаемые в будущем цены
Объём спроса на товар в пределах какого-либо данного периода зависит не только от цен, складывающихся в этом периоде, но также от цен, которые ожидаются в будущем. Например, объём спроса на автомобили в данном месяце может быть выше при любой данной цене, если ожидается рост цен на автомобили в следующем месяце. Точно так же величина спроса на автомобили в этом месяце зависит от цен, которые потребители предполагают платить за бензин в будущем. Если ожидается, что цена на бензин в будущем будут значительно выше, то объём спроса на автомобили в данном месяце будет ниже при любой заданной цене, чем если бы не ожидалось роста цен на бензин.
Ожидаемые в будущем доходы также окажут влияние на объёмы спроса в текущем периоде. Если люди верят, что их доходы вырастут в ближайшем будущем, то качество товаров, которое они желали бы приобрести по любой данной цене в данном периоде, увеличится.
Optional: Video (Economics TTC, Lecture 5 “Elasticity”)