

vk.com/id446425943 |
Rusagro |
Russia |
|
Consumer: Consumer Products |
|
Financial forecasts: Path to mid-cycle EBITDA
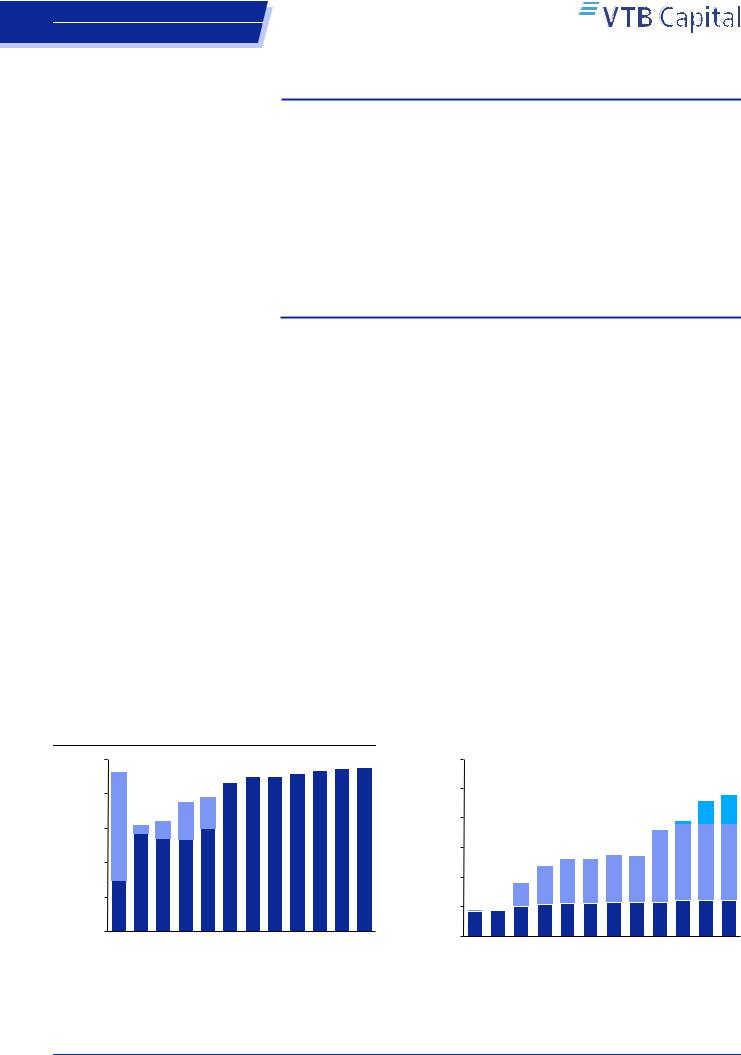
Figure 22: Sugar sales
1,000
|
800 |
|
|
|
|
|
tonnes |
|
|
|
|
218 |
184 |
600 |
627 |
57 |
108 |
|
||
|
|
|||||
|
|
|
||||
000 |
400 |
|
|
|
|
|
|
|
|
|
|
|
|
|
200 |
|
567 |
540 |
535 |
600 |
|
299 |
|
|
|
|
|
|
|
|
|
|
|
|
|
- |
2011 |
2012 |
2013 |
2014 |
2015 |
|
|

 Beet
Beet
The pork division brings most of the organic growth in our model, with 1.8x higher breeding capacities upon the launch of the Tambov and Russian Far East projects.
Larger meat segment and recovering prices return a 10% top line CAGR over the next five years. Revenues are evenly balanced between sugar, meat and farming.
The consolidated EBITDA margin was pressured last year and reported at 18%. Our mid-cycle assumption of 24% implies EBITDA doubling by 2022F.
Capex peaks at RUB 21bn in 2018F and the heavy period ends next year (RUB 17bn). We factor full deleveraging in three years and a blended dividend yield of 8%.
The organic growth for Rusagro primarily stems from the breeding division. In 201922F, we factor the Tambov, Russian Far East, and the consolidation of Capitalagro to increase pork capacities 1.8x to 360,000 tonnes in live weight and make Rusagro the second largest pork producer in Russia. We factor only the first stage of the Russian Far East project that primarily targets domestic regions. Were Rusagro to find a strategic partner for the project that could support export operations to Asian countries, the facility could see a multiple expansion, implying upside risks to our model.
The Oil & Fats business was the smallest in Rusagro’s portfolio, and the company had been considering either disposing of its existing assets or a sizable acquisition. In early October, Rusagro announced the intention to acquire the second largest crusher in Russia, Solnechnye Producty. The target controls 1.4mnt of extraction capacity, 500,000t of fats products, 650,000t of silos, and 150,000ha of farming land. The deal could provide Rusagro with a 20% market share and make the segment comparable in size to sugar, meat and farming. We note that the deal is mostly to be structured through servicing the target’s debt, but that as the terms have not finalised or the details announced, we are not including it in our model.
Our sugar volumes are flattish from current levels over the forecast period as recently acquired plants are mostly integrated and optimised while efficiency projects in molasses are on stream. Our land bank increases from 700,000ha at present to 800,000ha by 2022F to reflect the aim to produce more soft commodities in the Russian Far East and be more vertically integrated into sugar beet (50% selfsufficiency vs. targeted 65%).
|
|
|
|
|
|
|
|
Figure 23: Breeding capacities |
|
|
|
|
|
|
|
||||||||||
|
|
|
|
|
|
|
|
|
450 |
|
|
|
|
|
|
|
|
|
|
|
|
|
|
|
|
|
|
|
|
|
|
|
|
|
375 |
|
|
|
|
|
|
|
|
|
|
|
|
|
|
345 |
360 |
|
|
|
|
|
|
|
|
|
|
|
|
|
|
|
|
|
|
|
|
|
|
|
|
|
|
|
|
|
|
|
|
|
|
|
300 |
|
|
|
|
|
|
|
|
|
|
|
|
|
295 |
60 |
75 |
|
|
|
|
|
|
|
|
|
|
|
|
|
|
|
|
|
|
|
|
|
|
|
|||
|
|
|
|
|
|
|
|
tonnes |
|
|
|
|
|
|
|
|
|
|
|
|
270 |
10 |
|
|
|
|
|
|
|
|
|
|
|
|
|
|
|
|
|
|
|
|
|
|
|
|
|
|
|||
866 |
900 |
900 |
919 |
936 |
945 |
950 |
225 |
|
|
|
|
|
181 |
198 |
198 |
207 |
205 |
|
|
|
|
||||
|
|
|
|
|
|
000 |
|
|
|
|
|
|
|
|
|
|
|
|
185 |
195 |
195 |
195 |
|||
|
|
|
|
|
|
|
|
150 |
|
|
|
|
137 |
|
|
|
|
|
|
|
|||||
|
|
|
|
|
|
|
|
|
|
|
|
|
100 |
115 |
115 |
122 |
120 |
|
|
|
|
||||
|
|
|
|
|
|
|
|
|
|
|
|
|
|
61 |
|
|
|
|
|
|
|
|
|
|
|
|
|
|
|
|
|
|
|
|
|
64 |
68 |
|
|
|
|
|
|
|
|
|
|
|
|||
|
|
|
|
|
|
|
|
|
75 |
|
|
|
|
|
|
|
|
|
90 |
90 |
90 |
||||
|
|
|
|
|
|
|
|
|
|
64 |
66 |
76 |
81 |
83 |
83 |
85 |
85 |
85 |
|||||||
2016 |
2017 |
2018F |
2019F |
2020F |
2021F |
2022F |
|
- |
2011 |
2012 |
2013 |
2014 |
2015 |
2016 |
2017 |
2018F |
2019F |
2020F |
2021F |
2022F |
|||||
|
|
||||||||||||||||||||||||
|
Cane |
|
|
|
|
|
|
|
|
|
|
Belgorod |
|
Tambov |
|
Far East |
|
|
|
||||||
|
|
|
|
|
|
|
|
|
|
|
|
|
|
|
|||||||||||
|
|
|
|
|
|
|
|
|
|
|
|
|
|
|
|||||||||||
Source: Company data, VTB Capital Research |
|
Source: Company data, VTB Capital Research |
21 November 2018 |
12 |
vk.com/id446425943 |
Rusagro |
Russia |
|
Consumer: Consumer Products |
|
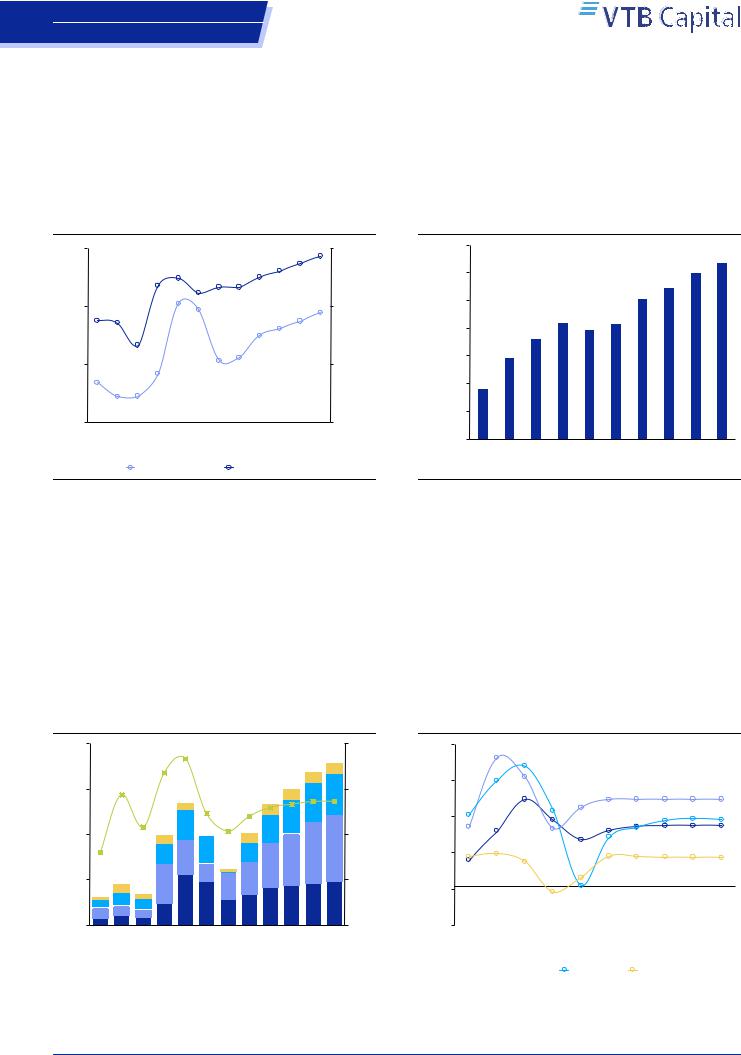
The launch of the new marketing year across various soft commodities brought a 2030% uplift in prices, as global prices bounced from the ten-year bottom, domestic supply-demand balances see lower harvest for grain (down 20% YoY) and beet (down 15% YoY), and USDRUB is weaker. Factoring those for 2018-19F, we see rouble prices growing with blended CPI of 4% over the further forecast period and arriving at a 2018-22F top line CAGR of 10%. The contribution of the pork segment increases from 25% in 2018F to 35% at the expense of sugar (37% vs. 32%) and oil and fats (23% vs. 18%) divisions.
Figure 24: Sugar and meat prices
50 |
|
|
|
|
|
|
|
|
|
|
107 |
111 |
115 |
|
|
|
|
96 |
99 |
|
95 |
95 |
100 |
103 |
|
|
|
|
|
|
|
|
92 |
|
|
|
|
|
|||
|
|
|
|
|
40 |
|
|
|
|
|
|
|
|
40 |
|
|
|
|
39 |
|
|
|
|
|
39 |
85 |
|
78 |
|
|
|
|
|
|
|
|
37 |
||||
76 |
|
|
|
|
|
|
|
|
|||||
/ kg |
|
|
|
|
|
|
|
36 |
|
/ kg |
|||
|
|
|
|
|
|
|
|
35 |
|
|
|||
|
|
|
|
|
|
|
|
|
|
|
|||
RUB |
|
|
65 |
|
|
|
|
|
|
|
|
|
RUB |
30 |
|
|
28 |
|
|
|
|
|
|
|
|
55 |
|
27 |
|
|
|
|
31 |
31 |
|
|
|
|
|||
|
|
|
|
|
|
|
|
|
|
|
|
||
|
|
25 |
25 |
|
|
|
|
|
|
|
|
|
|
20 |
2011 |
2012 |
2013 |
2014 |
2015 |
2016 |
2017 |
2018F |
2019F |
2020F |
2021F |
2022F |
25 |
|
|
||||||||||||
|
|
|
Sugar price (lhs) |
|
Pork price (rhs) |
|
|
||||||
Source: Company data, VTB Capital Research
Figure 25: Revenue forecast
140
127
|
120 |
|
|
|
|
|
|
|
|
120 |
|
|
|
|
|
|
|
|
|
109 |
|
|
|
|
|
|
|
|
|
|
|
102 |
|
|
|
|
100 |
|
|
|
|
|
|
|
|
|
|
|
|
|
|
|
|
|
|
|
|
|
|
bn |
80 |
|
|
|
84 |
79 |
84 |
|
|
|
|
|
|
72 |
|
|
|
|
|
|
|||
|
|
|
|
|
|
|
|
|
|||
RUB |
60 |
|
59 |
|
|
|
|
|
|
|
|
|
|
|
|
|
|
|
|
|
|
|
|
|
40 |
36 |
|
|
|
|
|
|
|
|
|
|
20 |
|
|
|
|
|
|
|
|
|
|
|
- |
2013 |
2014 |
2015 |
2016 |
2017 |
2018F |
2019F |
2020F |
2021F |
2022F |
|
|
Source: Company data, VTB Capital Research
In 2017, Rusagro saw a 23% YoY decline in EBITDA to RUB 14bn as the oversupplied sugar market brought a dilution in refining profitability and made beet growing loss making. In addition, the oil and fats market was going through a period of aggressive promotional activities and experienced an unfavourable procurement campaign.
The recovery in prices over the last three months and improving operations across segments mean that we factor an improvement in the EBITDA margin from 18% last year to 21% in 2018 and 23% next year. The latter is reaching our mid-cycle profitability level and corresponds to the average results in 2013-17. Coupled with the aforementioned capacity build-up, the profitability brings EBITDA 1.8x higher by the end of the forecast period at RUB 31bn.
Figure 26: Rusagro EBITDA forecast |
|
|
|
|
Figure 27: Operational segments’ EBITDA margin |
|||||||||||||||||||
|
40 |
|
|
|
34% |
|
|
|
|
|
|
31.0 |
37% |
55% |
|
50% |
|
|
|
|
|
|
|
|
|
|
|
|
|
|
|
|
|
|
|
|
|
|
47% |
|
|
|
|
|
|
|
|||
|
|
|
|
31% |
|
|
|
|
|
|
29.1 |
|
|
|
|
|
|
|
|
|
|
|
||
|
|
|
|
|
|
|
|
|
|
|
|
|
|
41% |
|
|
|
|
|
|
|
|
||
|
|
|
|
|
|
|
|
|
|
25.8 |
|
|
|
41% |
|
42% |
|
|
|
|
|
|
|
|
|
|
26% |
|
|
|
|
|
|
|
|
|
|
|
|
|
|
|
|
|
|
|
|||
|
30 |
|
|
|
|
|
|
|
|
|
27% |
|
|
34% |
|
|
34% |
34% |
34% |
34% |
34% |
|||
|
|
|
24.4 |
|
|
|
23.2 24% 24% 24% |
|
|
|
|
|
||||||||||||
|
|
|
|
22% |
|
|
|
|
|
29% |
31% |
|||||||||||||
|
|
|
|
|
|
|
21% |
|
|
|
8.9 |
|
|
28% |
|
|
|
|
|
|
26% |
26% |
||
bn |
|
|
|
|
|
|
23% |
|
8.4 |
|
27% |
|
|
|
|
|
|
25% |
||||||
|
|
|
|
|
|
18% |
|
|
|
|
|
|
|
26% |
|
22% |
23% |
|||||||
|
|
19% 18.1 |
|
18.2 |
17.5 |
7.5 |
|
|
|
21% |
|
|
|
|
|
|||||||||
20 |
|
6.6 |
|
|
|
17% |
|
|
|
|
|
|
|
|
|
|||||||||
RUB |
|
|
|
6.2 |
13.7 14.8 |
|
23% |
13% |
|
22% |
|
19% |
|
23% |
24% |
24% |
||||||||
|
|
|
4.4 |
7.7 |
6.2 |
|
4.2 |
|
|
|
13% |
11% |
10% |
|
18% |
12% |
11% |
11% |
11% |
11% |
||||
|
13% |
|
|
14.0 |
10.0 |
11.3 |
|
|
|
|
||||||||||||||
|
|
|
|
|
|
4.0 |
|
|
|
|
|
|
|
10% |
|
|
|
4% |
|
|
|
|
|
|
|
10 |
8.8 |
|
|
|
|
7.2 |
|
|
|
|
7% |
|
|
|
|
|
|
|
|
|
|||
|
|
8.8 |
|
|
|
|
|
|
|
|
|
|
|
|
|
|
|
|
|
|||||
|
6.8 |
|
|
6.3 |
|
|
|
|
-1% |
|
|
|
|
|
|
|
|
|
|
|||||
|
5.2 |
2.9 |
11.1 |
|
|
|
|
|
|
|
|
|
|
|
0% |
|
|
|
|
|
||||
|
1.9 |
2.4 |
|
9.6 |
|
|
|
|
9.2 9.6 |
|
|
|
|
|
-2% |
|
|
|
|
|
||||
|
4.8 |
5.5 |
6.7 |
8.2 |
8.7 |
|
|
|
|
|
|
|
|
|
|
|
||||||||
|
2.3 |
2.1 |
1.7 |
|
|
|
|
|
|
|
|
|
|
|
|
|
|
|
|
|
|
|||
|
- 1.4 |
2.1 |
1.7 |
|
|
|
|
|
|
|
|
|
-3% |
-15% |
|
|
|
|
|
|
|
|
|
|
2011 |
2012 |
2013 |
2014 |
2015 |
2016 |

 Sugar
Sugar 
 Meat
Meat 
 Agriculture
2017 |
2018F |
2019F |
Oil and Fat
2020F |
2021F |
2022F |
 EBITDA margin
2013 |
2014 |
2015 |
2016 |
 Sugar
Sugar  Meat
Meat
2017 |
2018F |
2019F |
2020F |
2021F |
2022F |
Agriculture |
Oil and Fat |
|
|||
Source: Company data, VTB Capital Research |
|
Source: Company data, VTB Capital Research |
21 November 2018 |
13 |

vk.com/id446425943 |
Rusagro |
Russia |
|
Consumer: Consumer Products |
|
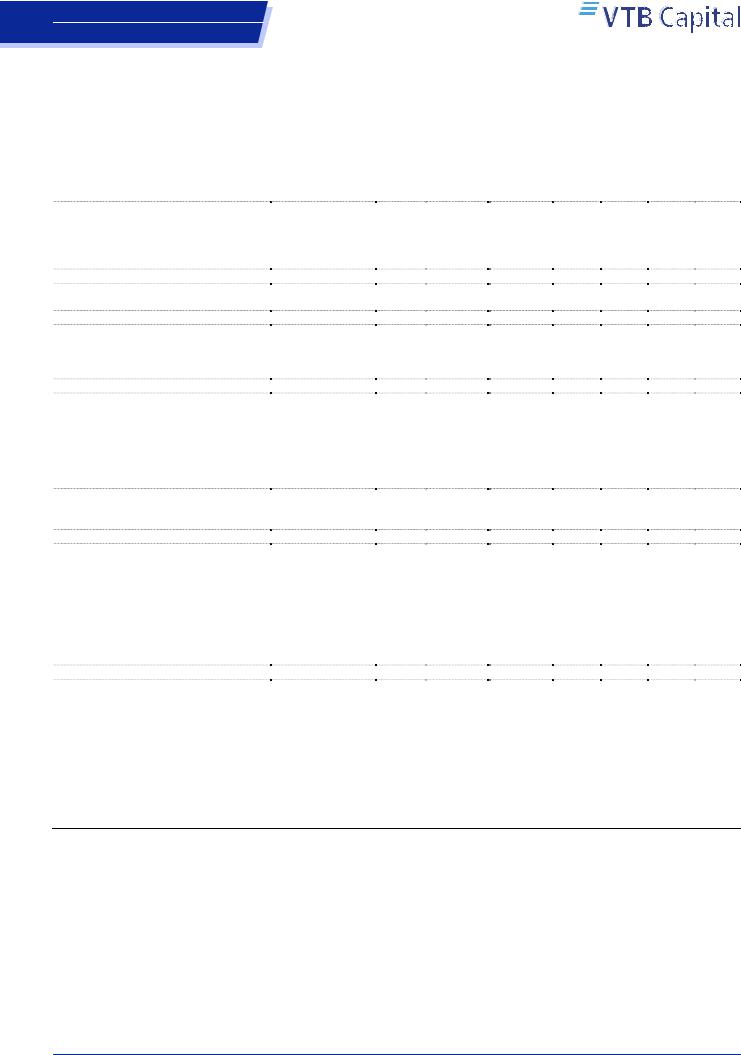
Rusagro is going through an aggressive investment period and we factor record high capital expenditures of RUB 21bn in 2018F. The meat division represents 60% of this figure, with prime spending on greenfield projects in Central Russia and the Russian Far East. For 2019F, we factor a deceleration to RUB 17bn and the completion of the capex-heavy cycle. From 2020F, our capex is matched with maintenance needs, i.e. RUB 8.5bn annually.
The disappointing start to the year and high capex needs return negative free cash flow generation of RUB 8bn in 2018F. Next year, our base case assumes slightly positive FCF, while the completion of the investment cycle is behind our terminal FCF yield of 25%. Net debt is to reach a record high RUB 16bn by YE18F, with a net debt / EBITDA ratio of 0.9x. Thereafter, our model assumes complete deleveraging in three years. We factor a blended 50% payout ratio from IFRS net income over the forecast period and arrive at an average dividend yield of 8%.
Figure 28: Rusagro cash flow management |
Figure 29: Free cash flow and dividend yields |
RUB bn
34 |
|
2.0x |
|
|
|
|
|
|
|
|
30.6 |
32.6 |
2.1x |
30% |
|
|
|
|
|
|
|
|
|
|
|
|
|
|
|
|
|
|
|
26% |
|||||
|
|
|
|
|
|
|
|
|
|
26.3 |
|
|
|
|
|
|
24% |
||
|
|
|
|
|
|
|
|
|
|
|
|
|
|
|
|
|
|
||
|
|
|
15.7 |
15.9 |
|
17.7 |
0.9x |
19.0 |
|
|
|
|
20% |
|
|
19% |
|
|
|
15 |
|
|
|
0.5x |
13.0 |
|
|
|
|
0.7x |
|
|
|
|
|
||||
|
|
|
0.6x |
11.8 |
0.8x |
|
|
|
|
|
|
|
|
|
|||||
|
|
|
|
|
|
|
|
|
|
|
|
|
|
|
|
|
|
|
|
|
4.8 |
0.1x |
|
0.2x |
|
|
|
|
0.3x |
|
|
|
10% |
|
|
|
|
13% |
|
|
|
|
|
|
|
|
|
|
|
-0.2x |
|
|
|
|
|
|
|||
|
|
|
|
|
|
|
|
|
|
|
|
|
|
6% |
|
10% |
|
||
|
|
|
|
|
|
|
|
|
|
|
|
|
|
|
9% |
|
|||
(5) |
(4.2) |
|
|
|
|
|
|
|
|
|
|
-0.7x |
|
4% |
|
||||
(5.2) |
|
|
|
|
|
|
|
|
-0.6x |
|
|
|
|
||||||
|
|
|
|
|
|
|
|
|
|
|
|
|
|
|
|||||
|
|
|
|
(11.4) |
|
|
|
|
|
(8.5) |
(8.5) |
(8.5) |
|
|
|
2% |
|
|
|
|
|
|
|
|
|
|
|
|
|
|
|
|
0% |
|
|
|
|
||
|
|
|
|
|
|
|
|
|
|
|
|
|
|
|
|
|
|
||
|
|
|
|
|
(16.6) |
(16.7) |
|
(17.0) |
|
|
|
|
|
|
|
|
|
||
|
|
|
|
|
|
|
|
|
|
|
|
|
|
|
|
||||
(24) |
|
|
|
|
|
|
|
(21.0) |
|
|
|
|
-2.1x |
|
|
|
|
|
|
2013 |
2014 |
2015 |
2016 |
2017 |
2018F |
2019F |
2020F |
2021F |
2022F |
|
|
|
|
|
|
||||
|
|
-10% |
-9% |
|
|
|
|
||||||||||||
|
|
|
|
|
|
|
|
|
|
|
|
|
|
|
|
|
|
||
|
|
Net operating CF |
|
Capex |
Net debt / EBITDA |
|
|
2018F |
2019F |
2020F |
2021F |
2022F |
|||||||
|
|
|
|
|
|
Dividend yield |
Free cash flow yield |
|
|||||||||||
|
|
|
|
|
|
|
|||||||||||||
|
|
|
|
|
|
|
|||||||||||||
Source: Company data, VTB Capital Research |
|
Source: Company data, VTB Capital Research |
21 November 2018 |
14 |
vk.com/id446425943 |
Rusagro |
|
|
|
|
|
|
|
|
|
Russia |
|
|
|
|
|
|
|
|
|
Consumer: Consumer Products |
|
|
|
|
|
|
|
|
|
Figure 30: Comparative valuation |
|
|
|
|
|
|
|
|
|
Company |
Region |
Price |
Mcap |
EV |
—EV/EBITDA, x— |
—P/E, x— |
||
|
|
|
USD |
USD mn |
USD mn |
2018F |
2019F |
2018F |
2019F |
|
Russia/CIS Median |
|
|
|
|
6.3 |
4.8 |
8.5 |
6.3 |
|
Rusagro* |
RUSSIA |
10.58 |
1,423 |
1,686 |
6.3 |
4.8 |
8.5 |
6.3 |
|
MHP |
UKRAINE |
10.55 |
1,127 |
2,312 |
4.8 |
4.2 |
5.6 |
4.5 |
|
KERNEL |
UKRAINE |
52.00 |
1,127 |
1,716 |
6.9 |
5.1 |
17.8 |
7.3 |
|
Developed markets |
|
|
|
|
7.7 |
7.5 |
13.1 |
14.2 |
|
GRAIN PRODUCERS |
|
|
|
|
9.0 |
8.3 |
18.1 |
14.2 |
|
ARCHER-DANIELS-MIDLAND CO |
UNITED STATES |
46.31 |
25,963 |
32,313 |
9.0 |
8.3 |
13.0 |
12.6 |
|
BUNGE LTD |
UNITED STATES |
58.41 |
8,241 |
15,800 |
7.0 |
6.5 |
12.2 |
10.8 |
|
KWS SAAT SE |
GERMANY |
329.42 |
2,174 |
2,178 |
11.0 |
10.6 |
19.4 |
19.4 |
|
GRAINCORP LTD-A |
AUSTRALIA |
5.48 |
1,254 |
1,927 |
9.5 |
10.8 |
28.0 |
77.4 |
|
ANDERSONS INC/THE |
UNITED STATES |
32.60 |
923 |
1,522 |
7.6 |
6.9 |
18.1 |
14.2 |
|
VEG. OIL PRODUCERS |
|
|
|
|
7.0 |
6.5 |
14.0 |
12.5 |
|
BUNGE LTD |
UNITED STATES |
58.41 |
8,241 |
15,155 |
6.7 |
6.1 |
12.2 |
10.8 |
|
SIPEF NV |
BELGIUM |
57.86 |
612 |
681 |
7.3 |
6.8 |
15.8 |
14.2 |
|
SUGAR PRODUCERS |
|
|
|
|
8.5 |
8.1 |
13.2 |
13.9 |
|
TATE & LYLE PLC |
BRITAIN |
8.78 |
4,104 |
4,491 |
7.9 |
8.1 |
13.3 |
13.4 |
|
AGRANA BETEILIGUNGS AG |
AUSTRIA |
20.05 |
1,253 |
1,623 |
4.8 |
6.9 |
7.6 |
14.1 |
|
GREENCORE GROUP PLC |
IRELAND |
2.46 |
1,743 |
2,482 |
9.1 |
8.1 |
13.1 |
13.6 |
|
ASSOCIATED BRITISH FOODS PLC |
BRITAIN |
31.90 |
25,251 |
24,559 |
9.8 |
9.4 |
18.9 |
18.3 |
|
MEAT PRODUCERS |
|
|
|
|
7.0 |
5.9 |
11.9 |
15.7 |
|
WH GROUP LTD |
HONG KONG |
0.83 |
12,179 |
15,503 |
6.5 |
5.9 |
11.2 |
10.2 |
|
HORMEL FOODS CORP |
UNITED STATES |
45.36 |
24,182 |
23,992 |
17.9 |
16.7 |
23.9 |
24.3 |
|
HKSCAN OYJ-A SHS |
FINLAND |
2.07 |
114 |
486 |
27.5 |
4.7 |
neg |
36.6 |
|
NH FOODS LTD |
JAPAN |
37.13 |
3,992 |
4,631 |
7.0 |
8.1 |
12.0 |
15.7 |
|
ATRIA OYJ |
FINLAND |
9.45 |
267 |
579 |
5.8 |
5.2 |
11.9 |
9.4 |
|
Emerging markets |
|
|
|
|
8.2 |
7.7 |
16.9 |
13.8 |
|
GRAIN PRODUCERS |
|
|
|
|
8.2 |
8.3 |
12.6 |
14.7 |
|
CHINA AGRI-INDUSTRIES HLDGS |
HONG KONG |
0.37 |
1,927 |
3,662 |
8.2 |
7.9 |
9.1 |
8.4 |
|
HEILONGJIANG AGRICULTURE-A |
CHINA |
1.31 |
2,328 |
2,031 |
12.5 |
12.1 |
17.4 |
16.3 |
|
SLC AGRICOLA SA |
BRAZIL |
13.57 |
1,294 |
1,652 |
8.2 |
8.3 |
12.6 |
14.7 |
|
VEG. OIL PRODUCERS |
|
|
|
|
9.1 |
8.3 |
21.1 |
16.5 |
|
IOI CORP BHD |
MALAYSIA |
1.03 |
6,315 |
7,636 |
13.0 |
17.6 |
21.4 |
26.7 |
|
KUALA LUMPUR KEPONG BHD |
MALAYSIA |
5.95 |
6,333 |
7,226 |
15.1 |
14.8 |
27.5 |
26.5 |
|
GOLDEN AGRI-RESOURCES LTD |
SINGAPORE |
0.17 |
2,183 |
5,056 |
9.1 |
7.5 |
n/m |
16.5 |
|
CHINA AGRI-INDUSTRIES HLDGS |
HONG KONG |
0.37 |
1,927 |
3,662 |
8.2 |
7.9 |
9.1 |
8.4 |
|
IJM PLANTATIONS BHD |
MALAYSIA |
0.44 |
389 |
524 |
10.1 |
10.6 |
22.6 |
27.4 |
|
SLC AGRICOLA SA |
BRAZIL |
13.57 |
1,294 |
1,652 |
8.2 |
8.3 |
12.6 |
14.7 |
|
SARAWAK OIL PALMS BERHAD |
MALAYSIA |
0.61 |
349 |
527 |
5.7 |
4.5 |
11.9 |
8.4 |
|
TSH RESOURCES BHD |
MALAYSIA |
0.25 |
340 |
679 |
13.3 |
11.7 |
20.9 |
16.9 |
|
TH PLANTATIONS BHD |
MALAYSIA |
0.14 |
125 |
515 |
8.3 |
7.3 |
26.3 |
15.2 |
|
MEAT PRODUCERS |
|
|
|
|
5.6 |
4.5 |
14.0 |
8.1 |
|
INDUSTRIAS BACHOCO-SER B |
MEXICO |
3.40 |
2,042 |
1,384 |
5.3 |
4.4 |
11.2 |
10.9 |
|
ASTRAL FOODS LTD |
SOUTH AFRICA |
13.23 |
567 |
513 |
2.9 |
3.7 |
5.3 |
6.6 |
|
JBS SA |
BRAZIL |
2.88 |
7,865 |
20,786 |
5.2 |
4.8 |
18.7 |
7.3 |
|
GFPT PUBLIC CO LTD |
THAILAND |
0.45 |
560 |
641 |
9.0 |
7.6 |
16.9 |
12.9 |
|
MARFRIG GLOBAL FOODS SA |
BRAZIL |
1.65 |
1,028 |
4,946 |
5.9 |
4.3 |
n/m |
8.9 |
|
MINERVA SA |
BRAZIL |
1.55 |
351 |
2,146 |
5.9 |
4.6 |
n/m |
5.0 |
|
Developed markets |
|
|
|
|
7.7 |
7.5 |
13.1 |
14.2 |
|
Grain producers |
|
|
|
|
9.0 |
8.3 |
18.1 |
14.2 |
|
Vegetable oil producers |
|
|
|
|
7.0 |
6.5 |
14.0 |
12.5 |
|
Sugar producers |
|
|
|
|
8.5 |
8.1 |
13.2 |
13.9 |
|
Meat producers |
|
|
|
|
7.0 |
5.9 |
11.9 |
15.7 |
Source: Company data, VTB Capital Research (marked with an ‘*’); Bloomberg as of 19 November 2018 (all the rest)
21 November 2018 |
15 |